

Abstract
The development and popularity of wearable electronics increase demand for wearable energy harvesters that can scavenge energy from environment or human body movements. In this paper, we present a novel yarn as a wearable piezoelectric nanogenerator (PNG) consisting of a layer of electrospun poly(vinylidene fluoride) (PVDF) nanofibers integrated with PVDF film around a silver deposited nylon filament acting as an inner electrode. Electrospun PVDF nanofiber was wrapped around core yarn using a customized electrospinning device followed by coating of PVDF solution. The mesh of PVDF electrospun layer ensured uniform coating of PVDF solution, and the after coated PVDF film improved interfacial properties with inner electrode as well as strengthened the abrasion resistance of the piezoelectric polymer layer. The resultant unique yarn produced an average peak voltage of 0.52 V, peak current of 18.76 nA, and power density of 5.54 μW cm−3 under a cyclic compression of 0.02 MPa at 1.85 Hz, which is significantly higher than the energy output of a yarn with only a PVDF electrospun nanofibrous layer. More importantly, the high-performance was retained after 50 000 cycles of compression. The flexible yarn-based PNG device with good energy output and durability demonstrated its great promise to be used as a wearable energy harvester.
Export citation and abstract BibTeX RIS
1. Introduction
With the development of electronics, the electric power consumption has been significantly decreased, and it is possible to harvest energy from human body motions or ambient to power the miniaturized devices. For example, Talla et al developed a battery-free cellphone that only consumed 3.48 μW [1], and the power can be collected from ambient light or radio frequency signals. Piezoelectric energy harvesting method is preferable for the powering of wearable electronics, since it is capable of converting kinetic energy from human body movements into electricity regardless of environment. For piezoelectric energy harvesters made of piezoceramics, such as InN, ZnO, GaN, ZnS, PZT, BaTiO3, NaNbO3 and KNbO3, the brittleness limits applications in wearable fields [2]. In contrast, piezoelectric polymers, such as poly(vinylidene fluoride) (PVDF) and its copolymers, are flexible, light, chemically stable, and biocompatible, making them ideal for wearable energy harvester fabrication [3]. PVDF is one of the best options due to its high piezoelectric performance, good processability, chemical stability, and cost-effectiveness.
Textile-based piezoelectric devices are highly desirable as a wearable energy harvester since they can provide comfort as well as aesthetics to wearers. Most of all fiber-based piezoelectric energy harvesters have been developed in the form of fabrics [4–8]. Soin et al prepared a knitted piezoelectric fabric consisting of PVDF monofilaments as the spacer yarn interconnected between silver-coated polyamide yarn layers serving as electrodes, and the device exhibited an output power density of 5.10 mW cm−2 at an impact pressure of 0.10 MPa [4]. Electrospinning is an attractive method to make in situ oriented β phase based PVDF nanofibers due to the high stretch ratio as well as strong electrical field applied during fabrication [8, 9]. Tao et al developed an all-fiber wearable electric power nanogenerator composed of a PVDF–NaNbO3 electrospun nonwovern fabric sandwiched between two elastic conductive knitted fabrics, made from polyurethane yarns wrapped with silver coated polyamide multifilaments [5]. Xu et al [8] introduced a three-layered piezoelectric nanogenerator (PNG) in which PVDF nanofibrous mat was sandwiched between two PVDF-rGO (reduced graphene oxide) membranes through a continuous electrospinning and electrospraying method. The piezoelectric membrane exhibited an energy output as high as 18.1 μW cm−2 under a compressive force of 35 N at 10 Hz.
It is important to note that the energy harvesters developed on the fabric level are not versatile and convenient to be incorporated into clothes, so fiber/yarn-shape based energy generators are favored. Methods including melt spinning [10–12], coating of polymer solution [13, 14], and electrospinning [2, 15–18], were used to prepare piezoelectric fibers/yarns. Both bicomponent and tricomponent piezoelectric filaments were developed through melt spinning process using carbon-based nanoparticles/polymer (PP, PE, and ethylene-octene copolymer) compounds as electrodes and PVDF as electroactive piezoelectric material, which exhibited many advantages, such as low cost, high production rate, and environmentally friendly process [10–12]. Nevertheless, the performance is not satisfactory because of the risk of delamination between PVDF and electrode layers, and high resistance of the electrodes. Coating of piezoelectric polymer solution on high conductive electrode, such as metal wires and metal deposited polymer fibers, is another common method, but problems like poor adhesion between core electrode and polymer solution need to be addressed. Wang et al [14] developed a hybrid-fiber nanogenerator by growing ZnO nanowires on a metal deposited fiber followed by coating of PVDF through a dip coating process. The ZnO nanowires assisted the formation of a uniform PVDF coating layer. For a 2 cm yarn, 6 μW cm−3 can be generated through a fold-releasing motion of elbow. However, tedious process was involved to grow ZnO nanowires. Fu et al used electrowetting technique to solve the interfacial adhesion problem, and a uniform piezoelectric polymeric coating layer of 3–10 μm was achieved [13]. Electrospinning based piezoelectric yarns were also investigated [2, 16, 17]. Minary et al [2] developed a smart fabric by weaving electrospun PVDF-TrFE piezoelectric twisted plied yarns with conductive threads serving as electrodes. Due to the poor interfacial properties as well as small contact area between conductive threads (warp direction) and PVDF-TrFE yarns (weft direction), only ∼16.2 mV was generated for a piece of fabric (∼1 × 1 cm) under compression.
In this study, we have developed a facile procedure to fabricate a novel piezoelectric yarn composed of a unique PVDF layer by integrating electrospun nanofibers with PVDF film around a silver coated conductive filament. PVDF electrospun nanofibers were wrapped around core conductive yarn using a customized electrospinning equipment followed by coating of PVDF film, and the previously coated nanofibrous mesh functioned as a porous scaffold to attract PVDF solution ensuring a uniform PVDF film. The after coated film helps in improving the interfacial properties between PVDF layer of nanofibers and inner electrode. The resultant yarn demonstrated higher capability to convert kinetic energy into electricity compared to a yarn prepared by only wrapping electrospun PVDF nanofibers around a conductive filament electrode.
2. Experimental section
2.1. Materials
PVDF powder (Mw = 534 000) was purchased from Sigma-Aldrich, USA. Conductive silver coated nylon filament (diameter 80 μm, 25 Ω cm−1) was obtained from Shieldex, USA. N,N-Dimethylformamide (DMF) (Fisher Scientific, USA), and acetone (Fisher Scientific, USA) were used without further treatment.
2.2. Preparation of PVDF electrospun core-sheath yarn (E yarn) and electrospun + film core-sheath yarn (EF yarn) PNGs
A customized equipment depicted in figure 1(a) was used to deposit PVDF electrospun nanofibers around conductive core yarn for preparation of E yarn (electrospun core-sheath yarn), as shown in video S1 is available online at stacks.iop.org/SMS/27/095018/mmedia. During electrospinning, PVDF nanofibers were wrapped around the conductive yarn by a rotating disk (or twist disk). PVDF mat collected on the disk was used to study crystal structure. Electrospinning solution was prepared by dissolving 10 wt% PVDF in a mixture of DMF and acetone (2:3 by weight) stirred at 50 °C for 4 h. The distance between needle tip to the center of rotating plate, voltage, feed rate of polymer solution, and take up speed of core yarn were set as 12 cm, −15 kV, 0.02 ml min−1, and 2.5 cm min−1, respectively. The fabrication speed can be improved by using industry-scale electrospinning devices which incorporate multiple spinning units, like NS Production Line NS 8S1600U from Elmarco. For the preparation of EF yarn (electrospun + film core-sheath yarn), the fabricated E yarn was passed through a coating device containing PVDF solution (20 wt% PVDF in DMF) with an opening of 0.9 mm (figure 1(b)), and then passed through a 100 cm tank filled with 5 °C water/ice mixture at a speed of 60 cm min−1. To study crystal structure of the coated PVDF film layer, a piece of PVDF film was prepared under similar condition using a doctor blade with a gap of 200 μm. External electrodes of E and EF yarn were applied by depositing a 60 nm silver layer via electron beam evaporation method through a two-step process. First, we deposited silver on the top of fibers along the length direction, and then rotated them manually for the deposition on the bottom surface. Yarn samples were encapsulated in polydimethylsiloxane (PDMS) with a length of 3 cm and thickness of 4 mm for protection during testing. EF yarn encapsulated into PDMF was electrically poled by applying 1 kV between its external and inner electrode at an elevated temperature of 70 °C for 10 min, as shown in figure 2. The PDMS shell can restrain mechanical deformations of EF yarn during poling.
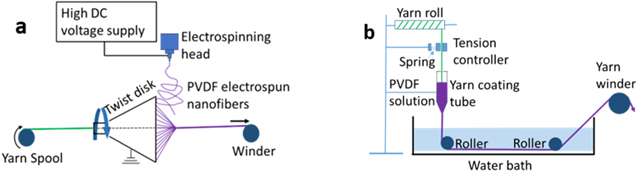
Figure 1. Schematics for (a) deposition of PVDF nanofibers around conductive core yarn by electrospinning followed by (b) coating of PVDF film.
Download figure:
Standard image High-resolution image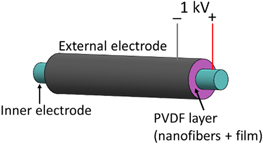
Figure 2. Schematic of electrical poling for EF yarn.
Download figure:
Standard image High-resolution image2.3. Characterization
Fourier transform infrared spectroscopy (FT-IR, Thermo-Nicolet AVATAR 360), was used to identify crystalline phases of PVDF, and the results were further confirmed by x-ray diffraction (XRD) analysis using x-ray diffractometer (Bruker D8 Advance) with CoKα1 as radiation source (λ = 1.788 92 Å) operated at 35 kV and 40 mA. The XRD patterns were recorded from 2θ = 5° to 35° at a scanning rate of 0.1 s/step with a step size of 0.01°. In order to investigate the degree of crystallinity, differential scanning calorimetry (Mettler Toledo DSC 821e) testing was performed from 20 °C to 230 °C at a rate of 10 °C min−1. The morphologies of the yarn samples were characterized using field emission scanning electron microscope (FE-SEM, FEI Teneo) under an operating voltage of 5 kV.
2.4. Measurement of energy output
Voltage and current output were measured by a Digital Oscilloscope (Rigol, DS 1054Z, sampling rate: 250M Hz) and Source Meter (Keithley 2400, sampling rate: 4 Hz), respectively, under a cyclic compression of 0.02 MPa at 1.85 Hz applied by Instron 3343 mechanical tester. As shown in figure 3, PNG encapsulated in PDMS was fixed on the stationary lower stage of Instron tester, and controlled oscillated compressive impacts were applied by the upper stage at a rate of 600 mm min−1.
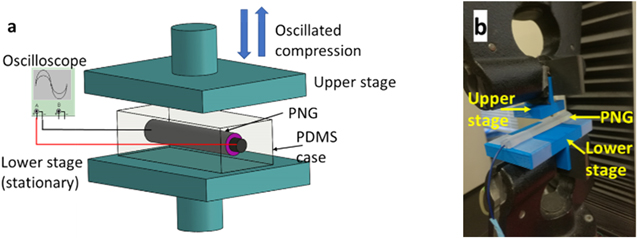
Figure 3. (a) Schematic and (b) photographic image of Instron Tester for applying controlled compressive motions.
Download figure:
Standard image High-resolution image3. Results and discussion
3.1. Morphology of PNG yarn
The longitudinal and cross-sectional SEM pictures of E yarn are illustrated in figures 4(a), (d). The SEM images show that electrospun fibers were wrapped around the conductive core yarn evenly and a nanofibrous layer with a thickness around 68 μm was formed. However, voids between the nanofibrous layer and conductive core yarn can be observed from figure 4(d) and schematic in figure 4(g). EF yarn was prepared by coating of PVDF solution on E yarn, and a uniform PVDF layer with an average thickness of 84 μm was formed owing to the high affinity of PVDF solution to PVDF nanofibrous mesh. The composition of this PVDF layer was studied by comparing the weight of 40 cm long conductive core filament, E yarn and EF yarn, respectively, and the weight ratio of PVDF film to electrospun nanofibers was found to be 1.86:1. During coating, PVDF solution was able to penetrate through the nanofibrous layer and filled the voids, resulting in better interfacial properties with inner electrode, as shown in figures 4(e), (h). The porous structure in PVDF film was induced by phase inversion process during the solidification of PVDF film in the water bath. The porous structure is favorable for PNG since it could increase compressibility which aids to the energy output. Only limited damage to PVDF nanofibers caused by dissolution in DMF during coating was observed, because of short contact time (∼3 s) at room temperature between PVDF nanofibers and solvent. A cross-sectional SEM image of EF yarn with higher magnification can be found at figure S3 under supporting information, where electrospun nanofibers were present.
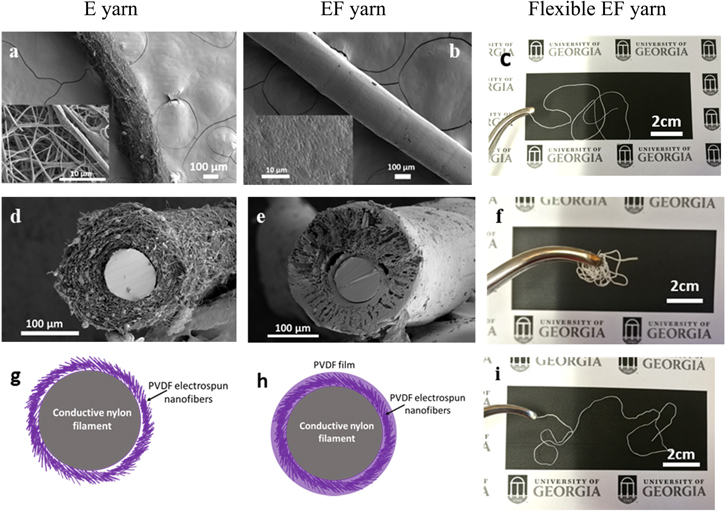
Figure 4. SEM images: (a) longitude, (d) cross section of E yarn PNG; (b) longitude and (e) cross section of EF yarn PNG. Cross-sectional schematic structure of (g) E yarn and (h) EF yarn PNG. Photographic images of EF yarn PNG (c) before, (f) during and (i) after folding and twisting.
Download figure:
Standard image High-resolution imageIn order to investigate the role of PVDF nanofibrous layer, PVDF solution was coated directly on the conductive core yarn for comparison. As depicted in figure S2 under supporting information, coating problems like uncovered inner electrode and non-centric core electrode were observed. This implied that PVDF nanofibrous layer could assist the formation of a stable coating layer. A similar phenomenon was observed by Wang et al in which PVDF films were unstable when coating directly on the metal-based electrodes [14]. High flexibility is prerequisite for wearable nanogenerators where large deflections are involved. The flexibility of EF yarn was demonstrated by folding and twisting, and no damage was observed as displayed in figures 4(c), (f), (i).
Apart from the improved interfacial property between inner electrode and PVDF layer after coating of PVDF film on E yarn, abrasion resistance was enhanced greatly. A self-developed method was used to examine the abrasion resistance by pulling PNG yarn (without deposition of external electrode) against paper tissue to a distance of 3 cm back and forth with a cuboid item (45 g, length × width × height: 4.5 × 2.5 × 1.5 cm) on top, as illustrated in figure 5(a). Optical microscope was used to characterize the morphology of yarns before and after abrasion test. It can be observed from figures 5(b), (d) that PVDF nanofibrous layer in E yarn was broken and conductive core filament was exposed after 7 cycles of abrasion. While, for EF yarn (figures 5(c), (e)), even after 50 cycles of abrasion, PVDF layer still kept intact. The standard test methods for abrasion resistance of textile materials, such as ASTM D4966 (Martindale Abrasion Tester Method) and ASTM D3886 (Inflated Diaphragm Apparatus) require fabric specimens. It is, therefore, essential to do the standard testing on fabric made from piezoelectric yarns in future studies.
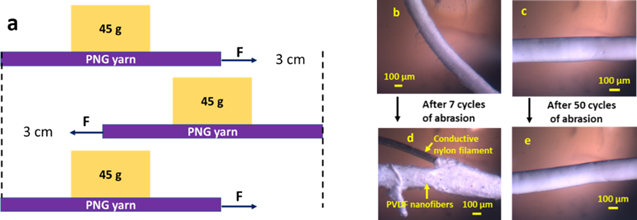
Figure 5. (a) Schematic of one cycle of abrasion resistance test against paper substrate; images of E yarn PNG: (b) before and (d) after seven cycles of abrasion test; EF yarn PNG: (c) before and (e) after 50 cycles of abrasion test.
Download figure:
Standard image High-resolution image3.2. Study of crystal structure
Fourier transform infrared analysis has been considered as an effective tool to identify crystalline phases in PVDF. The characteristic peaks of α phase were reported to be at 614 and 760 cm−1 (CF2 bending and skeletal vibration), 796 cm−1 (CH2 rocking) and 974 cm−1 (CH2 twisting) [19–22]. The peaks at 840 cm−1 (CH2 rocking and CF2 asymmetric stretching) and 1276 cm−1 (C–F stretching vibrations) were assigned to β phase [20, 22–24]. Figure 6(a) provides the FTIR spectra of PVDF samples and it can be observed that α phase dominant PVDF powder was converted into β phase based PVDF electrospun nanofibers and film after processing. Furthermore, β phase content can be quantitatively determined using equation (1) [25]:

where Aβ and Aα are the absorbance at the wavelength of 840 and 760 cm−1, respectively. Kβ and Kα are the absorption coefficient at respective wavelength and their ratio equals to 1.26 [25]. PVDF powder exhibited a β content of 31.9%, and it was enhanced to 79.5% for electrospun PVDF nanofibers. The high stretch ratio and strong electric field applied during electrospinning are responsible for the formation of β phase based crystal structure [24, 26–28]. PVDF film prepared through coagulation in 5 °C water/ice mixture exhibited a β phase content of 83.3%, much larger than PVDF film coagulated at 20 °C water with only 62.6% (figure S4, supporting information). Quenching at lower temperature reduces exchange rate between solvent and water, providing more time for PVDF to crystallize into β phase [29].
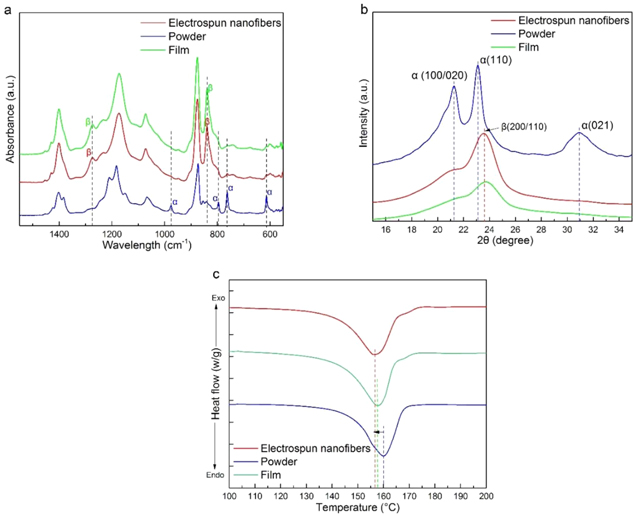
Figure 6. (a) FTIR, (b) XRD and (c) DSC spectra of PVDF film, electrospun nanofibers, and PVDF powder.
Download figure:
Standard image High-resolution imageThe crystal phases presented in PVDF samples were further examined through XRD analysis, and the patterns are shown in figure 6(b). The curve of PVDF powder exhibits three peaks at 21.3°, 23.1°, and 30.9°, associated to (100/020), (110) and (021) crystal planes of α phase [4, 30]. Upon processing into electrospun nanofibers and film, the characteristic peaks for α phase disappeared, and only one new peak around 23.6° was present, a characteristic peak of β phase corresponding to the sum of (200) and (110) diffraction planes [4, 30], and this signified the successful formation of β phase in PVDF electrospun nanofibers and film. It is to be noted that a shoulder around 21.3° was observed from the spectra of PVDF electrospun nanofibers and film, attributed to some residual α phase crystals. The results were in agreement with FT-IR that α phase based PVDF powder was converted into the β phase dominated electrospun nanofibers and film. DSC thermographs of PVDF powder, electrospun nanofibers and film are presented in figure 6(c) with corresponding endothermic peaks at 160 °C, 157 °C, and 158 °C, respectively, suggesting only one predominant phase exits in each sample. It is well accepted in literature that the melting point of β phase is lower than α phase [29, 31–35]. After PVDF powder was processed into film and electrospun nanofibers, an apparent shift to lower melting temperature was observed, which indicated the transition from α to β phase. DSC results concede with FT-IR and XRD that PVDF electrospun nanofibers and PVDF film are β phase dominated whereas PVDF powder α phase. DSC is only considered as a complementary method to identify crystalline phases of PVDF since the melting point not only depends on crystalline phase but also crystalline defects and size [19], lamellar thickness [36, 37], etc. Percentage of crystallinity (ΔXc) can be calculated using melting enthalpy of samples (ΔH) and 100% crystallized PVDF (ΔH100 = 104.6 J g−1 [22, 38]) according to the equation (2):

The crystallinity of 41.79%, 39.87%, and 39.41% were overserved for PVDF film, electrospun nanofibers and PVDF powder, respectively.
3.3. Poling mechanism
Poling is an essential step for the fabrication of PVDF with piezoelectric properties by aligning the randomly oriented domains in β phase [27]. This can be achieved using external high electric field including contact mode and corona charging [39], and by emerging self-poling methods such as adding nanofillers [40, 41], salts [42] and hydroxides [43], and coagulation of ultrathin film in water [44], which can align dipoles by forming electrostatic interactions or hydrogen bonds with CF2 or CH2 in PVDF molecules. PVDF nanofibers in E yarn was prepared by electrospinning technology where high voltage (−15 kV) was employed to stretch polymer solution supplied from nozzle into nanofibers. Due to the high electrostatic field, CF2/CH2 dipoles in PVDF nanofibers of E yarn can be aligned unidirectionally along the electric field during fabrication, requiring no additional poling process [45, 46]. EF yarn was constructed by coating of PVDF solution on E yarn followed by a coagulation process in low-temperature water. When dipping E yarn into PVDF solution, the already aligned electropositive ends (CH2) of PVDF nanofibers in E yarn can interact with the electronegative ends (CF2) of PVDF in solution, contributing to the orientation of dipoles [41] in the PVDF film layer of EF yarn, as illustrated in figure 7(a). After external electrode was deposited on EF yarn, to further increase the alignment of dipoles in the PVDF film, a maximum 1 kV electrical field was applied between the inner and external electrodes at 70 °C for 10 min, corresponding to a field strength of about 11.9 MV m−1, and after poling, an average peak voltage of EF yarn was increased from 0.44 to 0.52 V (figure 7(b)). The voltage of unpoled EF yarn mostly comes from the component of nanofibers, whose dipoles were oriented during electrospinning. To be noticed, the voltage of EF before poling is lower than that of electrospun yarn (E yarn), which is 0.47 V. Possible reason is the unpoled PVDF film on top of electrospun fibers acted as an insulation layer which lower the charge collection efficiency. The applied poling voltage is lower than the reported optimal poling electrical field ranging from 50 to 120 MV m−1 [47]. When increasing the applied voltage above 1 kV, a localized break down of PVDF occurred, and the possible reason can be attributed to the porous structure and uneven surface of PVDF film layer that resulted in lower break down voltage in some places along the yarn. Potential improvement of break down voltage can be realized by the optimization of the PVDF film layer in EF yarn. β phase content in PVDF film after poling was not investigated because only electric fields with extremely high strength (e.g. 100 MV cm−1) can have effect on the transformation of non-polar phases [48].
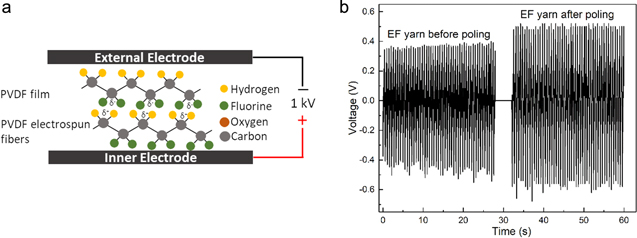
Figure 7. (a) Schematic graph of poling process occurred in the PVDF film layer in EF yarn; (b) voltage output of EF yarn before and after poling under cyclic compression of 0.02 MPa at 1.85 Hz.
Download figure:
Standard image High-resolution image3.4. Measurement of energy output
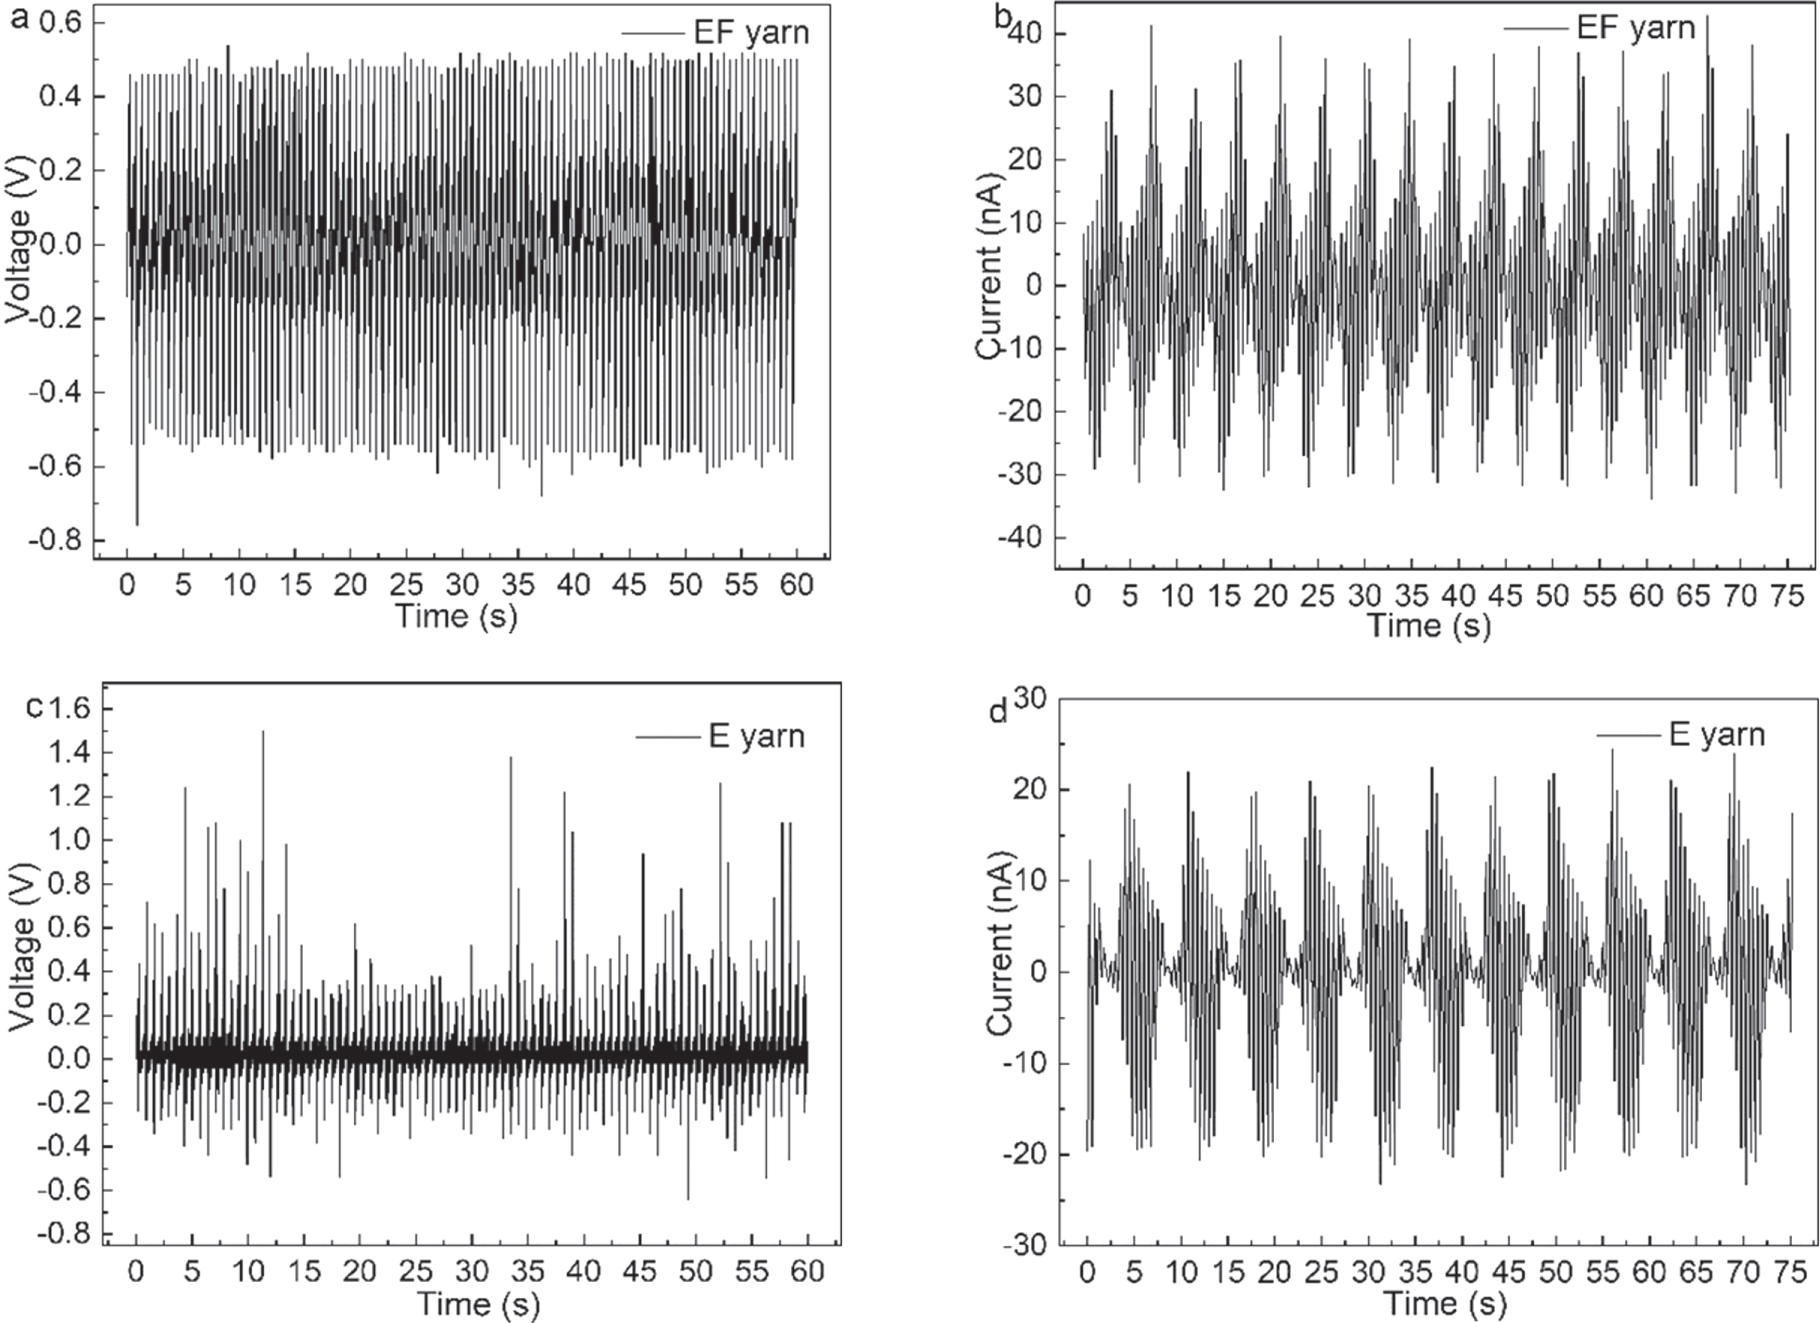
After poling, the open-circuit voltage and short-circuit current of EF yarn PNG was measured under cyclic compressive motions applied by an Instron machine (0.02 MPa 1.85 Hz, shown in video S2, supporting information). The E yarn PNG was also tested for comparison, as exhibited in figure 8. Under compression, a 3 cm EF yarn PNG reached an average peak voltage of 0.52 V and a peak current of 18.76 nA whereas E yarn PNG exhibited a peak voltage of 0.47 V and current of 10.10 nA. When the PNGs were compressed, the deformation of aligned dipoles (CH2/CF2) in PVDF resulted in a potential difference across inner and external electrodes [49], giving rise to the flow of electrons through the external circuit. Upon release, the dipoles returned to their original state, the induced potential difference vanished and the accumulated electrons on one electrode will flow in the opposite direction [50]. As a result, alternating current was generated by compressing PNG. Polarity switching test is a necessary method to verify the energy output is generated by piezoelectric yarns instead of noises from environment [51, 52]. After the reversion of electrode connections, directions of voltage responses changed for both EF yarn and E yarn (figure S5, supporting information). This demonstrates that the signals are from the yarn PNGs.
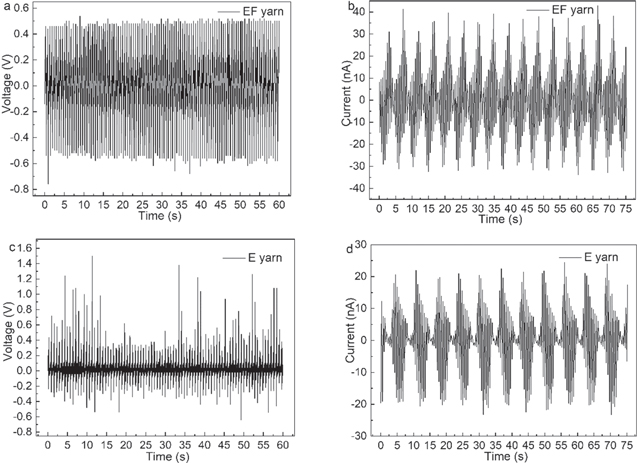
Figure 8. Voltage output of (a) EF yarn and (c) E yarn; current output of (b) EF yarn and (d) E yarn under cyclic compression of 0.02 MPa at 1.85 Hz.
Download figure:
Standard image High-resolution imagePower densities of EF and E yarn PNGs were also assessed at a resistance of 10 MΩ under the same cyclic compression and it can be calculated by using the following equation:

where V is volume of piezoelectric yarn, T is the measured time period, U(t) is voltage output and R is the applied load. EF yarn provided a power density of 5.54 μW cm−3, nearly 3 times larger than E yarn PNG (1.88 μW cm−3). Table 1 listed energy output of some reported piezoelectric yarns tested at different conditions, and it could be estimated that EF yarn PNG in this paper was able to provide a higher or comparable power output. For example, a composite yarn energy harvester with PVDF-TrFE electrospun fibers as piezoelectric layer sandwiched between a silver coated nylon yarn (inner electrode) and carbon nanotube layer (external electrode) reached a lower power density of 1.53 μW cm−3 under compression of 0.16 MPa at an impact rate of 600 mm min−1 [16]. Two reasons can attribute to EF yarn's outstanding energy output: (1) the after coated PVDF film filled the gaps of porous PVDF nanofibrous layer and inner electrode, as shown in figure 4(e). The enhanced interfacial properties and contact area can facilitate conducting of charges generated by PVDF layer [10, 53]; (2) part of vacant volumes in electrospun fibrous layer were filled with PVDF, and during compression, both PVDF nanofibers and film were subject to deformation and generated charges. This combined piezoelectric effect also contributed to improved energy output.
Table 1. Energy output of some reported piezoelectric yarns.
| Materials | Power density | Open-circuit voltage /short-circuit current |
|---|---|---|
| EF yarn PNG in our paper (silver coated filament/electrospun PVDF fibers with PVDF film/silver deposition) | 5.54 μW cm−3 (compression: 0.02 MPa, 1.85 Hz) | 0.52 V/18.76 nA, (a 3 cm yarn under compression of 0.02 MPa at 1.85 Hz) |
| Copper filament/insulating layer/PVDF-TrFE film/gold layer [13] | — | 526 mV (a 6 cm long yarn tested under acceleration of 1 g at 10 Hz) |
| Hollow polycarbonate core/a spiral multilayer cladding consisting of alternating layers of electrospun PVDF layer and carbon-filled polyethylene film [17] | — | 1.7 V/1.3 nA (a 10 cm long yarn with 20 wt% BaTiO3 added in PVDF nanofibers subjected to bending displacement of 2 cm) |
| Conductive yarns serving as electrodes woven with electrospun PVDF-TrFE yarns [2] | — | ∼16.2 mV (∼1 × 1 cm fabric contained ∼31 piezoelectric yarns compressed at ∼0.6 Hz) |
| Silver coated nylon yarn/PVDF-TrFE electrospun layer/carbon nanotube layer [16] | 1.53 μW cm−3 (compressed at 0.16 MPa with an impact speed of 600 mm min−1) | 2.6 V/15 nA (a 1 cm long fiber compressed at 0.16 MPa with an impact speed of 600 mm min−1) |
| Conductive fiber/hybridization of ZnO arrays and PVDF film/gold layer [14] | 16 μW cm−3 (normalized to the volume of piezoelectric layer, under folding-releasing of an elbow for ∼90 °) | 0.1 V/10 nA cm−2 (a 2 cm fiber under folding-releasing of an elbow for ∼90 °) |
| Carbon black filled polyethylene/PVDF melt/silver paste [10] | — | 1 V (a bundle of 24 fibers with a length of 1 cm subjected to 0.45% tensile strain at 10 Hz) |
The capability of EF yarn to scavenge energy from human body movements were studied by applying finger tapping. Figure 9 shows that EF yarn can provide an average peak voltage of 1.32 V and a current of 62.6 nA under finger tapping mode. In comparison, E yarn can generate a voltage of 1.14 V and current of 62.3 nA. It can be clearly observed from figures 9(b), (d) that the current signals exhibit lower frequency compared to voltage signals(figures 9(a), (c)), and the reason is that the sampling rate of Source Meter (Keithley 2400) is 4 Hz, far less than the Nyquist frequency (∼12Hz). Due to the device limitation, the current signals show larger period. During finger tapping, it was hard to keep the force and frequency constant, and this may cause a narrower difference in energy output compared to previous results under well controlled compressive impacts. Bending motions were also applied on EF yarn and a maximum peak voltage of 0.8 V was achieved for a 3 cm yarn (video S2, supporting information). These all demonstrate the feasibility of using EF yarn PNGs to scavenge mechanical energy from human body movements.
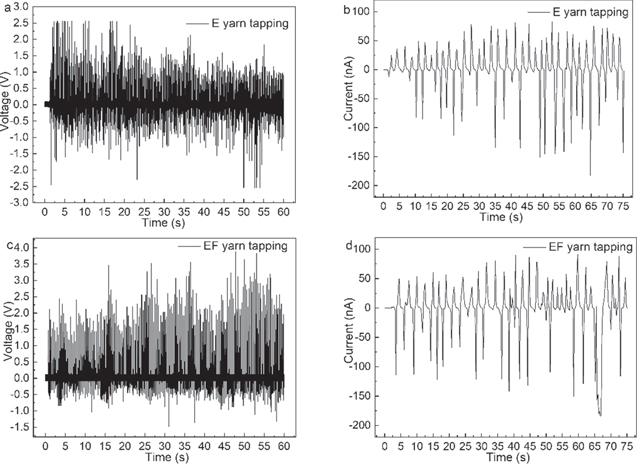
Figure 9. Voltage output of (a) E yarn and (c) EF yarn; current output of (b) E yarn and (d) EF yarn under finger tapping.
Download figure:
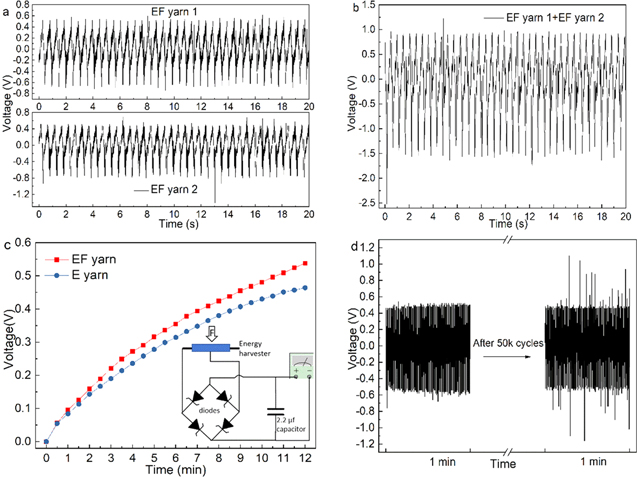
Standard image High-resolution imageWith the aim of investigating the viability of combining multiple PNGs to get higher energy output, two EF yarn PNGs were tested individually first and then connected in series, for their voltage output under the same cyclic compression. Figure 10(a) shows an average open-circuit peak voltage of 0.58 V for EF yarn 1 and 0.63 V for yarn 2. After connecting the two yarns in series, the energy output was found to be 1.24 V (figure 10(b)), approximately the sum of voltage output from EF yarns 1 and 2, suggesting that substantial energy output can be generated when thousands of piezoelectric yarns are incorporated into the fabric.
Figure 10. (a) Open-circuit voltage outputs of two 3 cm EF yarn PNGs, labeled as EF yarn 1 and EF yarn 2. (b) Open-circuit voltage output of the two EF yarn PNGS serially connected. (c) Accumulated voltage of a 2.2 μF capacitor charged by a 3 cm EF and E yarn PNG, respectively. (d) Durability test of EF yarn PNG. All tests were conducted under 0.02 MPa at 1.85 Hz.
Download figure:
Standard image High-resolution image
The energy storage capacity of yarn PNGs was investigated by charging a 2.2 μF capacitor through a silicon diode based full-wave bridge rectifier circuit by compressing a single 3 cm yarn device under 0.02 MPa at 1.85 Hz. The voltage of the capacitors was measured every 30 s, and the results are presented in figure 10(c). After 12 min, the capacitors were charged to 0.54 V and 0.46 V by EF yarn and E yarn, respectively, and this further indicates the superior energy output of EF yarn over E yarn. In addition, a 2.2 μF capacitor was successfully charged to 2.30 V by compressing three serially connected 3 cm EF yarn PNGs for 10 min (0.02 MPa at 1.85 Hz), and the charged capacitor was able to turn on two red LEDs (video S2, supporting information), which demonstrates its capability to power electronics. In order to examine the durability and stability of EF yarn PNG, the same continuous compression motions were applied for 50 000 cycles, and it is evident in figure 10(d) that EF yarn PNG exhibited consistent voltage output. The high durability could result from the good flexibility of EF yarn.
There are some limitations in our research to be addressed in the future. External electrode prepared by electron beam evaporation is fragile, and a more durable external electrode should be developed. Lin et al [24] conducted a detailed study on the influence of thickness of PVDF electrospun mats on energy output and found the existing of optimal thickness. However, the influence of thickness has never been studied on yarn level, which will be investigated in our future research. We also plan to explore the potential of adding nanostructured piezoelectric ceramics inside PVDF layer to future enhance energy output. In addition, it is necessary to develop a PVDF film coated conductive nylon yarn, and compare its energy output with EF yarn, to validate the importance of electrospun nanofibers in EF yarn. Methods to solve the coating problems such as poor adhesion between PVDF solution and silver plated nylon filament during the coating of PVDF film would be investigated in the future researches. Study on the power efficiency of different AC–DC rectifier circuits, such as full-wave Schottky diodes rectifier, germanium diodes rectifier, as well as active/passive full-wave MOSFET rectifiers, is critically important to fully utilize the energy output from nanogenerators and would also be addressed in future researches.
4. Conclusions
In this work, we prepared a flexible EF yarn PNG by integrating a nanofibrous PVDF layer with PVDF film around a silver coated yarn electrode. EF yarn PNG exhibited an enhanced energy output compared with E yarn that only possessed a PVDF nanofibrous layer. A 3 cm EF yarn PNG could provide an average peak voltage of 0.52 V, current of 18.76 nA, and power density of 5.54 μW cm−3 under a cyclic compression of 0.02 MPa at 1.85 Hz, and most importantly, these performances could be retained after 50 000 cycles. The observed enhanced performance for EF yarn can be attributed to the improved interfacial properties between yarn electrode and PVDF layer, as well as combined piezoelectric output of PVDF electrospun nanofibers and film. These indicated that the durable high-performance flexible yarn-based device has great potential to be used as wearable nanogenerator that could scavenge human body kinetic energy and convert it into electricity.
Acknowledgments
This research was financially supported by AATCC Research Grant and IIRG UGA. We thank Darya Asheghali for the help with core-sheath yarn fabrication, and Dr Yunsang Kim for his helpful advice on the characterization of piezoelectric performance. The help of Li Chen in the FT-IR testing, and Hoang Mai Luong in the measurement of current are greatly appreciated. We would also like to thank Eliza Lee's consistent help during the research.
Conflicts of interest
The authors declare no competing financial interest.