

Abstract
A method for the measurement of plasma potential waveforms is presented that is based on measurement with a high-impedance probe and an electric model of the sheath around the probe. The method was verified and compared with methods that were previously used for measurement of the temporal development of plasma potential during an RF period of capacitive discharges. The sensitivity of the method to the values of required input parameters (mean plasma potential value, electron concentration and temperature) was analyzed and it was found that with a lower precision, the method can be used even without the knowledge of these input parameters. Finally, plasma potential waveforms were measured in a low-pressure capacitively coupled discharge. In agreement with theoretical models, the generation of higher harmonic frequencies of plasma potential and their sensitivity to electron concentration were observed.
Export citation and abstract BibTeX RIS
1. Introduction
Plasma potential is one of the fundamental plasma parameters. Its mean (DC) value is in low-pressure discharges usually measured by Langmuir probes. However, alternating or pulsed voltage with a frequency from the kHz–GHz range is used for the excitation of most electric discharges, which lead to substantial variations of plasma potential during each discharge period. Passive [1] or active [2] compensation of a Langmuir probe is therefore used, which prevents the V–A probe characteristics from distortion caused by alternating currents flowing to the probe. However, the compensation makes the measurement of alternating signals by a compensated probe difficult. Moreover, even when the probe is not compensated, the measurement is complicated by the fact that the alternating components of probe potential can differ significantly from the alternating components of plasma potential, as will be shown below. As a result, while the DC value of the plasma potential is routinely measured by compensated Langmuir probes, there is a lack of data describing the temporal evolution of plasma potential during a discharge period, in spite of the fact that it is a fundamental electric characteristic of plasma. This fact is valid, especially in capacitively coupled discharges where the plasma potential comprises not only the DC and the one RF component supplied from the RF power generator, but it also includes numerous higher harmonic frequencies created by plasma due to the nonlinear nature of sheaths [3–5].
The complete waveforms of plasma potential can be measured by uncompensated probes that do not suppress the RF signals. However, the analysis of measured data is not straightforward since the probe is separated from the ambient plasma by a sheath. Consequently, the unknown sheath potential must be added to the probe potential in order to obtain the desired plasma potential. Two different approaches were used for the solution of this task. The first is based on the construction of a probe with impedance as high as possible in order to minimize RF current flowing through the sheath around the probe and, consequently, to minimize the RF components of the sheath voltage [6, 7]. The second approach is based on the calculation of the originally unknown sheath voltage [8]. The presented work deals with a combination of these two approaches in order to improve the method of measurement of the complete plasma potential waveforms. A high-impedance uncompensated probe with small dimensions was constructed and the measured data were analyzed by means of a nonlinear model of the sheath around the probe, which enabled us to measure accurate waveforms of plasma potential with a high spatial resolution. The resulting method is further tested and analyzed in a capacitively coupled RF discharge.
2. Experimental
The high-impedance probe with no RF compensation was made of a steel wire with a diameter of 0.27 mm. The 2 cm long tip of this wire was exposed to the plasma, and the rest of the wire was separated from the plasma by two concentric glass tubes (see figure 1). The outer diameter of the inner glass capillary that extended to the probe tip was 1.5 mm. The wire was connected to the oscilloscope (LeCroy WaveRunner 6100A) by a high-voltage oscilloscope probe with input resistance 108 Ω and input capacity 3 pF. The measured total capacity of this uncompensated probe to ground (including the input capacity of the oscilloscope probe) was 3.9 pF.

Figure 1. Construction of the high-impedance (left) and the low-impedance (right) probes with no RF compensation.
Download figure:
Standard image High-resolution imageIn order to compare the high-impedance probe with a probe similar to that described in [8], a low-impedance probe with no RF compensation was used simultaneously with the described high-impedance probe. This low-impedance probe was simply made of a 2 cm long bare copper tip of a 50 Ω coaxial cable that was connected directly to an oscilloscope with an input impedance of 50 Ω (see figure 1). The probe tip diameter was 0.17 mm.
For the measurements of the mean values of the plasma potential, electron concentration and electron temperature, a Langmuir probe with RF compensation (ESPion, Hiden Analytical) was used. The whole experiment was performed in a low-pressure (0.2–30 Pa) capacitively coupled discharge ignited by RF (13.56 MHz) voltage in various gases (Ar, N2, O2, H2) inside a spherical (i.d. 33 cm) grounded stainless steel reactor with two parallel stainless steel ring electrodes. The diameter of each electrode was 80 mm, and their distance was 40 mm.
3. Sheath model
Since bulk plasma is separated from the probe by a sheath, the plasma potential must be calculated as

where  is the plasma potential,
  is the measured probe voltage and U is the sheath voltage. To calculate the sheath voltage, the model based on the assumptions of constant ion density and stepwise electron density with negligible electron concentration inside the sheath was used. The model is described in [8].
The sheath voltage was expressed by means of the sheath radius (s)

where e is the elementary charge, n is the electron concentration in the bulk plasma,  is the vacuum permitivity and rp is the probe radius. The derivative of the sheath radius was calculated from the displacement current flowing to the probe (Id)

where S is the surface area of the probe. The displacement current was obtained by subtraction of the electron (Ie) and ion (Ii) current from the total current (I) flowing to the probe


where k denotes the Boltzmann constant, Te is the electron temperature and me is the electron mass. The ion current was assumed to be constant during the whole discharge period, since the ion plasma frequency was significantly smaller than the frequency of the applied electric field. Although some variations of ion density in front of the powered electrode were simulated in a low-frequency (1.9 MHz) discharge ignited in a light gas (He) [9], in conventional CCP discharge, the assumption of constant ion flow is usually valid [10]. Equations (2) and (3) can be used in the form

where lp is the probe length. The electric schema of the whole system is sketched in figure 2(a).

Figure 2. Electric scheme of the uncompensated probe circuit. (a) The system solved in the presented work. (b) An approximation of the sheath around the probe by a capacitor, which is tested in section 6.1.
Download figure:
Standard image High-resolution imageThe system of equations (1)–(5) was solved numerically and the unknown value of the ion current (Ii) and the initial value of the sheath voltage (U(0)) were fitted so that the calculated plasma potential was periodic and the mean value of the calculated plasma potential agreed with the mean value measured by the RF compensated Langmuir probe.
One example of the measured high-impedance uncompensated probe voltage waveform and the calculated plasma potential waveform is shown in figure 3, which demonstrates a significant difference between the probe and the plasma potential waveforms. Consequently, it is necessary to model the voltage of the sheath around the probe when the plasma potential waveform is measured. Figure 3 further depicts a waveform measured by the low-impedance uncompensated probe. Comparison of the high- and low-impedance probe method will be discussed in section 6.2.

Figure 3. Waveforms of plasma (black), high-impedance probe (red) and low-impedance probe (blue) potentials measured in a capacitively coupled discharge in argon at 6 Pa. The low-impedance probe potential was  increased.
Download figure:
Standard image High-resolution image4. Test of the method
In order to test the method, the probe was artificially biased to various DC potentials from −40 V to +10 V and plasma potential waveforms were measured at various DC probe potentials. The DC biasing was realized via a series of coils in order to eliminate any significant distortion of RF signals caused by the DC biasing. Since plasma potential should not be affected by the probe bias, the obtained plasma potential waveforms should not differ. Nevertheless, the change of the DC bias from 10 V to −40 V led to a change of the sheath voltage (U) by ca 300%. Therefore, the sheath model (1)–(5) is used in several significantly different conditions, including a situation with negative DC bias where the model has a very strong effect on the shape of the obtained plasma potential waveform. As a result, an inaccuracy of the model should lead to a discrepancy between the obtained plasma potential waveforms and, therefore, the comparison of waveforms obtained from measurements with various probe DC bias can be used as a test of the reliability of the method.
Figures 4 and 5 show examples of the described test realized in a capacitively coupled discharge ignited in argon at pressure 6 Pa and 16.5 Pa, respectively. Although the sheath voltage was changed by hundreds of percent during the test, the resulting plasma potential waveforms differ at most by several percent, which indicates a satisfactory reliability of the presented method.

Figure 4. Comparison of plasma potential waveforms calculated from probe measurements realized at various values of the probe DC voltage. Measured in argon at 6 Pa.
Download figure:
Standard image High-resolution image
Figure 5. Comparison of plasma potential waveforms calculated from probe measurements realized at various values of the probe DC voltage. Measured in argon at 16.5 Pa.
Download figure:
Standard image High-resolution imageThe behaviour of the probe was also tested for probe DC potential values that were higher than 10 V. At high positive bias values the sheath around the probe was collapsing (i.e.  ) for a non-negligible part of the discharge period. This is a situation that cannot be described reliably by the model (1)–(5) and a more accurate model should be used in such cases.
A second short test of the method was realized by the addition of a 4 pF capacitor between the probe and the ground. Plasma potential waveforms acquired by means of the probe with an increased load again did not differ significantly from waveforms acquired by a non-loaded probe.
5. Sensitivity to input parameters
Since the presented method of plasma potential waveform measurement requires knowledge of electron concentration, electron temperature and the mean (DC) value of the plasma potential, the sensitivity of the method to these three parameters was examined. The dominant component of the current flowing to the probe is the displacement current. When the probe is negatively biased, the electron current can be neglected and equation (6) in the form

can be used instead of equations (3)–(5). Since equation (7) does not depend on electron temperature, the proposed method is independent of the value of electron temperature at sufficiently low probe biasing.
When the probe is floating (it is not biased), the electron current is not negligible and both the values of electron concentration and temperature are required as input parameters. For a floating probe, the sensitivity of the method to the values of these input parameters is demonstrated in figures 6 and 7. These figures display five different plasma potential waveforms that were calculated from the same measurement realized by a floating probe in an argon discharge at the pressure of 6 Pa. The displayed waveforms differ in the value of electron concentration or temperature that was used during the evaluation of the measurement. These figures demonstrate that even when the input parameter (electron concentration or electron temperature) was twice overvalued or undervalued, the obtained plasma potential waveforms were distorted by less than 10% of the peak-to-peak value of the obtained waveform.

Figure 6. Comparison of plasma potential waveforms calculated for correct (black line), doubled (red) and half (blue) value of electron concentration. Calculated from voltage waveforms measured by a floating probe.
Download figure:
Standard image High-resolution image
Figure 7. Comparison of plasma potential waveforms calculated for correct (black line), doubled (red) and half (blue) value of electron temperature. Calculated from voltage waveforms measured by a floating probe.
Download figure:
Standard image High-resolution imageThanks to the fact that the dominant current component is the displacement current and the presented method is not very sensitive to the values of electron concentration and temperature, the method is relatively robust; it will not be affected strongly by eventual effects like a decrease of electron concentration due to the presence of the probe and probe holder, collisions of charged particles in the sheath around the probe, reflection or emission of electrons from the probe surface or temporal variations of the ion current.
Since the electron current flowing to the probe is usually much weaker than the displacement current, even when the probe is floating, it is probably not possible to use the uncompensated probe for precise measurement of electron concentration and temperature unless the probe is biased to higher values of DC voltage. The evaluation of measurement with higher probe bias would require a more accurate model of the sheath around the probe that would reliably describe even the situation when the probe potential is higher than the plasma potential.
The final required input parameter is the mean value of the plasma potential. Of course, the mean value of the resulting plasma potential waveform follows the value of this input parameter. Nevertheless, the resulting RF components of the plasma potential are relatively insensitive to changes of this input parameter as long as the calculated sheath around the probe is far from the collapse. In our measurements, the peak-to-peak range of the resulting plasma potential waveform was changed only by a few percent when the value of the plasma potential was doubled.
Since ion current to a floating probe must be compensated by electron current, the mean potential of the floating probe usually sets itself to such a value that ensures that the sheath around the probe is close to its collapse at one moment of the discharge period. This supposition can be used for an estimation of the mean value of plasma potential, even without knowledge of electron temperature. In order to test this hypothesis, the following experiment was realized. Waveforms of probe voltage were measured when the probe was floating and when it was biased to −40 V. The measurements realized at the negative bias were evaluated since an evaluation of these measurements does not require knowledge of electron temperature. The value of the mean plasma potential was explored so that the resulting plasma potential waveform touches the floating probe potential waveform in one moment of the period. A comparison of the obtained mean values of plasma potential and values measured by means of a Langmuir probe are shown in table 1. This comparison shows reasonable agreement and demonstrates that the uncompensated probe can be used for the measurement of the mean plasma potential value. A more accurate method for the determination of mean plasma potential by an uncompensated probe will probably require a deeper analysis of measurements realized with various biasing of the uncompensated probe and a more accurate model of the sheath around the probe. Since the sheath model is not very sensitive to the value of electron concentration, the described method can be used for a rough estimation of the plasma potential waveform with only a rough guess of electron concentration, i.e. even without precise knowledge of any of the three input parameters.
Table 1. Comparison of the mean plasma potential values estimated by means of the uncompensated probe and measured by the Langmuir probe. Measured in a capacitively coupled discharge in argon.
| Pressure [Pa] | Estimation of  [V] [V] |
Measurement of  [V] [V] |
|---|---|---|
| 16.5 | 25.25 | 25.58 |
| 6 | 22.47 | 22.53 |
| 3.3 | 24.62 | 20.52 |
6. Comparison with previous methods
In order to compare the described method with previous methods, a series of experiments was performed in a capacitively coupled discharge in various gases (Ar, N2, O2, H2) in the pressure range 2–20 Pa. Measurements by both the high- and low-impedance probe were realized simultaneously and voltage waveforms of both these probes were evaluated by various models of the sheath around the probe. The following two subsections discuss the comparison of the results. Since the combination of the high-impedance probe with the model (1)–(5) described in this work is believed to be the most reliable from all the compared methods, the reliability of the previous methods is discussed by comparison of their results with the result of the method presented in this work.
6.1. Comparison with capacitive sheath model
The described method was compared with the previous method shown in [6, 7], where the sheath around the probe was modeled as a capacitor. In this method, the electric circuit drawn in figure 2(b) is solved and each frequency component of the plasma potential ( ) is calculated according to

where  is the probe voltage measured by the oscilloscope,
  and
and  are the capacity and resistance of the probe to the ground, respectively, and C is the capacity of the sheath around the probe. In our test, the sheath capacity was calculated as a capacity of a cylindrical capacitor

where the value of the sheath radius s was chosen so that its corresponding sheath voltage value calculated by equation (2) was equal to the true mean value of the sheath voltage  . The mean value of the plasma potential
  was measured by a Langmuir probe.
The plasma potential waveforms obtained by this simplified method were compared with the plasma potential waveforms acquired by the presented method based on the model (1)–(5). The results of the comparison varied from an excellent agreement to a significant difference. Examples of a relatively good agreement and a poor agreement are shown in figures 8 and 9, respectively.

Figure 8. Comparison of plasma potential waveforms calculated by the presented model (black) and by the capacitive sheath model (red). Measured in argon at 6 Pa.
Download figure:
Standard image High-resolution imageWe conducted further tests in order to replace the used value of the sheath capacity (9) by a value that was determined in a different way used in [6]. The probe was loaded by various additional capacitors (i.e. the value of  was increased). For each capacitor added, a probe voltage waveform was measured and such a value of the sheath capacity was found that minimized differences between the resulting plasma potential waveforms. However, this attempt did not lead to any better agreement with the plasma potential waveforms determined by equations (1)–(5). Finally, a third value of the sheath capacity was tested. In this case, the sheath capacity value was set so that it minimized the resulting difference between the plasma potential waveforms obtained by the capacitive sheath approximation (8) and by the model (1)–(5). An example of the resulting plasma potential waveform is shown by the green line in figure 9.

Figure 9. Comparison of plasma potential waveforms calculated by the presented model (black), by the capacitive sheath model (red) and by the capacitive sheath model with optimized capacity value (green). Measured in nitrogen at 17 Pa.
Download figure:
Standard image High-resolution imageThe described test indicates that the electric behaviour of the sheath around a high-impedance uncompensated probe is, in most cases, close to the behaviour of a capacitor. However, evident violations of this approximation exist, as demonstrated by the difference between the black and the green line in figure 9. Moreover, it can be problematic to determine the correct value of the sheath capacity, as demonstrated, for example, by the red line in figure 9 that differs significantly from both the green and the black line.
6.2. Comparison with low-impedance probe
Another previous method was based on the model (1)–(5), but a low-impedance uncompensated probe was used instead of the high-impedance probe [8]. In order to test this previous method, measurements with the low-impedance probe were realized simultaneously with the high-impedance probe measurements, and plasma potential waveforms obtained by these two measurements were compared. This comparison was again realized in Ar, N2, O2 and H2 in the pressure range 2–20 Pa.
The results of the test varied between a reasonable agreement to a serious disagreement. An example of a reasonable agreement is shown in figure 10. This figure manifests the general observation that the low-impedance probe suppresses the higher harmonic frequencies of the plasma potential. Although there was a relatively good agreement between the plasma potential waveforms measured by the high- and the low-impedance probe in a number of experiments, there were experiments with a strong disagreement where the plasma potential amplitude measured by the low-impedance probe was almost twice as high as the amplitude measured by the more reliable high-impedance probe.

Figure 10. Comparison of plasma potential measured by a high- and low-impedance probe in argon at 6 Pa.
Download figure:
Standard image High-resolution image7. Examples of measured waveforms
The waveforms of plasma potential that were measured by the presented method agreed well with the theoretical models presented in [4, 5, 11, 12]. The plasma potential of the capacitive discharge contained a number of higher harmonic frequencies. Two effects responsible for the generation of higher harmonics are visible in examples of plasma potential waveforms shown in figures 11 and 12 and in figures 4 and 5, as previously shown. Firstly, electric oscillations at the frequency of the series plasma–sheath resonance [13, 14] were ignited, especially at the moment of expansion of the sheath at the powered electrode. Secondly, the base plasma potential waveforms revealed slowly developing minima and sharpened asymmetric maxima as a result of the nonlinear nature of the V–A characteristics of the sheaths. Figure 11 demonstrates that the self-excited high-frequency oscillations were intensive, especially at low pressure when its damping by electron–neutral collisions was weak. Further, these oscillations were stronger in discharges with a higher concentration of electrons. This observation is demonstrated in figure 12, which compares plasma potential waveforms measured in a nitrogen discharge with electron concentration  m−3 and in an electronegative oxygen discharge with electron concentration
  m−3. A specific higher harmonic frequency was further amplified when its frequency was close to the frequency of the series plasma–sheath resonance, which also depends on the electron concentration. The fact that the amplitude of higher harmonic frequencies depends on electron concentration is important for an explanation of some monitoring techniques that are used in deposition or etching processes. Higher harmonics are used for end-point detection of etching processes [15–17] and for detection of mode transition in reactive magnetron sputtering [17, 18]. Both these monitoring techniques rely on the sensitive reaction of higher harmonic frequencies on electron concentration, whether its behaviour is controlled by surface processes or volume ionization [17, 19].
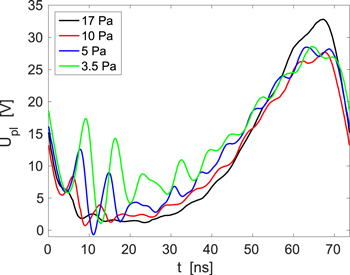
Figure 11. Plasma potential waveforms measured in a nitrogen capacitively coupled discharge at various pressures.
Download figure:
Standard image High-resolution image
Figure 12. Plasma potential waveforms measured in oxygen and nitrogen capacitively coupled discharge at 7 Pa.
Download figure:
Standard image High-resolution imageFigure 13 shows the relation of voltage on the sheath around the high-impedance probe and current flowing through the sheath to the probe. Besides the total probe current, the electron current component is shown in the figure in order to demonstrate that the displacement current is usually the dominant component of electric current flowing to the probe. The ion current is not shown in the figure since it has a constant value that is much lower than the magnitude of the total current. The oscillation of plasma current that was self-excited during the sheath expansion at the powered electrode is the dominant feature of figure 13—these oscillations are responsible for the formation of the spiral part of the curve in the left part of the figure. The oscillation damping caused by the collisions of electrons leads to a decrease of the spiral radius and to the oscillation vanishing after a few rounds of the spiral. Second, a much weaker excitation of plasma oscillations is than visible during the expansion of the sheath at the grounded electrode, i.e. during the increase of the sheath voltage U in figure 13.

Figure 13. Dependence of the total probe current (black) on the sheath voltage for the high-impedance probe biased to 10 V in a capacitively coupled discharge ignited in argon at 6 Pa. The blue curve shows the electron component of the probe current.
Download figure:
Standard image High-resolution image
8. Conclusion
Measurement by a high-impedance probe (with no RF compensation) was evaluated by means of a simple model of the sheath around the probe in order to acquire reliable waveforms of the plasma potential. In particular, the temporal development of plasma potential during an RF period of a low-pressure capacitively coupled discharge was measured in this work. This method of plasma potential measurement was tested by means of DC probe biasing, which ensured significant changes of the thickness of the sheath around the probe. Despite the strong variation of the sheath thickness, the resulting plasma potential waveforms were practically identical within several percent of their peak-to-peak voltage, which indicates a good reliability of the presented method. The reliability of the presented method is restricted to measurements when the probe is not biased to high positive voltage values, since the model used is not suitable for situations when the probe potential is higher than the instantaneous plasma potential. For this reason, a generalized sheath model will probably be required when such a probe with no RF compensation will be used for the measurement of electron concentration and temperature. Besides the  requirement (i.e. the sheath around the probe should not collapse), the described method assumes that the ion current is constant, i.e. that the frequency of the supplied discharge voltage is higher than the ion plasma frequency. Further, equation (5) was derived for low pressure when the mean free path of electrons is higher than the sheath radius. If these conditions are not fulfilled and the electron/ion current is not negligible, equations (4) and (5) should be generalized. Fortunately, the ion and electron current usually create only a small part of the probe current and, therefore, the presented method is not very sensitive to the validity of the last two conditions.
The basic version of the measurement requires knowledge of the mean (DC) value of the plasma potential, electron concentration and electron temperature. However, it was observed that the method is not very sensitive to the values of electron temperature and concentration, and that the uncompensated probe enables an estimation of the mean value of plasma potential. Consequently, for approximate measurements of plasma potential waveforms, the presented method can be used even without knowledge of any of these three input parameters.
The presented method was compared with previous methods of plasma potential waveform measurements that differ from the presented method either by an approximation of the sheath around the probe by a capacitor or by use of a low-impedance probe. The basic shape of plasma potential waveforms measured by means of the previous methods was usually similar to waveforms measured by the presented method. On the other hand, in some experiments a significant disagreement was found and, therefore, the presented method is recommended for measurements of plasma potential waveforms instead of previous methods.
Finally, the described method was used for plasma potential waveform measurements in a low-pressure capacitively coupled discharge. In agreement with theoretical models, the plasma potential contains a number of higher harmonic frequencies that reached high amplitudes, especially at low pressure, at high electron concentration and when their frequency was close to the frequency of the plasma–sheath resonance.
Acknowledgments
This research was supported by the project LO1411 (NPU I) funded by the Ministry of Education Youth and Sports of the Czech Republic.