
Abstract
A new diagnostic platform for more accurate diagnosis of the peak radiation temperature on ablator has been proposed. A nearly constant radiation temperature was obtained by two laser entrance holes spherical hohlraum. The peak radiation temperature on ablator was determined by the shock wave technique. A high-quality burn-through image of a two-step-shaped Au ablator was obtained in the experiment. The simulated mass ablation rate agrees well with the experimental result, while the peak radiation temperature measured by flat-response x-ray detectors outside the hohlraum was of ∼20 eV's lower than that obtained by the shock wave technique. This deviation results in ∼20%'s decrease in the mass ablation rate in the simulation. Thus, the new diagnostic platform can provide more accurate peak radiation temperature diagnosis. This can greatly support the inertial confinement fusion ignition target design.
Export citation and abstract BibTeX RIS

Original content from this work may be used under the terms of the Creative Commons Attribution 4.0 license. Any further distribution of this work must maintain attribution to the author(s) and the title of the work, journal citation and DOI.
1. Introduction
In indirect-drive inertial confinement fusion (ICF) [1], design of the ablator layer is crucial [2, 3]. Plenty of studies have been developed to study the mass ablation rate [4], ablation pressure [5], ablator thickness [6] and fraction of dopant [7] to optimize the ablator layer. Among them, the mass ablation rate strongly influences the remaining mass. Unexpected deviation of mass ablation rate is detrimental for target design, thus accurate knowledge of mass ablation rate is crucial for ICF ignition target design.
The mass ablation rate is strongly dependent on the radiation temperature. It is very important to get accurate radiation temperature information. In Olson's previous work, the mass ablation rates of beryllium (Be), copper-doped beryllium (Cu-doped Be), germanium-doped plastic (Ge-doped CH), and diamond-like high-density carbon were discussed in detail [8]. The radiation temperature was measured by the Landen et al [9] soft x-ray spectrometer (SXS). However, it is affected by the field of view, observation direction and plasma condition [10, 11]. It deviates from the 'real' radiation source inside hohlraum and cannot accurately reflect the 'real' x-ray flux on samples. It increases the uncertainty of the radiation temperature during the burn through interval. The design and measurement of radiation temperature should be improved. And nearly constant radiation temperature [12] has been designed to study radiation transport [13, 14], and radiation hydrodynamics [15, 16].
In recent years, the shock wave technique [17, 18], has been developed to obtain the peak radiation temperature inside hohlraum [19], which is determined by the scaling law between the radiation temperature and the shock velocity. Here, the temporal behavior of the radiation temperature is detected by the x-ray detector (XRD) measurement result. The peak radiation temperature inside hohlraum is usually different with that measured by the SXS or XRD [20]. The difference would affect experiment and simulation analysis significantly. However the shock wave technique has never been used to diagnose the radiation temperature on the ablator in the radiation ablation research before.
In this paper, we present a novel diagnostic platform for more accurate diagnosis of the peak radiation temperature on the ablator. The hohlraum was two laser entrance holes (LEHs) spherical hohlraum to generate a clean radiation environment. A nearly constant radiation temperature was obtained to lower the uncertainty of the radiation temperature. Temporal behavior of the radiation temperature and the M-band fraction were measured by the flat-response x-ray detector (F-XRD) and the M-band x-ray diode (M-XRD) outside hohlraum. And the peak radiation temperature on ablator was determined by the shock wave technique. In the experiment, one successful shot was performed and we obtained a high quality burn-through image of a two-step-shaped Au ablator.
2. Experimental arrangement
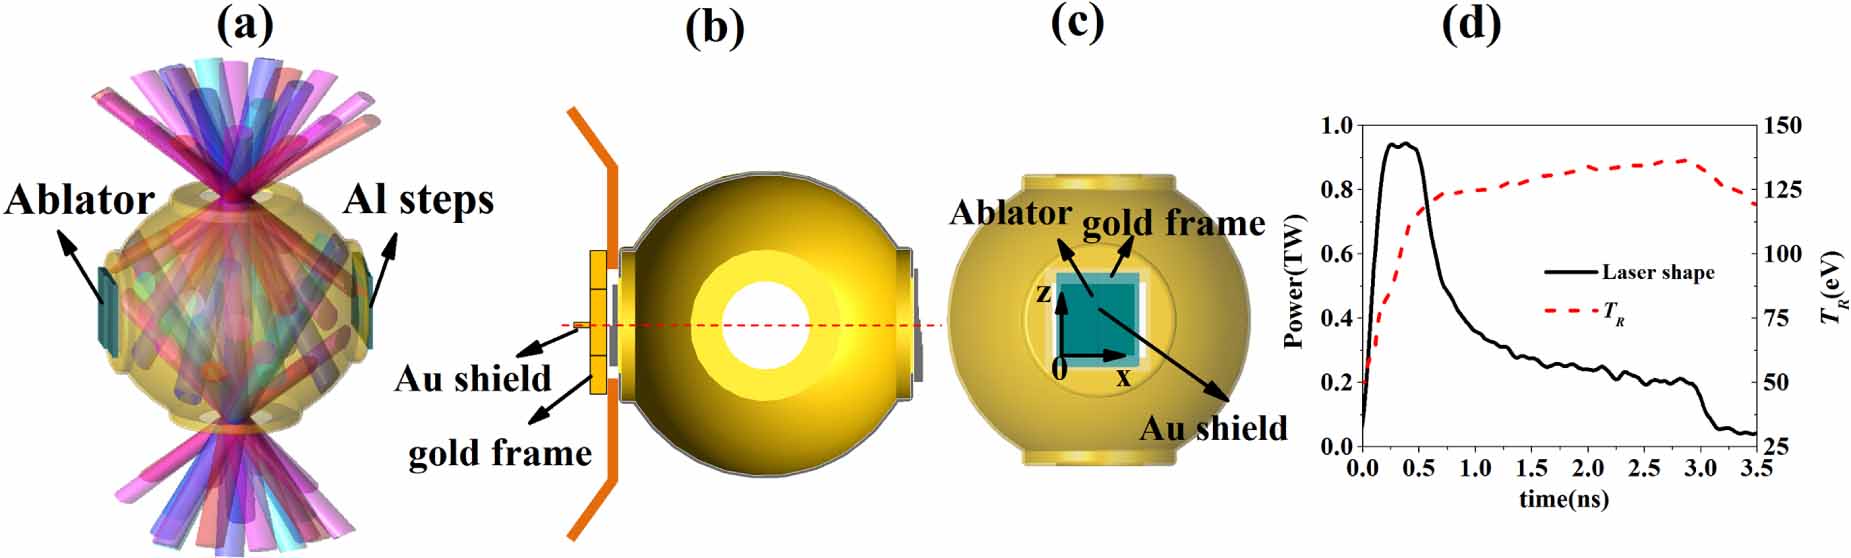
The experiment was performed at the 100 kJ level laser facility [21]. The experimental arrangement is shown in figure 1(a). Thirty-six laser beams with ∼1.15 kJ per beam at 0.35 μm were focused into the spherical hohlraum [22, 23], from the upper and lower LEH. The diameter of the hohlraum was 4.8 mm. There were two cylindrical LEHs at the poles. The diameters of the LEHs were 1.2 mm. The hohlraum was filled with 0.4 atm of C5H12. Two diagnostic holes at the equator were 1.5 mm × 1.2 mm. The ablator was too thin to keep the gas pressure. It was carefully arranged, as shown in figures 1(b) and (c). The sample was 1.3 mm × 1.5 mm. And a gold frame was supported outside the sample to prevent the x-ray in hohlraum entering the diagnostic device directly. The internal size of the gold frame was 1.1 mm × 1.2 mm. The ablator was placed in the left-right direction. In order to better distinguish the burn-through image of the two steps, the step intersection was covered with a gold shield, as shown in figures 1(b) and (c). Continuous-phase plates were used for beam smoothing. The laser beams were arranged with four cone-angles with respect to the hohlraum axis: 8 beams at 28.5°, 6 beams at 35°, 12 beams at 49.5°, and 10 beams at 55°. The 36 input beams provided an ∼3 ns input pulse. An example of the measured laser shape and radiation temperature is shown in figure 1(d). The well designed 3 ns shaped laser pulse was used to provide a nearly constant radiation temperature. At 0–0.5 ns, it was square to make the hohlraum reach a rather high temperature. At 0.5–3 ns, it was well shaped to keep the radiation temperature nearly constant. The backscattered laser energy is measured by the full aperture backscatter system and the near backscatter system.

Figure 1. Schematic view of the experimental setup. (a) The laser beams and steps sample arrangement. (b) The cutaway view of the steps sample arrangement. (c) The schematic view of ablator arrangement. (d) The temporal behaviors of the laser shape and the radiation temperature.
Download figure:
Standard image High-resolution imageThe five-step-shaped witness plates Al was mounted over one diagnostic hole at the hohlraum equator. Step thicknesses of the five-step-shaped Al were designed as ∼25 μm, ∼50 μm, ∼75 μm, ∼100 μm, and ∼125 μm. The shock velocities in Al were measured by a streaked optical pyrometer (SOP) [24]. The ablator sample was mounted on the other diagnostic hole. According to the analysis of the radiation field by using the 3D view-factor code named IRAD3D [25], the radiation temperatures on the two samples are almost the same. As shown in figure 2, deviation of the radiation temperatures are no more than 0.5 eV for the two samples. The laser spots were located at the waist. Distance between the sample and laser spots varies with spatial position. And the spatial distribution of  is not the same with different spatial integral positions. However the difference is trivial. Thus the radiation temperature on the ablator is closed to that on the Al sample.

Figure 2. The spatial distribution of  at different positions. Here z is the spatial integral direction, and x is the space resolution direction. Schematics of z and x are shown in figure 1(c).
Download figure:
Standard image High-resolution imageDuring the experimental campaigns, one successful shot was performed and we obtained a high quality burn-through image. The ablator sample was two-step-shaped Au. The step thicknesses were ∼0.95 μm, and ∼1.15 μm, respectively. A layer of about 1.1 μm thick CH was lined at the inner surface of the ablator to support the thin Au sample. An x-ray streaked camera (XSC) with a transmission grating, an imaging slit, and an offset slit was used to measure the time-resolved streaked image of the x-ray burn-through flux from the exterior surface of the ablator sample. It was set up to be sensitive to the x-ray energy of 195–227 eV. The burn-though flux was imaged in the left-right direction. As the ablator was burned through, x-ray at this energy band could be probed by the XSC.
3. Results and discussion
3.1. Peak radiation temperature
Accurate knowledge of the x-ray flux on ablator is crucial to analyze the mass ablation rate. The radiation source is usually measured by F-XRD and M-XRD through LEH. Previous study shows that the peak radiation temperature measured by F-XRD may deviate with the real radiation source inside the hohlraum [19]. The shock wave technique deduces the radiation temperature by the experimental result of Al sample which is standard material. Its opacity and equation of state (EOS) have been extensively studied. And the radiation temperature 'felt' by the Al sample and the ablator is almost the same. The peak radiation temperature obtained from shock wave technique is more accurate. Thus the shock wave technique is used to deduce the peak radiation temperature in this experiment. The experimental results show that the two peak radiation temperatures obtained by F-XRD and the shock wave technique are different in the two-LEHs spherical hohlraum.
In the experiment, nearly constant radiation temperature was obtained in the spherical hohlraum. The time behavior of radiation temperature ( ) and M-band fraction (
 ) were measured by F-XRD and M-XRD, respectively. In figure 3, the measured temporal behaviors of
  and
and  are shown. The peak radiation temperature is about 136 eV, and the error bar of
  is taken as 3% [26]. The M-band fraction is about 2.5%. The radiation temperature is nearly constant from 0.8 ns to 2.8 ns. The radiation temperature merely raises ∼10 eV.
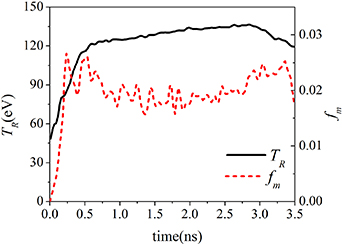
Figure 3. The measured temporal behaviors of radiation temperature and M-band fraction.
Download figure:
Standard image High-resolution imageThe step thicknesses of Al sample were measured before the experiment. With the step thicknesses information and the breakout time intervals deduced by the SOP image, the average shock velocities can then be obtained. With the measured shock velocities, the radiation temperature 'felt' by the Al sample can be obtained according to the relation between the radiation temperature and the shock velocity. The relation is found by numerical simulation. The detailed analysis is similar with that in [10]. The temporal behavior of the radiation temperature and the M-band fraction in simulation is taken from the experiment, as shown in figure 3. Numerous peak  and
and  have been used in simulation. The shock velocities vary with peak
  and
and  . When the calculated velocities of different steps with some particular
  and
and  agree with the measured velocities, then these
  and
and  are considered as the radiation source which are 'felt' by the Al sample.
The observed shock velocities  in Al witness plates are shown in table 1. The laser energy in table 1 is without the backscattered laser energy. The backscattered laser energy fraction was ∼10%. As the last step was not so smooth, the average shock velocity from the fourth step to the fifth step has not been list. Shock velocity
  represents the average shock velocity from step (
 ) to step (
 +1), and
  = 1, 2, and 3. The average shock velocities were about 28–31 km s−1 in the experiment. The uncertainty of the shock velocities is lower than 3%. The thickness and the time uncertainties have been taken into consideration to analyze the velocity uncertainties.
Table 1. The measured shock wave velocities in the Al witness plates.
| Laser energy (kJ) | 37.5 | 37.6 | 38.8 |
|---|---|---|---|

| 29.24 ± 0.82 km s−1 | 28.99 ± 0.91 km s−1 | 30.61 ± 0.84 km s−1 |

| 29.27 ± 0.84 km s−1 | 28.63 ± 0.78 km s−1 | 29.12 ± 0.78 km s−1 |

| 29.57 ± 0.82 km s−1 | 28.31 ± 0.78 km s−1 | 29.64 ± 0.81 km s−1 |
The average shock velocities of Al under numerous groups of ( ,
,  ) have been calculated by using the multi-group radiation hydrodynamic code MULTI-1D [27], which solves the one-dimensional planar hydrodynamic equations coupled with the radiation transfer equation. It is widely used in the ICF study, such as laser target coupling [28], hohlraum physics and x-ray matter interaction [29]. The EOS of Al is from the sesame library (material CODE = 41) and the multi-group opacity of Al is from Thermos.
In figure 4, it is contour lines of the Al shock velocities in the  plane. The black lines are contour lines of
  . The red lines are contour lines of
  . The blue lines are contour lines of
  . The solid lines are the observed shock wave velocities, and the dashed lines are obtained after considering the uncertainties of the shock wave velocity. For a given shock wave velocity, the radiation temperature rises slowly as
  increases from 0 to 0.05. The M-band fraction is taken as 0.25 ± 0.25. It is of small influence on the shock wave velocity. The overlapping region of the dashed lines agrees with the observed
  ,
,  and
and  in the Al witness plates. And
  in that region gives the peak radiation temperature 'felt' by the Al samples. In figure 4, the peak radiation temperature is 157.5 ± 2.3 eV. On the other hand, radiation temperature between Al and Au sample is of a little difference. It also varies along the left-right direction (x-axis), as shown in figure 2. And these two factors may lead to uncertainty of ∼1 eV. Thus the peak radiation temperature on the ablator sample is about 157.5 ± 3.3 eV, and its uncertainty is less than 2%.
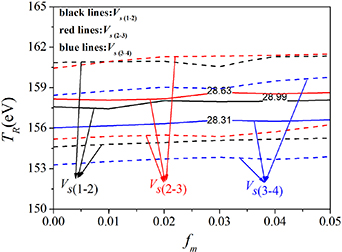
Figure 4. Contour lines of the Al shock velocities in the  plane. It is in unit of km s−1. The solid lines are the observed shock wave velocities, and the dashed lines are obtained after considering the uncertainties of the shock wave velocity. The overlapping region of the dashed lines provides the data of peak
  .
.
Download figure:
Standard image High-resolution imageThe peak radiation temperatures obtained by F-XRD and the shock wave technique are different. For comparison, the peak radiation temperatures in three shots are presented in figure 5. The peak radiation temperature uncertainty measured by F-XRD is about 3%. It is larger than that obtained by the shock wave technique, which is less than 2%. The peak radiation temperatures obtained by the shock wave technique are of ∼20 eV's higher than those measured by F-XRD. This result is in consistent with [18]. The difference is due to the different field of views between F-XRD and the sample. F-XRD views the hohlraum from LEH at 42°. Field of view of F-XRD is also shown in figure 5. In the two-LEH spherical hohlraum, it cannot view the laser spot. And it is also influenced by the cold plasmas outside the hohlraum [11]. Thus the measured F-XRD radiation temperature is lower. However the sample was mounted over the diagnostic hole on the waist. The laser spots were also located at the waist. And large amounts of the radiation flux from the laser spots could irradiate the interior surface of the sample. Thus the radiation temperature felt by the sample is higher than that measured by F-XRD.

Figure 5. The peak radiation temperature outside the spherical hohlraum measured by F-XRD (black squares) and inside the spherical hohlraum determined by the shock wave technique (red circles).
Download figure:
Standard image High-resolution image3.2. Analysis of mass ablation rate
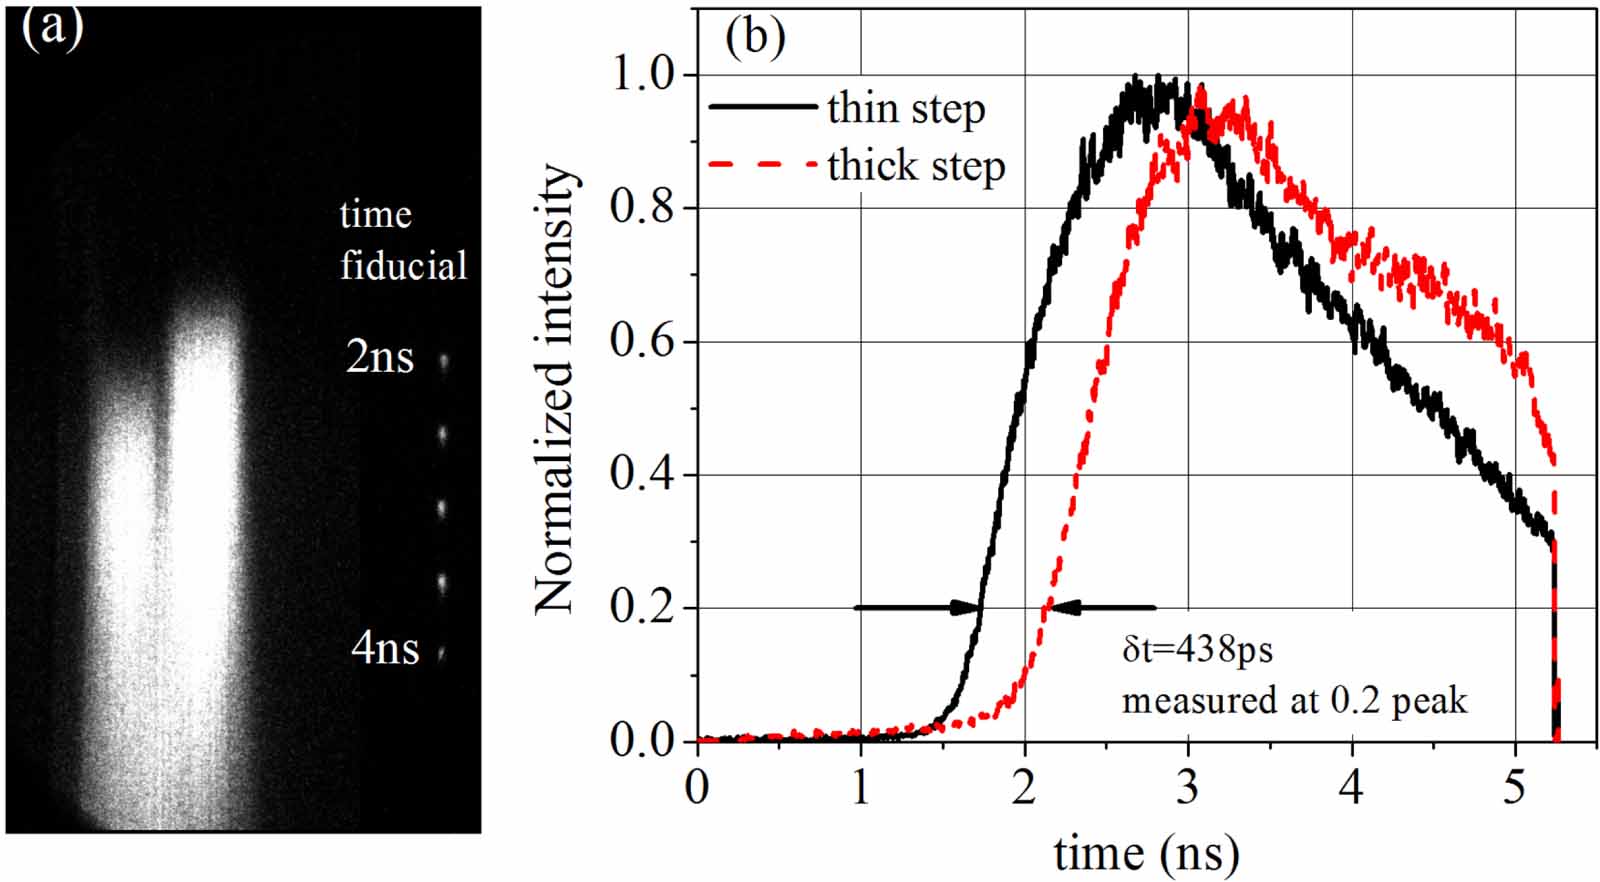
In the experiment, one successful shot was performed and obtained a high quality burn-through image of a two-step-shaped Au sample. In the shot, the peak radiation temperature obtained by F-XRD and the shock wave technique were ∼136.5 ± 4.1 eV and ∼157.5 ± 3.3 eV, respectively. The burn-through image is shown in figure 6(a). The time fiducial was used to correlate the radiation temperature history with the burn-through image. Time interval was 0.5 ns between two neighboring time fiducial points. The normalized intensity-time line-outs taken from the burn-through image is shown in figure 6(b). Marshak wave in the ablation region is self-similar. And the ablation rates in the two steps were nearly the same. The difference of mass thickness is equal to the corresponding mass ablation rate times the difference of burn-through time between the two steps. Since the ablator density and the step thickness were measured before the experiment, the mass ablation rate ( ) can then be inferred. It is written as:

Figure 6. (a) An example XSC image with time fiducial. (b) The corresponding intensity-time line-outs.
Download figure:
Standard image High-resolution imageParticularly,  = 0.2 μm is the delta thickness of the two steps, and
  is the burn-through time interval. The ablation front is measured at 0.2 peak. The two steps were burned through at ∼1.715 ns and ∼2.153 ns, respectively. And
  is about 0.438 ns. Thus the mass ablation rate of Au is (18.93 g cm−3)(0.2 μm)/(0.438 ns) ≈ 0.86 mg cm−2 ns−1. For the two radiation sources, the temperature is different during the burn-through time interval. As the peak radiation temperature being ∼136.5 ± 4.1 eV and ∼157.5 ± 3.3 eV, the radiation temperature at that period is 131.5 ± 5.5 eV and 152.8 ± 4.7 eV, respectively.
The uncertainty of the mass ablation rate is due to the step sample density and thickness uncertainties and the burn-through time uncertainty. The uncertainty in density is ∼1.5%. The step sample thickness uncertainty is ∼0.7%. And the uncertainty of  is ∼1%. The burn-through time uncertainty comes from the streak camera sweep rate and the rough ablation front. The streak camera sweep rate is about 2.72 ± 0.07 ps/pixel. The delta pixel of the ablation front between the two steps is 161 ± 3.08 pixel. Thus the uncertainty of
  is ∼3.2%. Then the mass ablation rate uncertainty is ∼3.8% by equation (1).
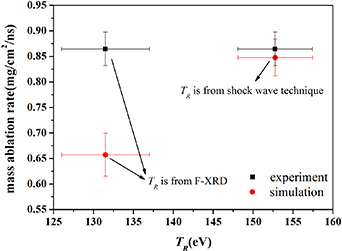
The mass ablation rate of Au is calculated by using the radiation hydrodynamic code MULTI-1D. The EOS of Au and CH is from the sesame library and the multi-group opacity of Au and CH is from the Thermos and SNOP code [27], respectively. The x-rays ranging from 0 to 5 keV are divided into 75 groups. With the peak radiation temperature being 136.5 ± 4.1 eV and 157.5 ± 3.3 eV, the mass ablation rate at energy band 195–227 eV has been calculated. To simplify the analysis, the M-band fraction is the same with that in figure 3. In figure 7, it is the measured and simulated mass ablation rate. In simulation, the peak radiation temperature uncertainty is taken into consideration to analyze the  uncertainty. The mass ablation rate calculated by using the peak radiation temperature obtained from the shock wave technique agrees well with the experimental result. However the lower peak radiation temperature measured by F-XRD results in about 20%'s decreases of mass ablation rate in simulation. And the shock wave technique is crucial to provide the 'real' radiation source data. In this way, we can obtain more accurate peak radiation temperature on ablator.
Figure 7. The experimental (black squares) and simulated (red circles) mass ablation rate (mg cm−2 ns−1).
Download figure:
Standard image High-resolution image
4. Conclusions
In summary, we have established a novel diagnostic platform for more accurate diagnosis of the peak radiation temperature on the ablator. In the experiment, nearly constant radiation temperature was used to lower the uncertainty of the radiation temperature. Temporal behavior of the radiation source was measured by F-XRD and M-XRD through the LEH. The peak radiation temperature was determined by the shock wave technique. A high-quality burn-through image of a two-step-shaped Au ablator was obtained in the experiment. The simulated mass ablation rate agrees with the experimental result. Experimental results also show that the peak radiation temperature measured by F-XRD is about 20 eV lower than that deduced by the shock wave technique. This deviation results in about 20%'s decreases of the mass ablation rate in the simulation. Thus, the shock wave technique is crucial to deduce the peak radiation temperature on ablator. It can provide more accurate experimental data for numerical simulations and for ICF ignition target design.
Acknowledgments
This work was supported by the National Natural Science Foundation of China (Grant Nos. 11805187, 12075218, 12075219, and 12105269), Presidential Foundation of China Academy of Engineering Physics (YZJJLX2018011), the Science Challenge Project (No. TZ2018001) and the Laser Fusion Research Center Funds for Young Talents.
Data availability statement
No new data were created or analyzed in this study.