
Abstract
In a recent article by Li et al (2019 Sci. Adv. 5. eaav7940), experimental results from a dual-color laser wakefield acceleration (LWFA) were presented. In the present paper we, primarily, focus on detailed simulation studies of such a scheme in the self-injection and ionization injection regimes, respectively. The spatiotemporally-overlapped 30 fs dual-color laser pulses are at fundamental (FL, 800 nm, 'red') and second-harmonic (SH, 400 nm, 'blue') wavelengths. They are (a) co-propagating in an under-dense plasma, (b) relativistically intense (I > 1018 W cm−2) and (c) having relatively high-energy (multi-Joule, loose focusing) and low-energy (sub-Joule, tight focusing), respectively. The basic concept of the scheme is the fact that the depletion length (Lpd) for a relativistic laser pulse in an under-dense plasma has an inverse quadratic dependence on the laser wavelength (∝1/λ2). Here, first by using a single FL 77 TW/30 fs laser pulse to drive a LWFA, an electron beam was accelerated up to ∼400 MeV from a background plasma having an electron density of 1019 cm−3. Then, by driving the same LWFA by co-propagating 'blue' 7 TW/30 fs and 'red' 70 TW/30 fs laser pulses, the electron energy reached ∼700–800 MeV (maximum). The simulations confirm that in such a dual-color LWFA scheme, the role of the SH laser pulse is post-accelerating electrons after a rapid depletion of the FL laser pulse in the plasma. Furthermore, the SH pulse assists the ionization-injection of the electrons which is an additional benefit of the dual-color LWFA scheme.
Export citation and abstract BibTeX RIS

Original content from this work may be used under the terms of the Creative Commons Attribution 4.0 license. Any further distribution of this work must maintain attribution to the author(s) and the title of the work, journal citation and DOI.
1. Introduction
Recently, a laser wakefield acceleration (LWFA) scheme [1] driven by dual-color laser pulses via particle-in-cell (PIC) simulation studies has attracted a noteworthy attention. In 2014, Yu et al [2] and Xu et al [3] proposed employing two laser pulses of different wavelengths in the generation of low-emittance electron beams, respectively. In such a scheme, a long-wavelength (mid-infrared) laser pulse, with a large ponderomotive force and small peak electric field, was used to excite a large plasma wake while a copropagating or transverse-colliding, time-delayed, and short-wavelength intense laser pulse was employed to trigger ionization injection [4–10] of electrons from the inner-shell high-Z ions (such as krypton, nitrogen, carbon or oxygen) inside the wake. The short-wavelength laser pulse can produce electrons with small residual momenta ( ) inside the wake, leading to electron beams with small normalized emittances. In 2015, Zeng et al [11] proposed a method based on overlapping two relativistic laser pulses at the fundamental (FL; 1 ω) and third harmonics (3 ω) inside a plasma to trigger ionization injection of electrons only over a short distance by the coherent interference of the two laser pulses, leading to the possibility of generating polychromatic narrow energy-spread electron bunches. In 2018, Pathak et al [12] proposed the use of two co-propagating dual-color laser pulses in an all-optical dual-stage LWFA to enhance the electron beam energy. In this scheme, electrons can gain threefold higher energy than the gain achievable from a standard LWFA driven by a single-color laser pulse with equivalent power. Also, Zhang et al [13] proposed using two laser pulses with different polarizations or wavelengths to improve the hybrid laser wakefield and introduce further direct laser acceleration [14–16], leading to higher energy and yield of the accelerated electrons. Based on those theoretical studies, S. Li et al, conducted experiments to validate the feasibility of using co-propagating dual-color (FL, 800 nm 'red' and second harmonic, SH, 400 nm 'blue') laser pulses of a total power ∼80 TW to drive a LWFA in the regimes of self-injection [17, 18] and ionization injection in 2019 [19]. The simulations were focused on dual-color laser pulses driving a LWFA in the self-injection regime (helium gas was used as a target). However, there was no simulations of the more-important case of dual-color LWFA in the ionization injection regime (where mixed helium and nitrogen gases were used). Here, we present comprehensive dual-color LWFA simulations for both regimes (self-injection and ionization injection) and an extended discussion that includes additional experimental results confirming the robustness and benefits of the dual-color co-propagating laser pulses in driving LWFAs.
2. Simulation results and discussions
The simulations (two-dimensional) were conducted using the PIC code OSIRIS-v4 [20]. For the case of single laser pulse driven-LWFA, the simulation parameters were: 2.3 J energy, 30 fs pulse duration, ∼77 TW power, 800 nm wavelength, w0 = 25 μm spot size, and a normalized laser vector potential of a0 = 1.9. For the LWFA driven by dual-color laser pulses, the simulation parameters for the FL pulse were: 2.1 J, 30 fs, 800 nm, 70 TW, w1 = w0 = 25 μm, &  = 1.83 and the parameters for the SH laser pulse were: 200 mJ (∼10% of the FL pulse energy), 30 fs, 400 nm, 7 TW, w2 = 2.5 μm &
  = 2.82. The time delay between the two pulses was varied to t0 + ta (SH pulse is ahead of the FL pulse) or t0−td (SH pulse is delayed). The simulation box, which was moving with the light speed c, had a size of 120 × 160 μm2 along z and x directions, respectively. The cell size was 1/64 μm × 1/4 μm and the average number of particles per cell was 16. The gas medium had a 0.2 mm linear up-ramp from the vacuum and then a flat-top plateau of uniform density for 3.8 mm in length. The laser pulse waist was positioned at the start of the gas density plateau.
2.1. Simulation of a LWFA driven by a single FL laser pulse in helium gas
Figure 1 shows the simulation results of a LWFA driven by single 77 TW, 800 nm P-polarized laser pulse (with a corresponding critical density of nc = 1.745 × 1021 cm−3) in helium of 8 × 1018 cm−3 gas density; electrons are self-injected into the plasma wave due to the transverse wave-breaking as the laser intensity evolves to a0 > 4.5. Figure 1(a) shows a plasma wave (ions bubble) [21, 22] excited by the pondermotive force of the laser pulse which undergoes a strong self-focusing. The laser pulse front starts to steepen and shorten, as shown in figure 1(b), due to the self-phase modulation and an electron bunch is injected into the bubble. More electrons are continuously expelled by the laser's ponderomotive force, flow backwards due to the charge separation with the ions towards the rear of the bubble, and then are self-injected and accelerated, as seen in figure 1(c). During the process of acceleration, as the laser pulse propagates it is gradually eroded and depleted. One also can see that electrons start to perform the well-known betatron (transverse) oscillations due to the electromagnetic interaction with the stationary ions of the bubble, figures 1(c)-(e). Eventually, the laser pulse is depleted upon propagating ∼1.8 mm in the plasma, then the bubble is driven by high-energy electrons, as shown in figure 1(d). Due to continuous oscillations of the accelerated electrons and the obvious deterioration of its geometrical quality or emittance, the bubble gradually shrinks and finally disappears within 3 mm, figures 1(e) and (f). The electron energy spectrum is continuous, the maximum energy (i.e. highest energy) of some electrons reaches 400 MeV at ∼4 mm, whereas most of the electrons have energies from 0 to 200 MeV, figure 1(f).
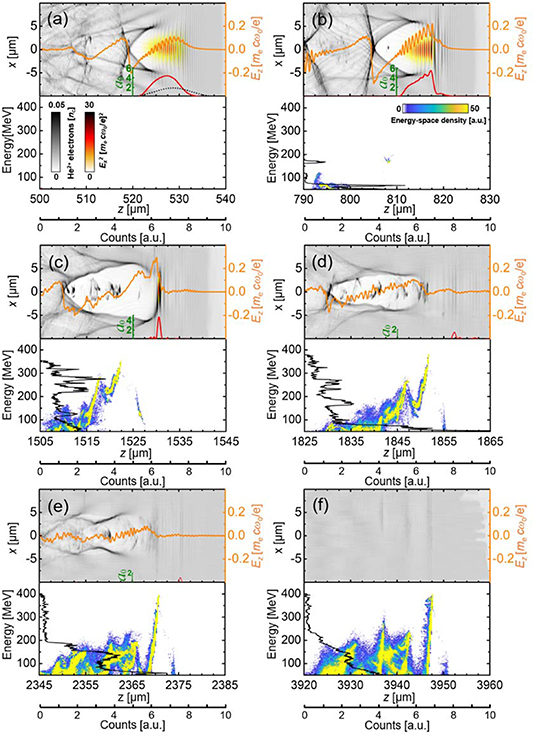
Figure 1. Simulation of a typical LWFA driven by a single FL laser pulse (77 TW, 30 fs) in a helium gas where electrons are self-injected into the plasma wave (a bubble of ions surrounded by expelled electrons) as a result of the transverse wave-breaking at the back of the bubble. The upper-half panels in (a)–(f) show evolutions of laser electric field (Ex) in x-z plane, the density distribution of the He2+ electrons (gray-scale) in x-z plane, and lineout (orange lines) of the wakefields (Ez) along z-axis. Black dotted curve in (a) shows the initial a0 distribution and the red curves in (a)–(e) show the evolution of a0 distribution. The lower-half panels show the energy-space distributions along the z-axis and the energy spectra (black lines) of the injected and accelerated electrons. It is shown that for the current gas density (8 × 1018 cm−3) the laser pulse was fully depleted after ∼2.38 mm, see (e) and (f).
Download figure:
Standard image High-resolution image2.2. Simulation of a LWFA driven by dual-color laser pulses in helium gas
On the other hand, figure 2 shows the evolution of a LWFA driven by dual-color co-propagating FL (70 TW, 30 fs, P-polarized) and SH (7 TW, 30 fs, S-polarized) laser pulses with a time delay of 0 fs in helium gas having a density of 8 × 1018 cm−3. Figure 2(a) shows a bubble driven by the FL pulse which is strongly self-focused, as in figure 1(a). As the bubble is formed, electrons started to be injected and accelerated, figures 2(b) and (c), to high energy with a maximum of ∼400 MeV. Then, the FL pulse is almost depleted, as shown earlier in the single-laser driven LWFA case. The accelerated electrons enter into deceleration phase of the wakefield and the acceleration is almost terminated due to laser depletion. However, the accelerated electron bunch plays a key role in sustaining a bubble for acceleration, replacing the role of the FL pulse in accelerating a trailing electron bunch, as shown in figures 2(d) and (e), to ∼450 MeV (max) within 2 mm of propagation in the plasma. The synchronized SH laser pulse, being relativistically self-guided for 2 mm of propagation in the plasma, is still energetic to play a role in the remaining 2 mm of the plasma. It is capable of exciting a plasma wave, of a similar wakefield intensity [max Ex = −0.15 (in normalized units of  )], which can be considered as a second-stage accelerating structure for the electrons, which are organized in two bunches separated by a plasma wavelength, as shown in figures 2(e) and (f). Finally, the maximum energy of the second electron bunch (labeled 2) in figure 2(f) reaches 770 MeV and the first electron bunch (labeled 1) reaches a maximum energy of 520 MeV over an acceleration distance of 4 mm.

Figure 2. Simulation of a LWFA in helium gas at the same gas density of 8 × 1018 cm−3 driven by dual-color laser pulses. The upper-half panels in (a)–(f) show evolutions of laser electric fields (Ex for the FL pulse and Ey for the SH pulse) in x-z plane, the density distribution of the He2+ electrons (gray-scale) in x-z plane, and lineout (orange lines) of the wakefields (Ez) along z-axis. Black dotted curve in (a) shows the initial a0 distribution of the FL pulse along the z-axis, the red curves in (a)–(f) show the evolution of a0 distribution of the FL pulse, and the blue curves in (a)–(f) show the evolution of a0 distribution of the SH pulse which is synchronized and co-propagated with the FL laser pulse. The lower-half panels show the energy-space distributions along the z-axis and the energy spectra (black lines) of the injected and accelerated electrons. See text for the dual-color laser parameters.
Download figure:
Standard image High-resolution imageFigure 3(a) shows evolutions of the peak-electric field amplitudes of single FL pulse and dual-color pulses during the LWFA processes. One can see that the FL pulse undergoes strong self-focusing and spot size oscillations due to the fact the laser spot size is large and unmatched with the plasma wavevector ( ≫
≫ ), and then it depletes quickly within ∼2 mm. The SH pulse, which is tightly focused and possesses a closer matching with the plasma wavevector (
 <
<  ), undergoes a modest evolution (to an intensity similar to the initial value) over the whole interaction length with some oscillations near the end of the laser-plasma interaction. Thus, the SH pulse has an ability to drive wakefield acceleration to further accelerate electrons from 450 MeV to 770 MeV (max). As plotted in figure 3(b), the maximum electron energy can be tuned by changing the time delay between the dual-color laser pulses. By fine-tuning the time delay to 0 fs, an electron energy of 770 MeV can be obtained, as seen in figure 3(c). Furthermore, the effect of polarization of the SH pulse on the electron energy gain is presented in figure 3(d). For a time delay of 0 fs, the maximum electron beam energy could reach 530 MeV for P-polarized SH pulse (as that of the FL pulse) and a similar electron energy of 536 MeV was also achieved when it was circularly (C-) polarized, respectively. Since the E-field direction of the S-polarized SH pulse is not in the x-z plane, the electron bunch 2 in figure 2(f), which is self-injected in the bubble driven by the electron bunch 1, could be easily captured by the second-stage accelerating wakefield driven by the SH pulse with less oscillations. Simultaneously, the electron bunch 2 experiences the accelerating phase while the electron bunch 1 already enters into decelerating phase, leading bunch 2 to gain a higher energy than that of bunch 1 at this position, see figure 2(f). As a result, there is a sharp increase in the maximum energy of the accelerated electrons, which refers to the maximum energy of electron bunch 2, in figure 3(d). However, for the P- and C-polarized SH pulses, the energy of electron bunch 2 is lower than that of electron bunch 1. Therefore, the boosting capability of the S-polarized SH pulse on the electron energy is stronger than that of P- and C-polarized SH pulses, consistent with published work [13].

Figure 3. (a) Evolutions of the laser's peak electric field amplitudes for two cases in helium plasma: black dotted line for the single FL pulse LWFA with the full energy of 2.3 J; red and blue lines for the FL and the SH pulses in the case of dual-color LWFA, respectively. (b) Energy spectra of the accelerated electrons after an acceleration distance of 4 mm obtained by single FL pulse and dual-color pulses of different time delays, where positive delay indicates that the SH pulse leads the FL pulse. (c) Maximum electron energy reached after 4 mm distance as a function of time delay between the FL and SH laser pulses and the dotted black line indicates the maximum electron energy obtained by the single FL pulse of 2.3 J. The SH pulses are all S-polarized and have the energy of 0.2 J in (a)–(c). (d) Evolutions of the maximum energies of the accelerated electrons for four cases: black dotted line for P-polarized single 2.3 J FL pulse, red line for P-polarized FL (2.1 J) + S-polarized SH pulses (0.2 J), blue line for P-polarized FL (2.1 J) + P-polarized SH pulses (0.2 J), and green line for P-polarized FL (2.1 J) + C-polarized SH pulses (0.2 J), respectively. The time delays between the dual-color laser pulses are 0 fs in (d).
Download figure:
Standard image High-resolution imageIn addition, it is possible to have an estimate for the energy gain of a dual-color-laser driven LWFA according to the input parameters of the lasers in our simulations. In the LWFA, the effective acceleration length is determined by the laser's depletion length  or the dephasing length
  , where
  is the plasma frequency with n0, m, and e are the plasma density, electron rest mass, and electron's elementary charge, respectively. The energy gain in the LWFA driven by the FL pulse is given by
  [12, 23]. After the FL pulse has been depleted, the SH pulse took over the bubble excitation and the acceleration length is estimated as
  , where
  is the bubble radius [23]. Thus, the energy gain in the wakefield driven by the SH pulse is given by
  and the final total energy gain can be estimated as [12, 23],

For a total input laser power of  with the FL power of
  and the SH power of
  , if the power proportion of the SH pulse is defined as
  , then equation (1) can be rewritten as
where G = (1-α)1/3 + 24/3α1/3 is the extra energy gain factor for a LWFA driven by dual-color laser pulses. For α = 0 and G = 1, the energy gain will be same as that of Ref. [23]. According to the laser parameters used in our simulations, α= 0.091 and G is calculated to be around 2.1, which is close to the extra energy gain (G = 1.92) obtained by comparing the results of figures 1(f) and 2(f). Compared with the simulations conducted in Ref. [12], our results show that using a SH pulse of a relatively smaller waist and with only 10% of the full laser energy (sub-Joule, tightly focused) can still dramatically boost the electrons energy gain, and can be managed experimentally [19], as will be discussed in a later section.
2.3. Simulation of a LWFA driven by single FL pulse in a mixture of helium and nitrogen gases
According to the simulations of the self-injection regime shown in figures 1 and 2, one can see that the nonlinear evolution of the self-guided laser pulse will easily cause deformation of the bubble, resulting in a continuous injection, poorly collimated electron spectra, and polychromatic background [24–26]. Ionization injection, on the other hand, occurs at a relatively low plasma density but often results in electron beams with a continuous energy spectrum (large energy spread) [4]. The simulations, which employ co-propagating dual-color laser pulses to excite the ionization injection in the LWFA, are conducted for helium-nitrogen gas mixture with a gas density of 5 × 1018 cm−3 where 99.5% helium gas was doped with 0.5% nitrogen gas. The simulation box also had a size of 120 × 160 μm2 along z and x directions, respectively, and was moving with the light speed c. The cell divided from the simulation box had a size of 1/64 μm × 1/4 μm and the average number of particles per cell was 14. The other laser-plasma parameters are the same as those used in the earlier self-injection simulations. Figure 4 shows the evolution of a LWFA process employing ionization injection driven by an 800 nm, 30 fs, 77 TW single FL pulse. Figure 4(a) shows that ionization injection has occurred and the beam-loading effect [27–29] is triggered as a result of the increased number of trapped electrons. The initially injected electrons entered into the deceleration phase due to the beam-loading effect, as shown in figure 4(b). The subsequently injected electrons entered the acceleration phase and are continuously accelerated by the plasma wakefield, as shown in figures 4(b)-(d). The bubble size is enlarged in both longitudinal and transverse directions due to the strong self-focusing and front-steepened effects of the laser, resulting in a stronger wakefield and acceleration gradient, as seen in figures 4(b)-(c). It is noticed that, in figure 4(d) the laser pulse is depleted and the bubble is driven cooperatively by the laser remanence and the accelerated electron beam. After propagating a distance of ∼3 mm, the laser pulse is almost disappeared and the bubble is solely driven by the electron beam, as shown in figure 4(e). The brown-dotted line in the lower-half panel of figure 4(e) is the final electron beam energy spectrum after an acceleration distance of 4 mm. Eventually, electrons with a maximum energy of 400 MeV, a peak energy (the energy at the highest monoenergetic peak in the energy spectrum) at 326 MeV, and a relative energy-spread of 24.4% in full-width at half-maximum (FWHM) could be obtained.

Figure 4. Simulation of a LWFA driven by a single FL laser pulse (77 TW, 30 fs) in a gas mixture of 99.5% helium and 0.5% nitrogen at a gas density of 5 × 1018 cm−3, where electrons from inner shells of nitrogen atoms are tunnel-ionized near the peak of laser pulse and are injected into the plasma wave (bubble) created by electrons from majority helium atoms and the outer shell of nitrogen atoms. The upper-half panels in (a)–(e) show evolutions of laser electric fields (Ex) in x-z plane, the density distribution of the He2+ electrons (gray-scale) and the N(1-7)+ electrons (blue-scale) in x-z plane, and lineout (orange lines) of the wakefields (Ez) along z-axis. Black dotted curve in (a) shows the initial a0 distribution along the z-axis and the red curves in (a)–(f) show the evolution of a0 distribution. The lower-half panels show the energy-space distributions along the z-axis and the energy spectra (black lines) of the injected and accelerated electrons. The brown-dotted line in (e) is the final electron beam energy spectrum after the 4 mm acceleration distance. See text for the single FL laser parameters.
Download figure:
Standard image High-resolution image2.4. Simulation of a LWFA driven by dual-color laser pulses in a mixture of helium and nitrogen gases
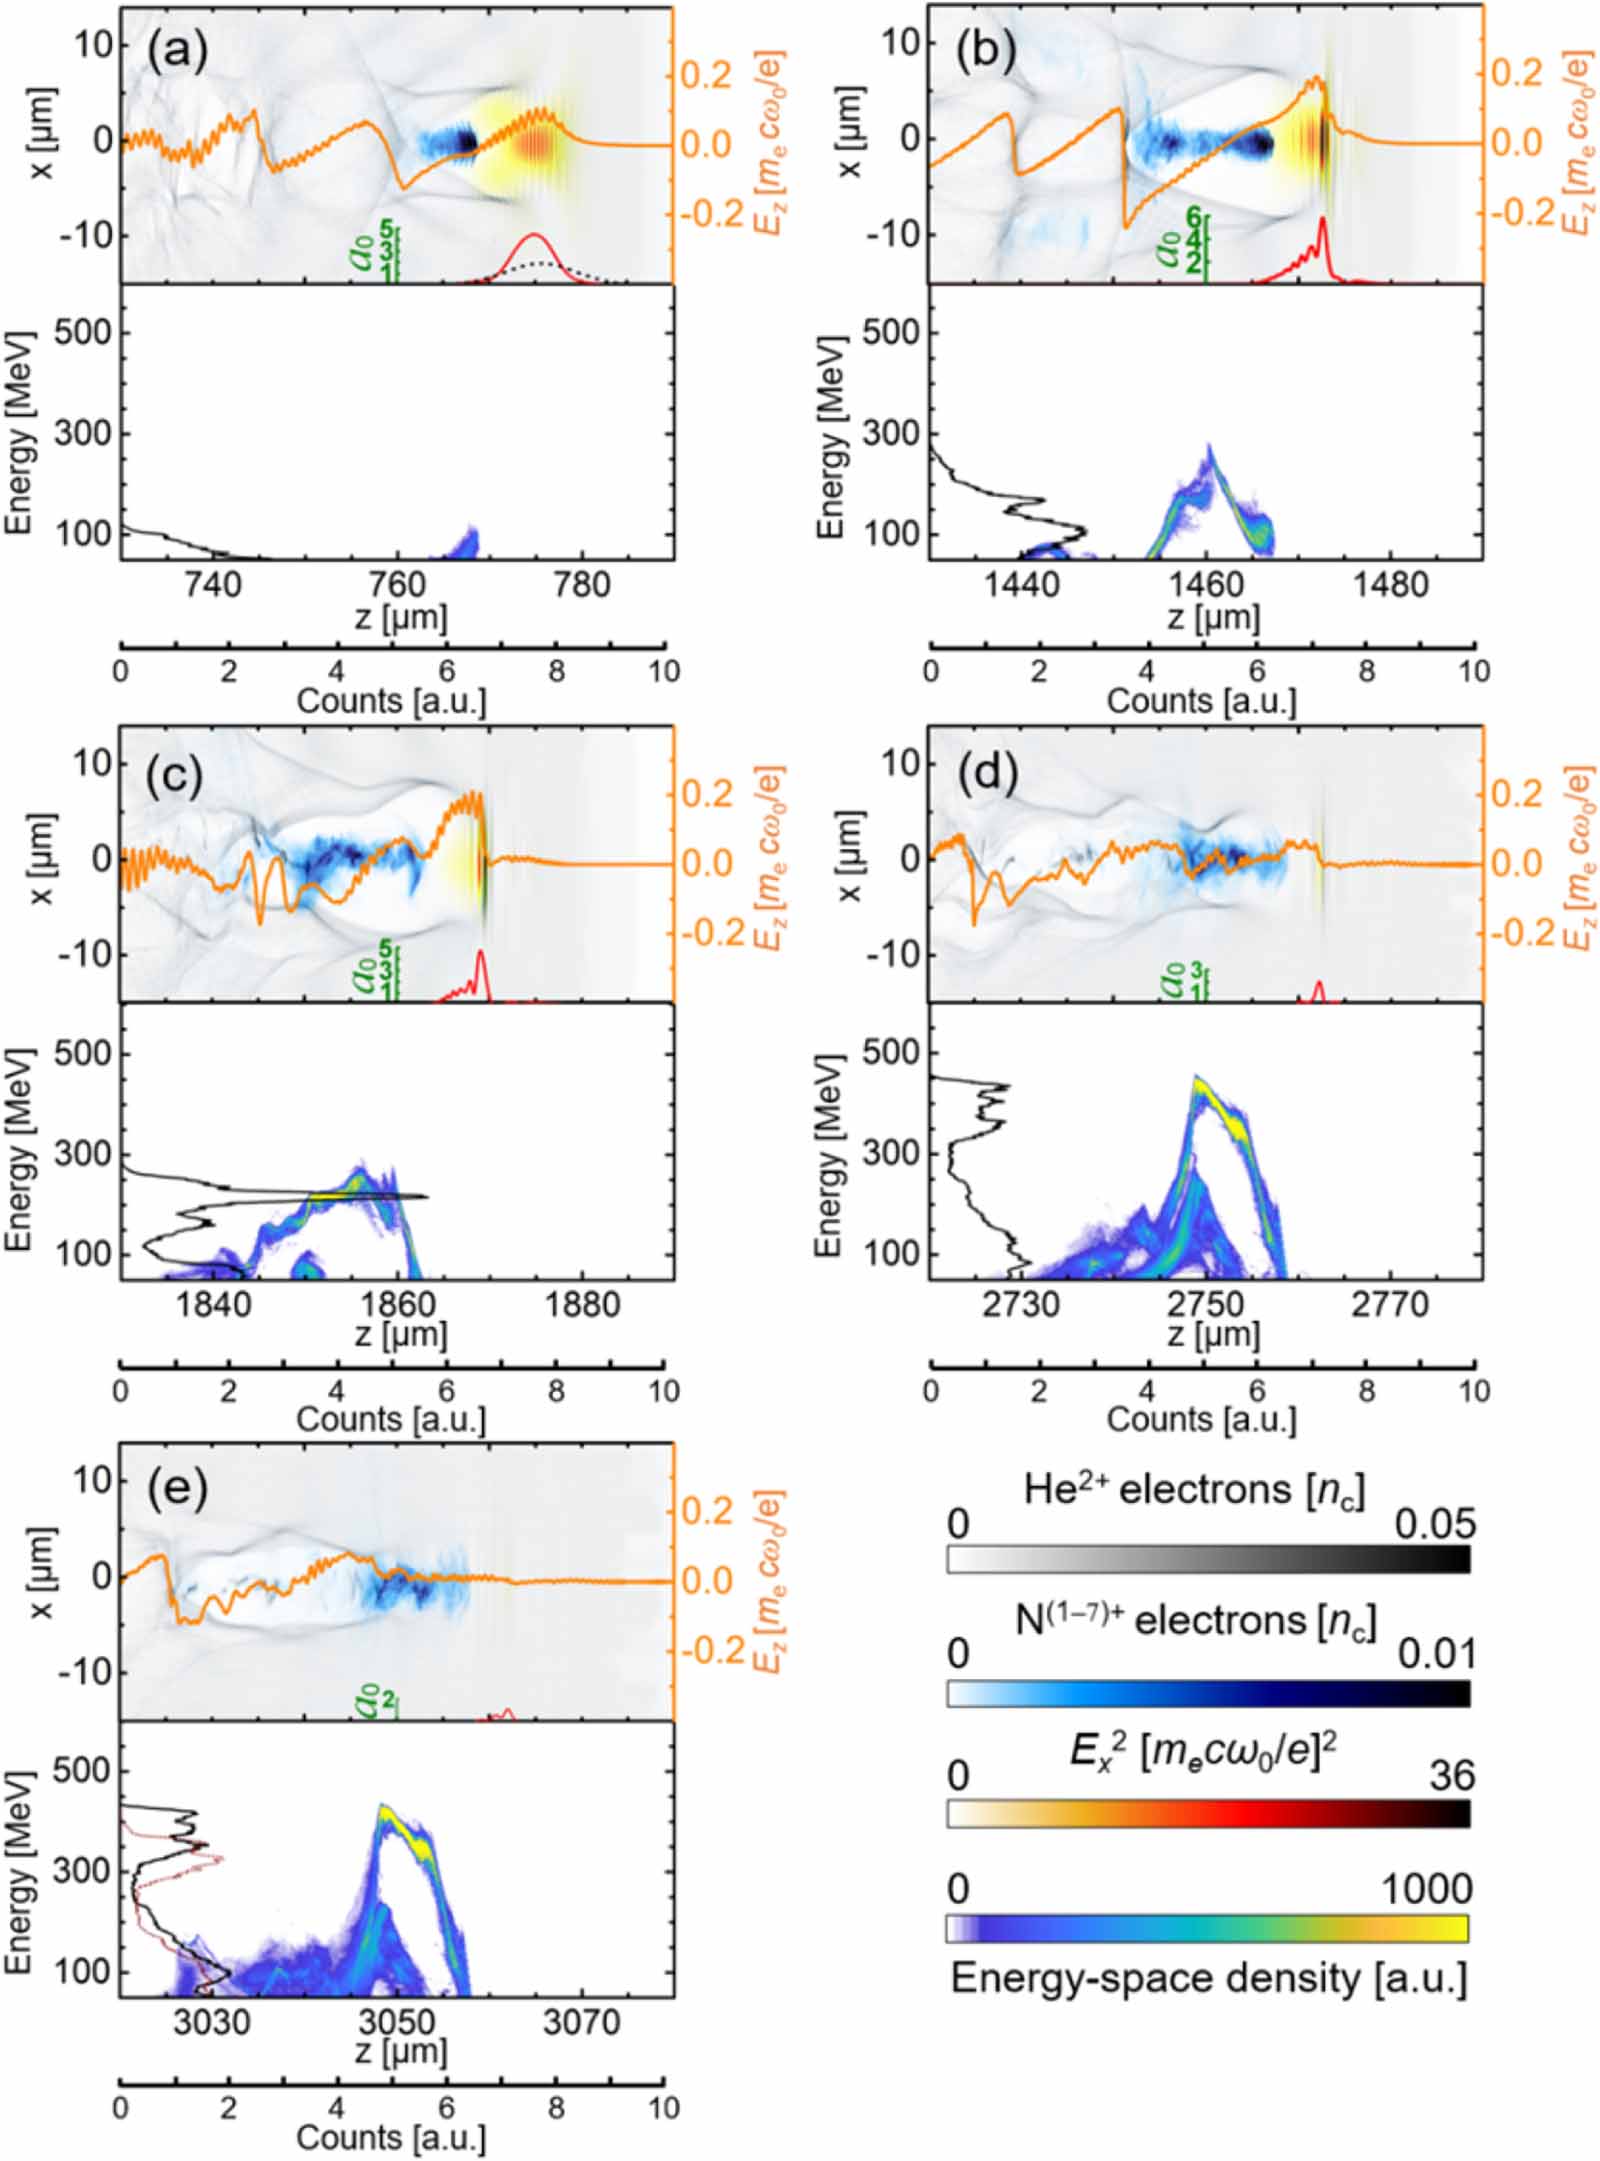
Figure 5 shows the evolution of a LWFA driven by dual-color co-propagating FL (70 TW, 30 fs, P-polarized) and SH (7 TW, 30 fs, S-polarized) laser pulses with a time delay of 0 fs in a gas mixture of 99.5% helium and 0.5% nitrogen at a gas density of 5 × 1018 cm−3. When compared with the single-laser driven LWFA, figures 5(a)-(c) show a similar process: a lot of electrons are ionized from the inner-shell of nitrogen atoms and trapped by the wakefield of the bubble driven by the FL pulse and are rapidly accelerated up to a maximum energy of ∼300 MeV; meanwhile, some of the early injected electrons already entered the deceleration phase due to beam-loading effect. However, it is observed that the bubble structure could be sustained for a longer time due to the use of the SH pulse, as seen in figures 5(d) and (e). Similarly, over the entire 4 mm acceleration distance, the synchronized SH laser pulse has been self-guided in the plasma and helped in maintaining the bubble fields structure. Thus, the subsequently injected electrons can be accelerated to a higher energy as compared to the single-laser driven LWFA case. The brown-dotted plot in the lower-half panel of figure 5(e) is the final energy spectrum after an acceleration distance of 4 mm. Eventually, an electron beam with a maximum energy of 480 MeV, a peak energy of 444 MeV, and a relative energy spread of 9.2% in FWHM is obtained. Not only the maximum and peak energies are enhanced by 20% and 36% respectively, but also the electron beam's energy-spread is reduced significantly.

Figure 5. Simulation of a LWFA driven by dual-color 30 fs laser pulses (70 TW FL + 7 TW SH) in a gas mixture of 99.5% helium and 0.5% nitrogen at a gas density of 5 × 1018 cm−3. The upper-half panels in (a)–(e) show evolutions of laser electric fields (Ex for the FL pulse and Ey for the SH pulse) in x-z plane, the density distribution of the He2+ electrons (gray-scale) and the N(1-7)+ electrons (blue-scale) in x-z plane, and lineout (orange lines) of the wakefields (Ez) along z-axis. Black dotted curve in (a) shows the initial a0 distribution of the FL pulse along the z-axis, the red curves in (a)–(e) show the evolution of a0 distribution of the FL pulse, and the blue curves in (a)–(e) show the evolution of a0 distribution of the SH pulse which is synchronized and co-propagated with the FL laser pulse. The lower-half panels show the energy-space distributions along the z-axis and the energy spectra (black lines) of the injected and accelerated electrons. The brown-dotted line in (e) is the final electron beam energy spectrum after the 4 mm acceleration distance. See text for the dual-color laser parameters.
Download figure:
Standard image High-resolution imageFigure 6(a) shows evolutions of the laser electric-field peak amplitudes of the FL and SH laser pulses in the plasma of 99.5% helium and 0.5% nitrogen for the single-laser and dual-color-laser driven LWFA cases. As discussed earlier in figure 3, due to the mismatch between the FL laser spot sizes and the plasma wavevector during the LWFA process, the FL pulses (2.3 J and 2.1 J) are undergoing strong self-focusing and evolution (focusing and defocusing), and then almost depleted within ∼3 mm distance [33% longer than the case of figure 3(a)] for both of the two cases. However, the FL (2.1 J) pulse of the dual-color-laser LWFA case has depleted relatively slower as comparted with the case of the FL (2.3 J) single-laser LWFA case. The SH laser pulse evolution is modest, and it retained its intensity over most of the interaction length, as shown in blue curve. Figures 6(b) and (c) show the energy spectra of the accelerated electron beams over 4 mm distance for various time delays between the dual-color laser pulses. It is important that the maximum and peak energies of the electron beams as well as the beam's energy-spread are all controllable by tuning the time delay between the dual-color laser pulses. Comparing figures 6(b) and (c) with figures 3(b) and (c), it is obvious that a LWFA driven by dual-color pulses in the ionization-injection regime generates high-quality electron beams with a higher number of electrons at the highest energies and this is achievable over a relatively wider range of time delays as compared with the case of dual-color LWFA in helium plasma (self-injection regime). Additionally, the effect of the SH laser pulse's polarization on the final energy gain has been also investigated for the dual-color LWFA in ionization injection regime, figure 6(d). It is found that the maximum energy gain of the electron beam using C-polarized and S-polarized SH laser pulses is somewhat similar (500–550 MeV), but the energy spectrum is continuous in the former case and quasi-monoenergetic in the latter case (figure 6(b)). Using P-polarized SH pulse, the maximum energy of electrons could reach ∼700 MeV over the 4 mm acceleration distance and the energy spectrum is also continuous in this case.

Figure 6. (a) Evolutions of the laser's peak electric field amplitudes for LWFAs in helium-nitrogen gas mixture driven by single FL 2.3 J laser pulse and by dual-color laser pulses of FL 2.1 J and SH 0.2 J laser pulses. Black dotted line is for the single FL pulse; red and blue lines for the FL and SH pulses, respectively. (b) Energy spectra of the LWFA accelerated electrons obtained by single FL pulse and dual-color pulses with different time delays at an acceleration distance of 4 mm in the plasma, where positive delay indicates that the SH pulse leads the FL pulse. (c) Maximum (red squares) and quasi-monoenergetic peak (blue squares) energies of electron beams versus the time delay between the FL and SH pulses at the acceleration distance of 4 mm, and dotted red and blue lines indicate the maximum and quasi-monoenergetic peak energies obtained by the single FL pulse of 2.3 J. The SH pulses are all S-polarized and have the energy of 0.2 J in (a)–(c). (d) Evolutions of the maximum energy of accelerated electron beams for four cases: black dotted line for P-polarized single FL pulse, red line for P-polarized FL (2.1 J) + S-polarized SH pulses (0.2 J), blue line for P-polarized FL (2.1 J) + P-polarized SH pulses (0.2 J), and green line for P-polarized FL (2.1 J) + C-polarized SH pulses (0.2 J), respectively. The time delays between dual-color pulses are 0 fs in (d).
Download figure:
Standard image High-resolution image3. Experimental results
Here, we provide additional results from the experimental campaigns reported in Ref. [19] in which the implementation of the dual-color-laser driven LWFA scheme was reported in great details. Figure 7(a) shows a block diagram of the experiment. The FL laser pulses (central wavelength λ0 = 800 nm) each with an energy of 2.1 J and duration of 30 fs were split into two beams with different energies (1.9 J and 0.2 J) by a one-inch diameter dielectric mirror, which was placed in the laser beam path after the compressor. The 1.9 J FL laser pulse (central wavelength λ1 = λ0 = 800 nm) was directly focused, to a spot size of w1 = 25 μm, onto a 4 mm-long slit-shaped wave-free gas jet [30, 31] using a long focal length (F/20) off-axis parabolic mirror (OAP #1). The 0.2 J FL laser pulse passes a 300 μm thick β-barium borate (BBO) crystal to generate a SH laser pulse (central wavelength λ2 ≈ 400 nm) with ∼65% efficiency [19]. After passing a variable delay arm #1, the SH pulse is collinearly focused tightly, to a spot size of w2 = 2.5 μm, onto the gas jet by a short focal length (F/4) off-axis parabolic mirror (OAP #2). The remaining FL pulse after the BBO crystal was extracted through a dichroic beam splitter and was used for synchronization of the dual-color laser pulses via shadowgraphy (see figure 7(b)) and for on-line probing the plasma via interferometry (see figure 7(c)) with the assistance of another variable delay arm #2. Therefore, the laser operation modes in the experiments were P-polarized single FL laser pulse (E0 = 2.1 J, τ0 = 30 fs, w0 = 25 μm, λ0 = 800 nm, P = 70 TW) and dual-color laser pulses which are composed of P-polarized FL pulse (E1 = 1.9 J, τ1 = 30 fs, w1 = 25 μm, λ1 = 800 nm, P = 63 TW) and SH pulses of three different polarization (S-, P-, C-) states (E2 = 100 mJ, τ2 = 30 fs, w2 = 2.5 μm, λ2 = 400 nm, P = 3.3 TW). The plasma was formed from the interaction of the drive laser pulses with gas jets of helium and mixtures of helium-nitrogen, respectively. Finally, the accelerated electron beams were detected by a magnetic spectrometer, which was composed of a 16 cm long, 1 T dipole magnet and an absolutely calibrated image plate, for measuring the energy spectra.
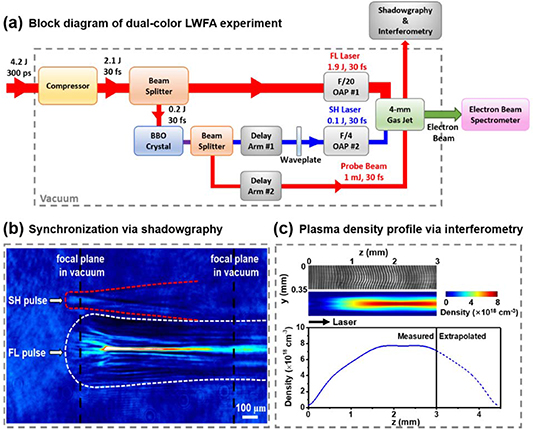
Figure 7. Implementation of the dual-color-laser driven LWFA scheme. (a) Block diagram of the experiment. (b) Side-view plasma shadowgraph for the relative time delay zero (0 fs) between the FL and SH laser pulses. A 30 fs probe beam was used as a back lighter. The white and red dash curves depict the contour of plasma channels driven by the FL and SH pulses at low intensities during preparations, respectively. Two black vertical lines show the focal planes in vacuum of FL (right) and SH (left) pulses, respectively. The FL and the SH pulses were intentionally misaligned in the vertical direction for the purpose of visualization. (c) An interferogram for the electron density measurement and the corresponding two-dimensional distribution and on-axis profile of the electron density for the fully-ionized plasma generated by the interaction of dual-color lasers with the helium gas.
Download figure:
Standard image High-resolution imageAt first, the results obtained from the helium plasma are presented. Using a single FL laser pulse with the full power (70 TW) as a drive, electron beams with an energy spectrum having two quasi-monoenergetic peaks at ∼115 MeV ± 3% and ∼75 MeV ± 1.5% were generated at a plasma density of 8 × 1018 cm−3, as shown in figure 8(a) and in black in figure 8(e). The plasma density profile was measured on-line every shot via interferometry [32], see figure 7(c). On the other hand, by using the dual-color-laser scheme with the SH laser beam having P- and S-polarization states, and a time delay between the two laser beams of ∼0 fs at the same plasma density, the maximum energy of the electron beam has been dramatically boosted, as shown in figures 8(b) and (c). When the SH laser pulses are having P-polarization, the electron energy got a remarkable boost (more than twofold); generating a high-energy bunch with a peak energy of ∼180 MeV ± 5.5% and a maximum energy at ∼400 MeV ± 12%, as shown in figure 8(b) and in blue in figure 8(e). For the S-polarized SH pulses, figure 8(c) and the red curve in figure 8(e), the dual-color-laser driven LWFA scheme leads to a more dramatic energy enhancement, generating a bunch of a broad energy spectrum with a maximum energy of ∼600 MeV ± 19%. When the SH laser pulses are set to be C-polarized, there was no clear enhancement of the electron energy; however, the total charge of electron beam appears to be higher than those obtained using the full FL pulse, as shown in figure 8(d) and in green in figure 8(e). According to the results of figure 8, it can be inferred that when employing a dual-color LWFA scheme, the S-polarized SH pulse has the best electron energy-boosting capability, which is consistent with the simulations results presented in section 2.2.

Figure 8. Electron energy spectra from LWFA in a helium gas jet for different experimental conditions. Each spectrum was obtained from accumulation of data on the image plates (IPs) from five laser shots using (a) the full-power FL laser pulse (2.1 J, 800 nm, P-polarization) and (b) through (d) dual-color LWFA scheme with a clipped FL (1.9 J, 800 nm, P- polarization) and SH (0.1 J, 400 nm) laser pulses of various polarizations for the SH pulse at a relative time delay of ∼0 fs. The electron density, inferred from interferometry was 8 × 1018 cm−3. The signals shown at the ∞ direction are betatron x-rays emitted by the accelerated electrons as a result of their transverse oscillations in the plasma ions channel. (e) Vertically integrated electron spectra in logarithmic scale for the shots in (a) to (d). The maximum energy here is defined as the electron energy where the charge density of the electron beam is below 0.7 pC MeV−1. The horizontal error bars correspond to the resolution of the spectrometer, which are ±5.5%, ±12%, and ±19% at 180, 400, and 600 MeV, respectively.
Download figure:
Standard image High-resolution imageFinally, we present experimental results from LWFAs driven by single FL pulse and dual-color FL and SH laser pulses interacting with helium-nitrogen plasma formed from the mixture of 99.5% helium and 0.5% nitrogen gases. The plasma density in this case was 4 × 1018 cm−3. Figure 9 shows four typical electron energy spectra. We can see that well-collimated, quasi-monoenergetic electron beams with a peak energy at ∼220 MeV ± 3% and a maximum energy of ∼280 MeV ± 5% were produced using single FL laser pulse with the full energy (2.1 J), see figure 9(a) and the black curve in figure 9(e). It is shown that the energies of the electrons are enhanced by a factor of two as compared with those generated from the helium gas jet driven by single FL pulse with the same laser power, at the plasma density of 8 × 1018 cm−3, see figure 8(a) and the black curve in figure 8(e). By using the dual-color LWFA scheme with the SH laser beam having three different polarizations (P-, S-, and C-polarization states) and at a time delay of ∼0 fs at the same density, the maximum energies of the electron beams are further boosted to ∼500 MeV ± 8%, as seen in figures 9(b)-(e). When the SH laser pulses are having P-polarization, figure 9(b) and the blue curve in figure 9(e), most electrons concentrate on the energy lower than 200 MeV, but a handful of electrons have been boosted to the energy of 300–400 MeV. For the S-polarized SH pulses, figure 9(c) and the red curve in figure 9(e), the dual-color LWFA scheme leads to a definite energy enhancement, generating a quasi-monoenergetic bunch with a peak energy of ∼350 MeV ± 5.5% and a maximum energy of ∼400 MeV ± 6.5%. When the SH laser pulses are set to be C-polarized, figure 9(d) and the green curve in figure 9(e), there is also a clear enhancement of the electron energy (the maximum energy reaches ∼530 MeV ± 8.5%), which is different from the results in the case of self-injection regime as shown in figure 8(d) and in green in figure 8(e). According to the experimental results in figure 9, it is clear that when employing a dual-color LWFA scheme, all the SH laser pulses having three different polarizations have the electron energy-boosting capability; the maximum energy gain of the electron beam using C-polarized and S-polarized SH laser pulses is somewhat similar (400–530 MeV), but the energy spectrum is continuous in the former case and quasi-monoenergetic in the latter case; the P-polarized SH pulse has the weakest electron energy-boosting capability, which is different from the simulation results as shown in figure 6(d). Therefore, it can be concluded that the experimental results are basically consistent with the simulation results presented in section 2.4.

Figure 9. Electron energy spectra from LWFA in a helium-nitrogen mixture gas jet target for different experimental conditions. Each spectrum was obtained from accumulation of data on the image plates (IPs) from five laser shots using (a) the full-power FL laser pulse (2.1 J, 800 nm, P-polarization) and (b) to (d) dual-color LWFA scheme with a clipped FL (1.9 J, 800 nm, P- polarization) and SH (0.1 J, 400 nm) laser pulses of various polarizations for the SH pulse at a relative time delay of ∼0 fs. The plasma medium is formed from the gas mixture of 99.5% helium and 0.5% nitrogen, the electron density inferred from interferometry was 4 × 1018 cm−3. The signals shown at the ∞ direction are betatron x-rays emitted by the accelerated electrons as a result of their transverse oscillations in the plasma ions channel. (e) Vertically integrated electron spectra in logarithmic scale for the shots in (a) to (d). The maximum energy here is defined as the electron energy where the charge density of the electron beam is below 0.1 pC MeV−1. The horizontal error bars correspond to the resolution of the spectrometer, which are ±2.5%, ±5%, and ±8% at 150, 300, and 500 MeV, respectively.
Download figure:
Standard image High-resolution image
4. Conclusion
In conclusion, we presented detailed simulations of LWFA driven by spatially and temporally overlapped, co-propagating, 30 fs, dual-color (400 nm and 800 nm) laser pulses in the self-injection and ionization injection regimes, respectively. Results show that electron energies can be enhanced remarkably by fine-tuning the relative time delays between two pulses in the LWFA driven by the dual-color laser pulses in both injection regimes. In the simulations of the self-injection regime, the high-energetic electrons can be generated by two-stage accelerations: subsequent electrons are injected and accelerated in the bubble driven by energetic electrons which are initially self-injected and accelerated by the FL pulse, and then they are continuously accelerated in the wakefield driven by the SH pulse. However, the physical mechanism is different in the ionization injection regime. Due to lower plasma density used in the ionization injection regime compared to the self-injection regime, the SH pulse can only propagate along with the FL pulse to sustain the main wakefield for a longer time, and correspondingly ionization-injected electrons into the bubble driven by the FL pulse receive more acceleration time than those in the LWFA driven by one single FL pulse. Hence, more monoenergetic and higher energy electron bunches are generated in the LWFA driven by dual-color laser pulses in the ionization injection regime. Additionally, simulations show that the LWFA driven by the dual-color laser pulses in the ionization injection regime exhibits a weaker sensitivity to time delay between the two pulses. Lastly, additional experimental results from the dual-color LWFA in both injection regimes are presented.
Acknowledgments
This work was partially supported by the National Basic Research Program of China (Grant No. 2013CBA01500). This work was partially supported by ELI-ALPS project (GINOP-2.3.6-15-2015-00001) which is supported by the European Union and co-financed by the European Regional Development Fund. N. A. M. H. acknowledges President's International Fellowship Initiative (PIFI) of Chinese Academy of Sciences (CAS); International Partnership Program (181231KYSB20170022) of CAS; Inter-Governmental Science and Technology Cooperation of Chinese Ministry of Science and Technology (MOST). We are grateful to the OSIRIS Consortium at UCLA and IST for providing access to the OSIRIS 4.0 framework. Simulations were conducted on the PI supercomputer at the Center for High Performance Computing at SJTU.