
Abstract
Objective. This study aimed to investigate the dosimetric impact of using population-based relative electron density (RED) overrides in lieu of simulation computerized tomography (CT) in a magnetic resonance linear accelerator (MRL) workflow for male pelvis patients. Additionally, the feasibility of using prostate specific membrane antigen positron emission tomography/CT (PSMA-PET/CT) scans to assess patients' eligibility for this proposed workflow was examined. Approach. In this study, 74 male pelvis patients treated on an Elekta Unity 1.5 T MRL were retrospectively selected. The patients' individual RED values for 8 organs of interest were extracted from their simulation-CT images to establish population-based RED values. These values were used to generate individual (IndD) and population-based (PopD) RED dose plans, representing current and proposed MRL workflows, respectively. Lastly, this study compared RED values obtained from CT and PET-CT scanners in a phantom and a subset of patients. Results. Population-based RED values were mostly within two standard deviations of ICRU Report 46 values. PopD plans were comparable to IndD plans, with the average %difference magnitudes of 0.5%, 0.6%, and 0.6% for mean dose (all organs), D0.1cm3 (non-target organs) and D95%/D98% (target organs), respectively. Both phantom and patient PET-CT derived RED values had high agreement with corresponding CT-derived values, with correlation coefficients ≥ 0.9. Significance. Population-based RED values were considered suitable in a simulation-free MRL treatment workflow. Utilizing these RED values resulted in similar dosimetric uncertainties as per the current workflow. Initial findings also suggested that PET-CT scans may be used to assess prospective patients' eligibility for the proposed workflow. Future investigations will evaluate the clinical feasibility of implementing this workflow for prospective patients in the clinical setting. This is aimed to reduce patient burden during radiotherapy and increase department efficiencies.
Export citation and abstract BibTeX RIS

Original content from this work may be used under the terms of the Creative Commons Attribution 4.0 licence. Any further distribution of this work must maintain attribution to the author(s) and the title of the work, journal citation and DOI.
1. Introduction
Modern radiotherapy treatment planning (RTP) is highly dependent on computerized tomography (CT) simulation imaging for many aspects of the RTP workflow. This includes for delineating contours, providing the necessary relative electron density (RED) information, and generating the treatment plan. In recent years, the concept of using magnetic resonance imaging (MRI) only planning for such purposes has been a topic of significant interest (Kim et al 2015, Tenhunen et al 2018, Choi et al 2019, Liu et al 2022, O'Connor et al 2022). MRI-only planning can be advantageous for several reasons which include minimizing the delivered radiation dose to a patient, providing enhanced soft tissue contrast in images compared to CT, and avoiding errors in multimodality registration (Kim et al 2015, Tyagi et al 2020, Rammohan et al 2022). However, a main limitation associated with this workflow includes that the RED values required for dose calculations cannot be directly obtained from the MR-images (Kim et al 2015, Prior et al 2016, 2017).
To overcome this limitation, it has been proposed that a patient's pre-existing diagnostic scan is used in lieu of the simulation-CT. Examples include using diagnostic-CTs or prostate specific membrane antigen positron emission tomography CTs (PSMA-PET/CT) for contouring and/or extracting the RED information (Zschaeck et al 2018, Zamboglou et al 2019, Wong et al 2021, Thorwarth 2022). Alternatively, many groups have investigated the potential of pseudo-CTs (or synthetic-CTs) (O'Connor et al 2021, Rammohan et al 2022). Different pseudo-CT generation methods have been described in the literature (Kim et al 2015, Prior et al 2017, Arabi et al 2018, Hsu et al 2018, Wong et al 2021, O'Connor et al 2022, Palmér et al 2022). One promising method includes the use of a bulk RED override to a selected organ or region (Kim et al 2015, Prior et al 2016, 2017, O'Connor et al 2022). This method is currently incorporated into some MR guided radiation therapy (MRgRT) workflows (Winkel et al 2019).
Briefly, MRgRT systems comprise of an MRI scanner coupled to a linear accelerator (MR-linac or MRL). Previous literature has described the key benefits and adaptive radiotherapy (ART) workflows of these systems (Winkel et al 2019, de Leon et al 2022, Pham et al 2022, Rammohan et al 2022). The bulk RED override step of this workflow occurs when the voxelised CT-numbers, provided by the individual patient's simulation-CT images, are converted to an average RED value for each contoured organ (Tang et al 2022). These values are often the primary driver of dose calculation differences between tissue types and are propagated throughout the ART workflow, which includes contour adjustment or re-generation based on daily MR-images. This mitigates the consequential effects of using multi-modal image registration (Kim et al 2015, Hsu et al 2018, Choi et al 2019, Liu et al 2022).
Recent studies have reported on the dosimetric impact of using bulk RED overrides on MRL systems (Ding et al 2022, Green et al 2019, Pham et al 2022, Tang et al 2022). Due to the presence of the magnetic field, investigating these effects in such systems are of particular interest, especially near tissue-air boundaries which are subject to the electron return effect by the Lorentz force (Uilkema et al 2015, Green et al 2019, Pham et al 2022, Rammohan et al 2022). An investigation by Ding et al (2022) reported that there was good agreement of the dose distribution between using simulation-CT RED values and bulk RED overrides for 1.5 T MRL nasopharyngeal carcinoma patients (gamma pass rate (3%/3 mm) = 97.81%) (Ding et al 2022); in higher agreement than that using the RED values from the ICRU Report 46 or a homogeneous override.
One potential method for a male pelvis MR-only MRgRT workflow involves contouring/planning on the patients diagnostic PSMA-PET/CT and utilizing a population-based RED override. To the best of the authors knowledge, the use of a population-based RED override has only been investigated for standard linac patients in the past (Hsu et al 2018). For example, Hsu et al (2018) found that using a population-based RED override had higher dosimetric accuracy compared to using RED values from the ICRU Report 46 (PTV D99.9% dose differences to simulation-CT plans < |2.1|%) (Hsu et al 2018).
This study aimed to determine population-based RED values for male pelvis patients previously treated on a 1.5 T 7 MV Unity MRL (Elekta AB, Stockholm, Sweden). This was followed by an evaluation of dosimetric uncertainties introduced by utilizing the population-based RED values, compared to the currently implemented bulk RED override method. Lastly, phantom and patient-specific RED values acquired using both PET-CT and CT-scanners were compared. This was to assess if PSMA-PET/CT scans could additionally be used to screen patients' RED values to assess their eligibility for the proposed workflow.
2. Methods
2.1. Patient cohort selection
A total of 74 male pelvis patients treated on the department's Elekta Unity MRL between 2020 and 2022 were retrospectively selected for investigation in this study. The average age of these patients was 71 years old (with a range of 50–88 years old), and the average body mass index (BMI) was 27.2 (with a BMI range of 18.6–37.4). All patients had previously provided informed consent for their data to be utilized in prospective studies within the department. Specifically, patients included those previously treated for prostate, prostate bed only, or prostate bed and lymph nodes. Male pelvis patients who present to our radiotherapy department typically have undergone a PSMA-PET/CT scan as part of their standard diagnosis pathway.
Once referred for MRL treatment, these patients receive a simulation-MRI on the Unity MRL Marlin 1.5 T MRI scanner (Philips Healthcare, Best, Netherlands) and simulation-CT on a Somatom Definition AS CT scanner (Siemens Healthineers, Erlangen, Germany); both acquired on the same day and setup in the treatment position. Once obtained, these images are exported to the Monaco treatment planning system (TPS) (Elekta AB, Stockholm, Sweden) for contouring and planning.
2.2. Determining population-based RED values
Each patient's individual RED values for each contoured organ used for their treatments were extracted using an inhouse-developed Python script. Selected organs of interest included the bowel, sigmoid colon, rectum, patient outline, clinical/gross/planning tumour volumes (CTV/GTV/PTV), bladder, femurs (left and right), bone, arteries, nerves, pelvic lymph nodes (LN), penile bulb and urethra. If non-standardised organ nomenclature were used, these organs went undetected by the script and thus were not included in the analysis.
Additionally, individual patient RED values were excluded from analysis if any of the following were detected during a visual assessment of their simulation-CT images and contours: any anatomical modifications (e.g. prosthetic implants), if the GTV structure overlapped with another anatomy (e.g. in bone), if large amounts of air invaded the organ (e.g. for rectum), or if the anatomy in the simulation-CT image was subject to significant image distortions.
For the datasets remaining, a mean population-based RED value and corresponding standard deviation (SD) between patients for each organ was computed. The minimum, maximum (and corresponding % differences) for each organ were also calculated to determine the magnitude of the largest deviating individual RED values from the population average. The average was then compared to the RED values stated in the ICRU Report 46 (International Commission on Radiation Units and Measurements 1992). This comparison required first converting the ICRU electron density (ED) values to an RED; achieved by dividing the ED for each tissue type by the ED of water (3340 m−3 × 1026) (International Commission on Radiation Units and Measurements 1992). Then, a piecewise linear interpolation of the TPS CT-to-ED curve was used to estimate the corresponding ICRU expected Hounsfield Units (HU).
2.3. Dosimetric impact of RED value assignment
This part of the study aimed to determine if the dosimetric error introduced by using a population-based RED assignment was comparable to that of using a patient's individual bulk RED assignment, as per the current Unity adaptive workflow. This assessment was conducted on a sub-cohort of patients representing the minimum and maximum RED value deviations from the population-mean for the most relevant organs (e.g. rectum, patient outline, GTV, femurs, and bone). These specific patients were considered worst-case scenarios and were selected to further validate the appropriateness of using the derived population-based RED values. Two new plans for each of these patients was generated offline in the TPS:
- I.Individual-RED dose (IndD) plan: generated using each patient's bulk individual-RED values, as derived from their simulation-CT (current workflow).
- II.Population-based RED dose (PopD) plan: generated using a forced override of the derived population-based RED values (proposed workflow).
Organs such as the arteries, nerves, lymph nodes, penile bulb and urethra were deemed to have especially small volumes, with probable negligible consequences during planning. These were excluded from the remainder of analysis. Other structures such as air, calcifications, and clips, were also excluded as their RED values were already established by the departments planning guidelines.
2.4. Statistical analysis of dosimetric impact
The patient's simulation-CT reference Dose (CTD), IndD and PopD plans were all exported to MIM (MIM Software Inc., Cleveland, USA) for quantitative analysis. Note that the CTD is generated in Monaco as part of the standard Unity workflow and utilizes a patient's voxelated simulation-CT derived RED values. MIM was then used to compare the dose–volume histogram (DVH) statistics between the three plans. These included the dose to 0.1 cm3 (D0.1cm 3) and mean dose (Dmean) for all relevant organs, as well as the D95% and D98% for target organs.
Percentage differences between the following doses, recorded for each organ, were calculated for each statistical parameter utilizing the second term in each case as the reference. Note: Averages in both absolute % differences and bias (which retains positive/negative dose deviations) were calculated for each organ/statistical parameter.
- I.IndD and CTD: representing the loss of the calculation accuracy inherent to the current standard MRL workflow.
- II.PopD and CTD: representing the loss of the calculation accuracy in the proposed MRL workflow under test.
- III.PopD and IndD: representing the loss of calculation accuracy by using the proposed MRL workflow compared to the current standard workflow.
2.5. Using PSMA-PET/CT scans for simulation-free workflow eligibility testing
The final aspect of this study examined a potential method for determining the eligibility of prospective MRL patients for the proposed population-based RED override workflow. This involved comparing RED values derived from phantom and patient PET-CT and CT scans. It was hypothesised that the individual RED values extracted from a patient's PET-CT scan could assist in identifying abnormal structure RED values; indicating a patient may not be suitable for the proposed workflow.
Firstly, an electron density phantom (Model 062M, CIRS, Virgina, USA) was imaged on two PET-CT scanners at the nuclear medicine department of St Vincent's Public Hospital (Sydney, Australia). Scanners included the Ingenuity TF (Philips Healthcare, Best, Netherlands) and Biograph64 Vision 600 (Siemens Healthineers, MAGNETOM Skyra, Erlangen, Germany). For the Ingenuity PET-CT scanner, two scans were acquired using a typical (80 kg) and a high-end (120 kg) patient weight. The same phantom was then scanned on the radiotherapy dedicated Somatom Definition AS CT scanner.
Following scanning, the HU/RED values of 16 same-sized regions of interest (ROIs) in the phantom were manually extracted using Monaco. These ROIs contained the plugs embedded within the phantom which have vendor established RED values. The HU values from each corresponding ROI were compared using a correlation coefficient (ρ) between those obtained using the CT-scanner and each PET-CT scanner.
For the patient-based assessment, a subset of six patients with retrospective diagnostic PSMA/PET-CT scans available were selected. The relevant organs were contoured on the PET-CT scans and the HU for each structure was extracted and converted to RED values using the Monaco TPS CT-to-ED curve. The RED values obtained from the patient's simulation-CT (used for treatment) and diagnostic PET-CT were statistically compared (ρ) for each organ.
3. Results
3.1. Assessing population-based RED values
Table 1 reports the number of patients included in the population-based RED value average for each organ, out of the 74 patients selected for analysis. As shown in figure 1, the following contours were excluded from the analysis: bone contours in 4 patients and femur contours in 2 patients all presenting with metal implants, bladder contours in 2 patients due to image artefacts, rectum contour in 1 patient due to a significant amount of air, and GTV contour in 1 patient due to an overlap with bone.
Table 1. ICRU Report 46 (where available) and derived population-based RED values for organs of interest. The corresponding CT numbers (in Hounsfield Units—HU) are also shown and made use of the TPS CT-to-ED curve. The number of patients reported represents the number of non-excluded patients with RED values that were successfully extracted from the TPS. Structures with population-based average values ± 1, 2 or > 2 standard deviations (SD) being within to the ICRU values were identified using the following key: †,††, and †††, respectively.
| Tissue classification | ICRU Structure | ICRU RED (and HU) | Structure | Population average RED ± 1 × SD (and HU) | Number of patients |
|---|---|---|---|---|---|
| Gastro-intestinal (with air pockets) | Bowel loops | 1.024 (10) | Bowel††† | 0.947 ± 0.021 (−68) | 12 |
| Sigmoid colon† | 0.971 ± 0.069 (−38) | 32 | |||
| Rectum† | 0.986 ± 0.060 (−20) | 65 | |||
| Muscle and Residual Organs | Average soft tissue (male) | 1.024 (10) | Patient††† | 0.981 ± 0.012 (−26) | 66 |
| CTV† | 1.035 ± 0.018 (16) | 63 | |||
| GTV† | 1.033 ± 0.037 (15) | 39 | |||
| Urinary bladder (filled) | 1.027 (12) | Bladder† | 1.017 ± 0.010 (6) | 66 | |
| Bone | Skeleton-femur (Av-60yo)a | 1.231 (381) | Femurs (left and right combined)†† | 1.185 ± 0.029 (322) | 60 |
| Skeleton- sacrum (whole-male) | 1.246 (400) | Bone†† | 1.199 ± 0.029 (340) | 69 | |
| Negligible size structures | Blood | 1.051 (35) | Arteries†† | 1.027 ± 0.013 (12) | 11 |
| — | — | Nerves | 1.027 ± 0.019 (12) | 25 | |
| — | — | Pelvic Lymph Node | 0.997 ± 0.014 (−7) | 8 | |
| — | — | Penile Bulb | 1.051 ± 0.003 (35) | 49 | |
| — | — | Urethra | 1.052 ± 0.005 (38) | 24 |
a Note that the skeleton-femur ICRU Report values were interpolated from the average of the two femur electron density values derived from 30- and 90 year old (yo) men; giving a closer age approximation of the patient cohort used in the dosimetric investigation part of this study (average population age = 71).

Figure 1. Individual-RED values for each organ, presented as a box and whisker plot with relevant interquartile ranges shown. Cases in red were excluded from the population-based RED value average following visual assessment of the simulation-CT images and overlaid contours. Note that femurs included both left and right (LR) femurs combined.
Download figure:
Standard image High-resolution imageAlongside the data presented in table 1 is the ICRU Report 46 RED (and calculated HU) values for structures corresponding to similar organ classes, where available. Results indicated that the population-based average RED values (±1 × SD) derived for sigmoid, rectum, bladder, and targets (CTV/GTV), matched the corresponding ICRU Report 46 tissue RED values. Considering the population average ±2 × SD, organ RED values then matched the ICRU Report for arteries, femurs and bone. However, bowel and patient outline RED values remained slightly below the corresponding ICRU Report values.
Table 2 presents the %difference results of the individual versus population-based RED values for the 8 relevant organs of interest. This corresponded to 8 minimum and 8 maximum RED value cases, derived from 14 patients. Minimum and maximum organ RED values were found to vary by ≤8.8% of the population average for solid soft tissues (GTV, bladder, patient outline, muscle), and ≤7.7% for bony organs. Hollow organs (rectum and sigmoid colon) had much larger variability of up to −20.5%. Bowel had %differences of up to only −4.1%. Given the overall close proximity of the population-based RED values to the ICRU Report values, and the small %differences for most identified worst cases, the population-based RED values were deemed adequate and were utilized for the remaining evaluations in this study.
Table 2. Minimum (min) and maximum (max) individual RED values recorded in the patient cohort for each organ of interest, and their corresponding %differences to the population-based average. Each case referred to a different patient, excluding cases 13 and 15, and 14 and 16, which were derived from the same patients, respectively. This resulted in the 16 worst-case organ RED values being derived from 14 patient datasets.
| Case number | Structure | Metric | Individual RED | %Difference to population RED average (%) |
|---|---|---|---|---|
| 1 | Bowel | Min | 0.909 | −4.1 |
| 2 | Bowel | Max | 0.976 | 3.1 |
| 3 | Sigmoid | Min | 0.773 | −20.4 |
| 4 | Sigmoid | Max | 1.039 | 7.0 |
| 5 | Rectum | Min | 0.784 | −20.5 |
| 6 | Rectum | Max | 1.052 | 6.6 |
| 7 | Patient | Min | 0.960 | −2.1 |
| 8 | Patient | Max | 1.018 | 3.8 |
| 9 | GTV | Min | 0.942 | −8.8 |
| 10 | GTV | Max | 1.058 | 2.4 |
| 11 | Bladder | Min | 1.006 | −1.2 |
| 12 | Bladder | Max | 1.046 | 2.8 |
| 13 | Femurs | Min | 1.137 | −4.0 |
| 14 | Femurs | Max | 1.276 | 7.7 |
| 15 | Bone | Min | 1.141 | −4.8 |
| 16 | Bone | Max | 1.276 | 6.4 |
3.2. Dosimetric impact of RED value assignment
The 14 patients identified in table 2 received MRL radiotherapy treatment for prostate cancer (9) and prostate-bed cancer (5, including 1 with prostate bed and node). The average age and BMIs of this patient cohort was 71 years old (with a range of 59–88 years old) and 26.7 (with a BMI range of 18.6–35.2), and they received treatment regimens averaging 62.6 Gy (with a range of 40–88 Gy). Of these patients, 11 received a traditional long course fractionation (≥20 fractions), while 3 received stereotactic ablative radiotherapy (SABR) treatment (≥40 Gy in 5 fractions).
Figure 2 shows the %differences in DVH statistics for relevant organs between the three plans. This figure highlights that introducing an individual or population RED override resulted in a deviation in dose from the CTD. As the CTD plan is never delivered in an MRL workflow, a focus was placed on the PopD versus IndD results. The differences in DVH statistics for each organ between these two plans are provided in table 3. A summary of the average of these statistics have been provided in table 4, along with the corresponding average values for IndD versus CTD, and PopD versus CTD. This table highlights that slightly larger mean |%differences| were observed for PopD versus CTD, compared to IndD versus CTD.
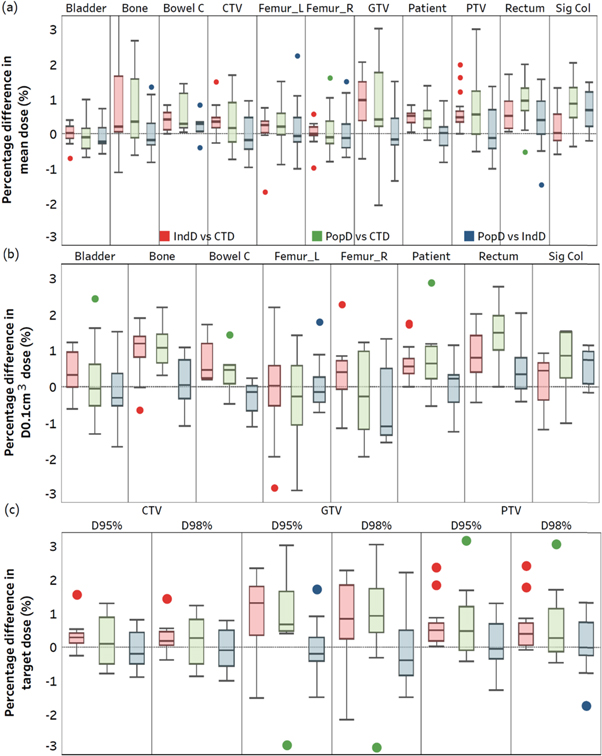
Figure 2. Box and Whisker plots highlighting the %differences in Dmean (a), D0.1cm 3 (b) and D95/D98% (c) for all relevant organs and target structures between the 14 identified worst-case patients. The individual RED derived dose (IndD) versus simulation-CT dose (CTD) is shown, along with the population-based RED dose (PopD) versus CTD, and PopD versus IndD. In each case, the second term was used as the reference. Note that the whiskers for each dataset extended to data points within 1.5 times the interquartile range, and the remaining datapoints displayed were outside of this range. Additionally, Bowel C and Sig Col have been shortened from Bowel Cavity and Sigmoid Colon, respectively.
Download figure:
Standard image High-resolution imageTable 3. Average absolute %differences in dose between population (PopD) and individual (IndD) dose plans for DVH statistics including D0.1cm 3, Dmean, D95% and D98% for relevant organs. This represents the change in accuracy of the proposed workflow, compared to the current MRL workflow. The values in parentheses () show the bias in dose and those in brackets [minimum to maximum] identify the full range of values found for each calculated statistic, over the selected patient cohort.
| Tissue type | Structure | D0.1cm 3 (%) | Dmean (%) | D95% (Targets) (%) | D98% (Targets) (%) |
|---|---|---|---|---|---|
| Target | GTV | 0.5 ± 0.5 (+0.1) [−1.1 to 1.6] | 0.6 ± 0.5 (−0.1) [−1.3 to 1.5] | 0.6 ± 0.5 (−0.1) [−1.5 to 1.7] | 0.9 ± 0.5 (0.0) [−1.5 to 2.2] |
| CTV | 0.5 ± 0.3 (0.0) [−1.2 to 1.1] | 0.5 ± 0.3 (0.0) [−1.0 to 1.0] | 0.5 ± 0.2 (−0.1) [−0.9 to 0.8] | 0.5 ± 0.2 (−0.1) [−1 to 0.8] | |
| PTV | 0.5 ± 0.4 (0.0) [−1.2 to 1.2] | 0.5 ± 0.4 (+0.1) [−1.0 to 1.4] | 0.6 ± 0.4 (+0.1) [−1.3 to 1.3] | 0.6 ± 0.5 (+0.1) [−1.7 to 1.3] | |
| Soft (Non-target) | Bladder | 0.7 ± 0.5 (−0.1) [−1.7 to 1.5] | 0.4 ± 0.2 (−0.1) [−0.6 to 0.7] | — | — |
| Bowel | 0.4 ± 0.4 (−0.3) [−1.1 to 0.2%] | 0.4 ± 0.3% (+0.2) [−0.4 to 0.8] | — | — | |
| Patient | 0.5± 0.4 (0.0) [−1.2 to 1.1] | 0.3 ± 0.3 (0.0) [−0.8 to 1.0] | — | — | |
| Sigmoid colon | 0.6 ± 0.4 (+0.6) [−0.2 to 1.1] | 0.7 ± 0.5 (+0.7) [−0.2 to 1.5] | — | — | |
| Rectum | 0.6 ± 0.6 (+0.5) [−0.4 to 2.0] | 0.7 ± 0.5 (+0.4) [−1.5 to 1.6] | — | — | |
| Bony (Non-target) | Bone | 0.6 ± 0.3 (+0.1) [−1.1 to 1.1] | 0.5 ± 0.4% (0.0) [−0.8 to 1.4%] | — | — |
| Femur- left | 0.5 ± 0.4 (0.0) [−0.7 to 1.8] | 0.5 ± 0.6 (+0.1) [−1.0 to 2.3] | — | — | |
| Femur- right | 1.1 ± 0.3 (−0.5) [−1.5 to 1.3] | 0.5 ± 0.4 (+0.1) [−0.7 to 1.5] | — | — |
Table 4. %Differences in dose for key DVH statistics measured between the three plan combinations tested: individualised dose (IndD) and CT (CTD), population dose (PopD) and CTD, and PopD versus IndD, for the relevant organs identified.
| DVH statistic | IndD versus CTD | PopD versus CTD | PopD versus IndD | |
|---|---|---|---|---|
| Absolute average %difference in DVH statistics (and bias) [range: min to max] (%) | D0.1cm 3 (Non-targets) | 0.8 ± 0.5 (0.5) [−2.8 to 2.3] | 1.0 ± 0.6 (0.5) [−2.9 to 4.0] | 0.6 ± 0.4 (0.0) [−1.7 to 2.1] |
| Dmean (All organs) | 0.5 ± 0.4 (0.4) [−1.7 to 3.5] | 0.7 ± 0.6 (0.5) [−2.1 to 3.0] | 0.5 ± 0.4 (+0.1) [−1.5 to 2.3] | |
| D95% (Targets) | 0.7 ± 0.5 (0.6) [−1.5 to 2.4] | 1.0 ± 0.7 (0.6) [−2.9 to 3.2] | 0.6 ± 0.4 (0.0) [−1.5 to 1.7] | |
| D98% (Targets) | 0.7 ± 0.6 (0.5) [−2.2 to 2.4] | 0.9 ± 0.7 (0.5) [−3.0 to 3.0] | 0.7 ± 0.4 (0.0) [−1.7 to 2.2] |
Specifically regarding PTV coverage, PopD when compared to the CTD and IndD had a +0.6% and +0.1% bias respectively, when computed over all applicable statistics (Dmean, D95% and D98%). Additionally, the largest underdosed DVH statistic reported for the PTV was −1.7% for the D98% PopD versus IndD (which can be observed in figure 2).
It was also found that the largest density differences identified in table 2 did not always correspond to the largest dose differences observed in PopD versus IndD results for each organ. For example, case 5 reported the greatest %difference in rectum individual RED versus population-based RED (−20.5%). However, for this patient, the absolute dose differences between PopD versus IndD plans for rectum Dmean and D0.1cm 3 was 0.2% and 0.1%, respectfully; much less than the average %differences observed over all patients (average Dmean and D0.1cm 3 = 0.7% and 0.6%, respectively).
3.3. Assessing proposed workflow eligibility using PSMA/PET-CT scans
3.3.1. Phantom validation
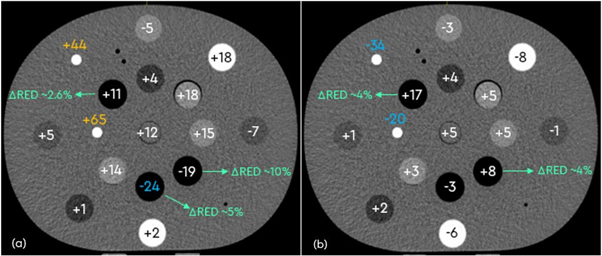
The phantom ROI HU values derived from each PET-CT scanner significantly correlated (ρ > 0.99) to those obtained using the simulation-CT scanner (figure 3). The largest deviation was found for ROIs which contained dense bone inserts, which measured a difference in HU (∆HU) of up to +65 for the Ingenuity scanner, and −34 for the Biograph64 Vision scanner.
Figure 3. Differences (∆) in phantom HU values measured between the 80 kg PET-CT Phillips (a) and Siemens (b) scanners and the simulation-CT scans. Corresponding RED values are indicated for the low-density lung inserts. Potential ∆HU values of concern are indicated in blue and yellow (largest), depending on the magnitude of difference measured. The largest deviations from the CT values were found for the dense bone ROIs for both scanners.
Download figure:
Standard image High-resolution image
Altering the patient weight input on the Ingenuity PET-CT was found to have minimal impact on the HU values measured (ρ > 0.99). Excluding the dense bone inserts, the average ∆HU magnitude between the different weighted scans was 1.9 ± 1.8 HU. In the case of the dense bone inserts, this was measured to be up to ± 25 HU. Applying the existing CT to ED TPS calibration curve to the phantom PET-CT scan yielded the RED values in agreement (within 1.5%) with the values obtained from the CT-simulation scan, except for the low-density inserts of lung exhale (up to +5.3%) and lung inhale (up to +10.3%) (figure 3).
3.3.2. Patient-based RED value comparison
Overall, there was a high correlation (ρ = 0.94) between the patients' individual RED values derived using the PET-CT scanners and CT-simulation scanner. Quantitatively, this was true for bone, femurs, CTV, and patient structures with absolute %difference measured being less than 1.8%, 2.2%, 1.3%, and 1.7%, respectively. Bladder and rectum organs varied by a magnitude of up to 4.0% and 30.0%, respectively. Removing the rectum from analysis resulted in a higher correlation (ρ = 0.99). Results suggested that the PSMA/PET-CT scans could be used to verify potential outlying patient structures. This was with the exception of rectum and bladder, whereby the different pre-scan filling requirements for the patient vary significantly between imaging modalities.
4. Discussion
The Unity MRL system is amenable to simulation-free workflows; currently utilizing bulk RED overrides for planning and involving daily re-contouring and re-planning based on the anatomy of the day (Winkel et al 2019, Ding et al 2022). To implement a simulation-free workflow, the RED values of patients' organs are required to be either known or estimated (Choi et al 2019, Liu et al 2022, Pham et al 2022). This study thus examined the potential of simulation-free male pelvis radiotherapy treatment on a Unity system using a population-based RED override and eligibility screening using PSMA/PET-CT scans.
In this work, a set of population-based RED values were first calculated using the retrospective data from a male pelvis cohort (n = 74) treated on a Unity MRL. The derived RED (and HU) values were comparable to established literature (International Commission on Radiation Units and Measurements 1992, Hsu et al 2018, Choi et al 2019, Wong et al 2021, O'Connor et al 2022), allowing for the population-based values to be considered adequate for integration into a simulation-free workflow. For example, Choi et al (2019) reported RED values of 1.17, 1.03 and 0.97 for bone, muscle (including bladder) and entire tissue (Choi et al 2019). In comparison, the derived population-based values for the same tissue types in this study were similar at 1.20, 1.02, and 0.98, respectively.
Furthermore, a comparison of the population-based RED values with the ICRU Report 46, found that the derived RED values of almost all organs of interest matched the Report (within 2 × SDs) (table 1) (International Commission on Radiation Units and Measurements 1992). Organs known to have variable amounts of air within, such as the bowel and patient outline, were undervalued compared to the ICRU Report. Differences in RED values was also observed between the patients included in this study, which could be attributed to several factors.
These factors include patient-specific variability due to each patient's unique anatomy and organ compositions, and potential contouring variability between radiation therapists, which could lead to different amounts of air being included within specific contours. For example, the rectum and sigmoid colon recorded the largest individual patient RED value deviations from the population-based average (% differences of up to −20.5%) (table 2). Additionally, technical factors related to the departments CT scanner could have introduced variability if different scan parameters or reconstruction algorithms were employed between patients. The impact of these factors was not explored in this study but should be considered for future investigations.
One limitation of this work is that some organ RED values went either unrecorded or were excluded from analysis. To enhance this work, it is recommended that all future treatments adopt standard organ nomenclature. This is supplementary to revising retrospective nomenclature for the current patient cohort and validating the population average. Additionally, population-based RED values could be established for sub-cohorts of patients, such as for different BMIs or age groups. For instance, previous studies have highlighted that the RED of bone varies with age (International Commission on Radiation Units and Measurements 1992, Zeinali-Rafsanjani et al 2018). This type of future work would be best conducted using a multicentre approach to ensure incorporation of diversity and a large patient sample size.
The second component of the study examined the dosimetric impact of different bulk density assignment methods; focusing on the patient sub-cohort with the greatest variation in individual RED values. Findings indicated that using a bulk density override of the patient's individual RED values introduced average DVH % differences of ≤0.8%, compared to the CTD (table 4). This is less than that reported in previous literature for pelvis treatment planning, where a single homogeneous RED assignment resulted in up to ±5% differences (Lee et al 2003, Chen et al 2004, Korsholm et al 2014, Kim et al 2015, Prior et al 2016, Arabi et al 2018, Hsu et al 2018). However, increasing the number of organs (or tissue segments) assigned different bulk RED values has been reported to reduce dose differences compared to the simulation-CT plan (Lee et al 2003, Chen et al 2004, Hsu et al 2018, Johnstone et al 2018).
This study also observed that DVH %differences between PopD versus CTD were slightly larger (by 0.2%–0.3%) than those between IndD versus CTD. For the PopD versus CTD results, the average DVH %differences were ≤1.0% for target Dmean, D95%, and D98% (table 4), which is higher than the differences of 0.2% reported by Hsu et al (2018). Dose differences between the three plans stem from variations in the underlying patient models used in their dose calculations. These calculations rely on look-up tables to assign dose deposition parameters (e.g. stopping powers and attenuation coefficients), based on the tissues RED values. Thus, when RED values are assigned to specific tissues that differ from the ground truth (i.e. the voxelated CT derived RED values), differences in tissue dose between the plans was expected.
As MRL workflows do not involve delivering the CTD plan to the patient, a focus was placed on comparing dose differences between PopD and IndD (proposed versus current workflow). The results in table 4 showed that the proposed workflow resulted in minor changes in dose accuracy, with average % differences of 0.5%, 0.6%, and 0.6%/0.7% for Dmean (all organs), D0.1cm 3 (non-targets), and D95%/D98% (targets), respectively. Korsholm et al (2014) proposed that clinical acceptance of a plan would be allowed if PTV coverage was within 2% of the CTD (Korsholm et al 2014). Given the PopD PTV coverage when compared to either the CTD or IndD was always > −1.7% (figure 2), the results suggested clinical acceptance of the PopD plans. These results were further confirmed by a radiation oncologist.
Despite the observed dose deviations when utilizing a population-based RED override, the advantages of an MRL compared to conventional linac systems are likely to justify these deviations. Key benefits include enhanced daily structure delineation and daily replanning and monitoring intra-fraction organ motion. These enhancements can collectively contribute to improved treatment outcomes (Ding et al 2022, Pham et al 2022, Rammohan et al 2022). Overall findings from this study suggested that the proposed simulation-free workflow is a feasible and accurate alternative compared to current MRL treatments. To ensure accuracy for prospective patients, a screening method using the patient's PSMA/PET-CT scan to observe large RED value variability from the population-based average was considered. The last part of this study assessed the reliability of such a screening method.
The inter-scanner phantom results showed a strong agreement (ρ > 0.99) between HU (and thus RED) values obtained from the simulation-CT and both PET-CT scanners. Quantitatively, for non-lung tissue inserts, there was a <10% RED difference between ROI values. The use of different weighted scans on the Phillips PET-CT scanner introduced minimal variability, except for dense bone inserts which had variability magnitudes of up to ±25 HU. However, the effect of different weighted scans may be more pronounced in a patient, so it should be considered in future investigations.
The inter-scanner retrospective patient results also showed significant agreement (ρ = 0.94) of the RED values obtained on the simulation-CT and PET-CT scanners. Percentage differences between the scans were ≤2.2% for all organs, except for the bladder and rectum (% differences of up to 4% and 30.0%, respectively). This was likely attributed to differences in bladder and bowel preparation that the patients would have undertaken before each respective scan. Similar findings were reported by Wong et al (2021) when investigating HU variability and consequential dose differences (within ±2.5%) between diagnostic and simulation-CT derived plans for proposed simulation-free radiotherapy (Wong et al 2021).
Considering that patients often receive diagnostic scans at institutions external to the radiotherapy department, conducting consistent quality assurance checks on all scanners for ensuring accurate RED values becomes impractical (Thorwarth 2022). This, additionally to the unknown impact of different contrast agents on RED values, necessitates further investigation outside of the scope of this work. These considerations led to the adoption of a population-based RED override in the proposed simulation-free workflow, rather than directly extracting the RED from the PSMA-PET/CT images. Overall, findings from the inter-scanner phantom and patient investigation were encouraging, with potential to identify anomalous tissue densities and thus determine patients who may need to be excluded from the proposed workflow.
It is acknowledged that this simulation-free workflow may not be scalable to patients with other treatment indications if they do not receive diagnostic PSMA-PET/CT scans as part of their diagnostic pathway. However, findings from this study have the potential to be applied to other imaging modalities, such as diagnostic CT. Future work will involve demonstrating the feasibility of contouring and planning on the PSMA-PET/CT scans. This work is being carried out simultaneously by RTs in our department, in preparation for direct implementation into the proposed simulation-free workflow.
The proposed simulation-free MRL treatment planning workflow, which utilizes population-based RED overrides and diagnostic PSMA-PET/CT scans, yielded promising results in this pioneering study. Implementing this workflow can reduce patient burden and the amount of radiation dose the patient receives (Wong et al 2021, Persson et al 2023). It can also improve department efficiencies by releasing machine and staffing resources (Keyriläinen et al 2021, Wong et al 2021, Persson et al 2023). The next stage of this study will evaluate the feasibility of implementing the proposed workflow clinically for SABR prostate patients. This will include the practical and economic considerations for incorporating the workflow into a busy clinical department.
5. Conclusions
This study reports on the first physics validation of simulation-free MRL treatment using a population-based RED override and diagnostic PSMA/PET-CT scan. The population-based RED values derived were found to be adequate and comparable to existing literature. Implementing the population-based overrides into the MRL workflow introduced inaccuracies of similar magnitude to those present in the current workflow (PopD Dmean > IndD Dmean by 0.5%). Significant correlation (ρ ≥ 0.94) in the phantom and patient RED values derived using CT and PSMA-PET/CT scanners was observed, suggesting the use of the latter scan to determine prospective patient eligibility to the proposed workflow. The future direction of this work will test the feasibility of clinical implementation of this workflow, which aims to reduce patient burden and improve department efficiencies.
Acknowledgments
GenesisCare and Elekta AB (Stockholm, Sweden) have a strategic research agreement which includes financial support relating to the presented work.
Data availability statement
The data cannot be made publicly available upon publication because they contain sensitive personal information. The data that support the findings of this study are available upon reasonable request from the authors.
Ethical statement
This research included a retrospective analysis of patient data which was collected during their standard clinical treatments. The research was conducted in accordance with the principles embodied in the Declaration of Helsinki and in accordance with local statutory requirements. The ethics governing this project includes the 2022/ETH00247 GenesisCare Oncology Outcomes Project (GCOP). It should also be noted that this ethics approval covered patients to participate in the study and any publications that derived from the study.