

Abstract
Objective. In cities situated at high-altitude, the measured x-ray spectra are required to calculate the absorbed dose to water in radiobiology and medical dosimetry because of the air-density effect. This work aims to measure, in a high-altitude city, a set of x-ray spectra from an x-ray tube with tungsten anode generated at potentials of the M-series x-ray beams from NIST in the range of 20 and 150 kV as well as other beam qualities that have been characterized and used for dosimetry study in our group called W-series. To also measure some spectra of mammography interest in the energy range of 25 and 35 kV using additional filtration of rhodium (Rh), molybdenum (Mo) and silver (Ag). Approach. A tungsten anode x-ray tube with potential between 10 to and 160 kV was used. A high-purity germanium (HPGe) detector associated with a DSPEC Jr 2.0TM digital signal processing module has been used for the spectra measurements. Prior the spectra measurements, the HPGe detector has been characterized and calibrated using several radioactive sources. Main results. The M80 spectrum was compared to a mathematically filtered beam from Physicalisch Technische Bundesanstalt corresponding to the same potential finding a difference of 0.7% in the average energy. So, the mathematically filtered beam from PTB matches very well our M80 beam. The beams M80, M100 and M120 were also compared with calculations for the corresponding kilovoltage from an executable that calculates x-ray spectra from tungsten anode x-ray tubes in the energy range between 40 to 300 kV called SpekCalc. The SpekCalc reproduces qualitatively the experimental spectra, but not quantitatively, mainly for M100 and M120 beams. Significance. These spectra can be used to simulate the patient dose as well as image quality using Monte Carlo (MC) codes or to evaluate the absorbed dose in dosimetry studies
Export citation and abstract BibTeX RIS
1. Introduction
Low-energy x-rays are widely used for diagnostic radiology, mammography, and brachytherapy. For instance, the low energy x-ray emitters 103Pd and 125I (Massillon-JL et al 2011) as well as miniature x-ray tubes (Kim et al 2018, Ramachandran et al 2019) are used for brachytherapy treatments. To calculate the absorbed dose to water in these fields, the AAPM TG-61 recommends averaging the monoenergetic mass energy absorption coefficients over the photon energy fluence spectrum at the point of interest to obtain the ratio for water-to-air of the mean mass energy-absorption coefficient (Ma et al 2001). Besides, the photon spectra are necessary to simulate the patient dose as well as image quality using Monte Carlo (MC) codes. Generally, measuring x-ray spectra directly from an x-ray tube is not always possible due to the specialized equipment required. Ankerhold has published the most complete set of data about x-ray spectra measured at the Physikalisch-Technische Bundesanstalt (PTB) using a high purity germanium detector (Ankerhold 2000). The x-ray spectra reported are for the—ISO and DIN radiation qualities as well as unfiltered x-ray spectra (Ankerhold 2000). Recently, Ketelhut and colleagues published a catalog of x-ray spectra for mammography beam qualities of Mo-, Rh-, and W-anode-based x-ray tubes from 10 to 50 kV (Ketelhut et al 2021). An alternative to the measured x-ray spectra commonly considered for clinical applications is through the simulation of the physical process of the x-ray production using MC or analytical methods (Boone and Seibert 1997, Boone et al 1997, Verhaegen et al 1999, Ng et al 2000, Poludniowski et al 2009, Bujila et al 2020). However, the x-ray spectra generated through these methods lack accuracy mainly at kilovoltages below 50 kV. Furthermore, it has been reported that at high altitude the air density is lower than at the sea level (Moreno-Ramírez and Massillon-JL 2021). Consequently, there exists more contribution of low-energy photon in a measured x-ray spectrum at high altitude than at the sea level. Thus, for laboratory situated at high altitude like Mexico City which is located at around 2200 m from the sea level, the use of the x-ray spectra obtained using these methods can introduce large errors (up to 50%) on the absorbed dose calculation, mainly at low energy (Moreno-Ramírez and Massillon-JL 2021).
Recently, x-ray spectra emitted from tungsten anode x-ray tubes of the lightly and moderately filtered standards radiation beam qualities from the National Institute of Standards and Technology (NIST) have been estimated using the SpekPy software toolkit (Bujila et al 2020). To validate the results, the half value layers (HVL) have been estimated using the generated spectra and compared with the HVL reported by NIST, finding differences between 5%–10%. But it is well known that two different x-ray spectra may have the same HVL depending on the differential contributions of the low-energy x-rays.
This work presents the measurements of the x-ray spectra emitted from a tungsten anode x-ray tube of M-series x-ray beams from NIST in the range of 20 and 150 kV as well as other beam qualities that have been characterized and used for dosimetry study in our group called 'W'. We also measured some spectra of mammography interest in the energy range of 25 and 35 kV using additional filtration of rhodium (Rh), molybdenum (Mo) and silver (Ag). Furthermore, the effect of the air density in Mexico City on the x-ray spectra is evaluated by comparing with standards reference conditions (SRC).
2. Materials and methods
2.1. Experimental setup
We used a planar high-purity germanium low-energy detector ORTEC model GLP-25300/13-PL-S for high-count-rates (1000 counts s−1), serial number 57-D626. The active volume is a Ge crystal of 25 mm in diameter and 13 mm in length plus an inactive Ge layer of 0.3 μm. The detector also has an absorbing beryllium window of 0.254 mm in thickness. The detector is associated with a preamplifier model A232N serial number 17139954. The operating bias voltage is negative 2000 V. Due to the relatively high current (2 mA) of the x-ray tube, all the measurements were performed at 1770 mm distance from the source to reduce the count rates, thereafter corrected due to attenuation and air density to 1000 mm. A collimator of 3 mm diameter was used for the output of the beam. Additional filters of high purity aluminium foils (99.999%), rhodium (99.99%), molybdenum (99.99%) and silver (99.99%) were used. The minimum thickness foil used was 0.0254 mm which has been measured using Scanning Electron Microscope installed in the central microscope laboratory at our Institute. The uncertainties in the thicknesses are less than 0.4%. Tables 1 and 2 show the different beam qualities studied in this work.
Table 1. Beam qualities of mammography interest studied in this work.
| Anode/Filtration | Voltage (kV) | Additional filtration |
|---|---|---|
| W/Rh25 | 25 | 0.025 mm Rh |
| W/Rh28 | 28 | 0.025 mm Rh |
| W/Rh30 | 30 | 0.025 mm Rh |
| W/Rh35 | 35 | 0.025 mm Rh |
| W/Ag25 | 25 | 0.025 mm Ag |
| W/Ag28 | 28 | 0.025 mm Ag |
| W/Ag30 | 30 | 0.025 mm Ag |
| W/Ag35 | 35 | 0.025 mm Ag |
| W/Mo25 | 25 | 0.05 mm Mo |
| W/Mo28 | 28 | 0.05 mm Mo |
| W/Mo30 | 30 | 0.05 mm Mo |
| W/Mo35 | 35 | 0.05 mm Mo |
Table 2. Beam qualities studied in this work.
| Additional filtration This work | Additional filtration NIST (NIST 2022) | ||||
|---|---|---|---|---|---|
| Beam code | Voltage (kV) | Al (mm) | Cu (mm) | Al (mm) | Cu (mm) |
| M20 | 20 | 0.2794 | 0.27 | ||
| M30 | 30 | 0.508 | 0.5 | ||
| M40 | 40 | 0.889 | 0.89 | ||
| M50 | 50 | 1.0668 | 1.07 | ||
| M60 | 60 | 1.8288 | 1.81 | ||
| M80 | 80 | 2.8702 | 2.86 | ||
| M100 | 100 | 5.2324 | 5.25 | ||
| M120 | 120 | 7.112 | 7.12 | ||
| M150 | 150 | 5.2324 | 0.254 | 5.25 | 0.25 |
| H30 | 30 | 4.572 | 4.5 | ||
| H40 | 40 | 4.572 | 0.254 | 4.53 | 0.26 |
| H60 | 60 | 4.064 | 0.6096 | 4.0 | 0.61 |
| W25 | 25 | 0.2794 | |||
| W27 | 27 | 0.2794 | |||
| W30 | 30 | 0.3048 | |||
| W36a | 36 | 0.3048 | |||
| W36b | 36 | 0.508 | |||
| W44 | 44 | 0.889 | |||
| W53 | 53 | 1.0668 | |||
| W70 | 70 | 2.032 | |||
| W78 | 78 | 2.8702 | |||
| W96 | 96 | 5.2324 | |||
| W116 | 116 | 7.112 | |||
| W145 | 145 | 5.2324 | 0.254 | ||
| W155 | 155 | 5.2324 | 0.254 | ||
The spectrometry measurements were carried out at the x-ray Irradiation Room. This laboratory is used for basic research and mammography studies. Figure 1 displays the experimental setup of the spectrometry measurements.
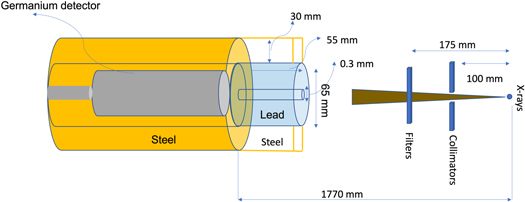
Figure 1. Experimental setup of the spectrometry measurements of the current generated by the x-ray tube.
Download figure:
Standard image High-resolution imageThe x-ray tube is an YXLON Y.SMART 160E/1.5 with tungsten (W) anode and an inherent filtration of 1 mm beryllium. The tube which has a 3.0 mm focal spot operates from 10 to 160 kV in steps of 1 kV. The effective anode angle is 30°. The minimum current generates by the x-ray tube is 2 mA and this value was used during all the measurements.
2.2. Detector response
When doing spectrometry, the number of photons that the detector is capable to read with respect to the number of photons emitted by the radiation source is fundamental. Thus, the efficiency of the detector must be evaluated since not all the incident photons are detected and if they are detected, not all the energy is deposited into the detector crystal. The efficiency can be obtained experimentally or through simulation. In this work the efficiency of the detector was measured using three radioactive sources of 133Ba, 137Cs and 55Fe calibrated at the National Institute of Nuclear Research. First, each radioactive source was collocated individually at 1 cm from the detector and the gamma spectrum was obtained during 600 s. To perform these measurements, the detector and the radioactive source were both collocated within the steel cylinder without the entry lead collimator in the front part as shown in figure 1 so that the radioactive source could be very close to the detector at 1 cm. The 1 cm distance was choosing due to the low activity of the radioactive sources. We analyzed the gamma spectra through a deconvolution process. Using the deconvolution results, the efficiency,  was evaluated as:

where N is the net area under each gamma peak (total counting), A (Bq) is the activity reported in the calibration certificate, ρ is the γ-ray emission probability for this peak according to the nuclear data center (NuDat 2.8 2022) and t the collection time. Figure 2. shows the efficiency of the detector measured as a function of the photon energy.
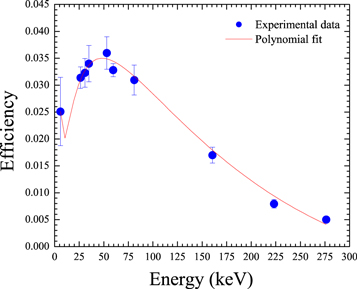
Figure 2. Efficiency calibration of the detector. The uncertainty bars correspond to a coverage factor k = 1.
Download figure:
Standard image High-resolution imageAfter, we made a second measurement by collocating the 3 radioactive sources simultaneously at 1 cm from the detector and obtained a wide spectrum that includes many gamma-ray peaks. The collection time was 600 s. Figure 3 depicts the deconvoluted spectrum.
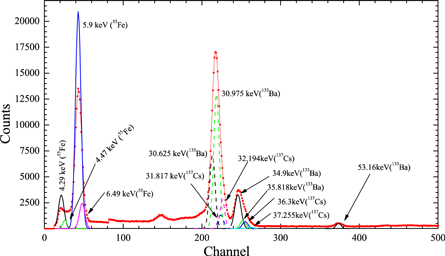
Figure 3. Deconvoluted spectrum for the three radioactive sources of 133Ba, 137Cs and 55Fe.
Download figure:
Standard image High-resolution imageUsing the net area under each gamma peak and the results for the efficiency shown in figure 2, the activity for each source was obtained and compared with the reference value reported in the calibration certificate. Good agreement was observed with differences of 0.5% (70842.2 Bq reference versus 71198.6 Bq measured) for the 133Ba source, 0.05% (222382.1 Bq reference versus 222495.7 Bq measured) for the 137Cs source and 0.03% (288978.6 Bq reference versus 288877.0 Bq measured) for the 55Fe source. So, the corrected x-ray spectrum was obtained as the ratio of the measured spectrum divided by the efficiency.
2.3. Data processing
The spectra were collected using a DSPEC Jr 2.0 TM digital signal processing module serial number 17219224 from ORTEC and the MAESTRO-32 MCA software version 7.01. After an optimisation test, we used a rise time of 1.2 μs and a flat top width of 0.3 μs. The raw spectra were collected within 512 channels. The channels were calibrated in terms of energy using the same gamma sources mentioned above. Tables 3 and 4 display the count rates, the total counts collected and the dead time for each x-ray beam measured. A background spectrum was collected for 48 h and after subtracted from each x-ray spectrum measured.
Table 3. Count rates, total counts and dead time for the mammography beams
| Beam code | Voltage (kV) | Count rate (counts s−1) | Total counts (counts) | Dead time (%) |
|---|---|---|---|---|
| W/Rh25 | 25 | 296 | 266 240 | 0.22 |
| W/Rh28 | 28 | 479 | 429 972 | 0.22 |
| W/Rh30 | 30 | 536 | 481 106 | 0.33 |
| W/Rh35 | 35 | 766 | 687 141 | 0.33 |
| W/Ag25 | 25 | 133 | 119 998 | 0.11 |
| W/Ag28 | 28 | 270 | 242 802 | 0.22 |
| W/Ag30 | 30 | 306 | 274 825 | 0.22 |
| W/Ag35 | 35 | 458 | 412 060 | 0.22 |
| W/Mo25 | 25 | 198 | 178 066 | 0.11 |
| W/Mo28 | 28 | 285 | 255 899 | 0.22 |
| W/Mo30 | 30 | 322 | 288 906 | 0.22 |
| W/Mo35 | 35 | 450 | 403 862 | 0.22 |
Table 4. .Count rates, total counts and dead time for the radiological beams
| Beam code | Voltage (kV) | Count rate (counts/s) | Total counts (counts) | Dead time (%) |
|---|---|---|---|---|
| M20 | 20 | 197 | 176 410 | 0.33 |
| M30 | 30 | 703 | 630 570 | 0.33 |
| M40 | 40 | 1346 | 1203 219 | 0.67 |
| M50 | 50 | 2151 | 1916 480 | 1.0 |
| M60 | 60 | 3343 | 2965 345 | 1.44 |
| M80 | 80 | 2398 | 2158 404 | 1.11 |
| M100 | 100 | 2960 | 2664 152 | 1.33 |
| M120 | 120 | 3841 | 3456 738 | 1.78 |
| M150 | 150 | 9368 | 8093 575 | 4.0 |
| H30 | 30 | 32 | 29 013 | 0.11 |
| H40 | 40 | 28 | 25 400 | 0.11 |
| H60 | 60 | 152 | 136 835 | 0.11 |
| W25 | 25 | 582 | 521 827 | 0.33 |
| W27 | 27 | 1061 | 950 487 | 0.44 |
| W30 | 30 | 1017 | 911 187 | 0.44 |
| W36a | 36 | 2042 | 1821 156 | 0.89 |
| W36b | 36 | 1528 | 1366 032 | 0.67 |
| W44 | 44 | 2003 | 1786 698 | 0.89 |
| W53 | 53 | 3045 | 2703 518 | 1.33 |
| W70 | 70 | 4341 | 3833 355 | 1.89 |
| W78 | 78 | 4834 | 4259 021 | 2.1 |
| W96 | 96 | 5643 | 4954 690 | 2.44 |
| W116 | 116 | 7037 | 6143 350 | 3.0 |
| W145 | 145 | 9782 | 8432 339 | 4.2 |
| W155 | 155 | 11 922 | 10181 153 | 5.1% |
Each x-ray spectrum presented here is normalized to the standard reference conditions of air density  = 1.1974 × 10⁻³ g.cm−3, pressure P0 = 101.3 kPa, temperature T0 = 20 °C and distance of 1000 mm from the detector to the x-ray focal spot. To convert each x-ray spectrum measured under the environmental conditions of pressure P, temperature T and humidity r in our lab to that under standard reference conditions, the exponential attenuation function was used considering the Drake and Böhm equation for air density ρ (Drake and Böhm 1990):

with

where ΦE
and ΦE,
m
are the photon fluence at the standard reference conditions (SRC) and the laboratory conditions (LC), respectively.  are the mass attenuation coefficients (Hubbell and Seltzer 2004) and were adjusted to double logarithmic function for a better interpolation, d is the distance between the Ge spectrometer and the x-ray tube focal spot. In our lab, P, T and r were monitored simultaneously with each x-ray spectrum using high precision thermometer Fluke 1523, barometer Druk DPI, and hygrometer EasyLog EL-USB-2-LCD. To normalize the x-ray spectra from 1770 to 1000 mm, the measured spectra were corrected by inverse square law plus air attenuation.
2.4. Half value layer and mean energy
The half value layer (HVL) was evaluated using the x-ray spectra and measured with a reference ionization chamber from Standard Imaging model A12. To determine the HVL using the spectra, first the air kerma was calculated as

where  is the photon fluence,
  the energy and
  is the mass energy transfer coefficient for air. As the mass energy transfer coefficient and the mass absorption coefficient are the same at this energy range, we used the mass absorption coefficients published by Hubbell and Seltzer (2004).
Thus, using the exponential attenuation law, the HVL was calculated as

where,  is the air kerma after crossing the filter material (aluminium),
  is the mass attenuation coefficient for aluminium,
  is the density of the filter material.
The mean photon energy was calculated as:
3. Results and discussion
3.1. Mammography x-ray spectra
The several mammography x-ray spectra measured in this work are displayed in figures 4(a)–(c) for the additional filtration of molybdenum, rhodium and silver, respectively. Table 5 presents the HVL from the spectra and the average energies.
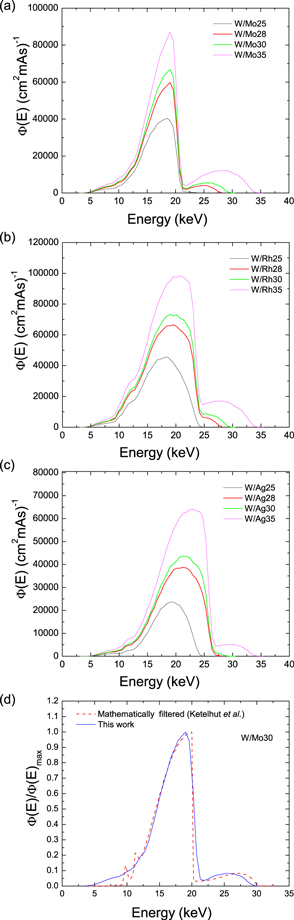
Figure 4. (a). Mammography x-ray spectra for additional filtration of 50 μm molybdenum obtained under SRC. (b). Mammography x-ray spectra for additional filtration of 25 μm rhodium obtained under SRC. (c). Mammography x-ray spectra for additional filtration of 25 μm silver obtained under SRC. (d). Mammography x-ray spectra for additional filtration of 50 μm molybdenum obtained in this work compared to mathematically filtered beam from Ketelhut et al 2021.
Download figure:
Standard image High-resolution imageTable 5. HVL and average energy obtained from the spectra for the mammography beams.
| Beam code | Half-value-layer (mm Al) | Average energy (keV) |
|---|---|---|
| W/Rh25 | 0.274 | 17.12 |
| W/Rh28 | 0.295 | 17.99 |
| W/Rh30 | 0.305 | 18.24 |
| W/Rh35 | 0.325 | 19.29 |
| W/Ag25 | 0.377 | 18.31 |
| W/Ag28 | 0.438 | 19.76 |
| W/Ag30 | 0.446 | 19.98 |
| W/Ag35 | 0.477 | 20.72 |
| W/Mo25 | 0.262 | 16.39 |
| W/Mo28 | 0.271 | 16.91 |
| W/Mo30 | 0.276 | 17.19 |
| W/Mo35 | 0.290 | 18.51 |
Note that the effect of the different material used as additional filtration is slightly reflected on the shape of the spectra shown in figure 4 where the maximum intensity of the molybdenum filtration is narrower than the others. The spectra with additional filtration of molybdenum are narrower than those with additional filtration of rhodium and silver. With respect to the HVL for the mammography beams shown in table 5, the results are within the interval expected since the HVL generally reported for mammography beams are in the interval between 0.27 mm and 0.67 mm Al (IAEA 2021). Figure 4(d) shows the mammography x-ray spectra for tungsten anode with additional filtration of 50 μm molybdenum obtained in this work compared to mathematically filtered beam from Ketelhut et al 2021. As can be seen there is good agreement between the two spectra. The HVL calculated for the spectrum from Ketelhut is 0.325 mm Al versus 0.276 mm Al from ours which represents a difference of 15%. However, besides the remarkable discrepancy on the HVL, the average energies obtained in both studies are similar with a difference of 1.2% (17.41 keV from Ketelhut et al versus 17.19 keV from this work).
3.2. Radiological x-ray spectra
The x-ray spectra measured under standard reference (SRC) and laboratory conditions (LC) for the M30, M40, M80, M100 and M120 are presented in figures 5, 6(a)–(c), respectively. For all the spectra, the counts were divided by the product of the current of the x-ray tube, the measuring time, and the area of the collimator aperture.Thereafter, the M80, M100 and M120 beams are normalised by the maximum fluence for comparison with calculations or with data reported in the literature. A slight difference can be observed between the spectra under LC and SRC for the M30 and M40, whereas for the M80, M100 and M120, such a difference vanishes. This suggests that the effect of the air density in Mexico City affects slightly the x-ray spectra below 50 kV, mainly if the spectra are filtrated.
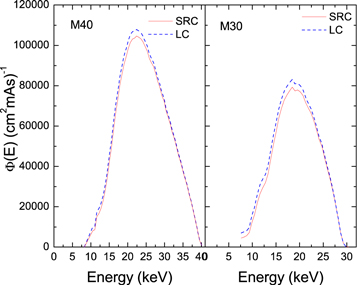
Figure 5. X-ray spectra for the M30 and M40 beams obtained under laboratory conditions (LC) compared with those of the standard reference conditions (SRC).
Download figure:
Standard image High-resolution imageTable 6 displays the HVL obtained through the spectra and measured with ionization chamber as well as the average energy for the radiological beams. As can be observed in table 6, within measurement uncertainties, there is good agreement between the HVL from the spectra and those measured with ionization chambers. The differences observed are around 0.2% and 13% which are smaller than the uncertainties on the measurements with ionization chamber. Comparing the HVL obtained from the spectra with the data published by NIST for the M-series beams, the maximum difference is about 10%. Even though in some case, it was not possible to reproduce the same additional filtration due to the limitation of the aluminum foil thickness available in our Lab.
Table 6. HVL obtained in this work from the spectra compared with those measured with ionization chamber for the radiological beams as well as average energies. The uncertainty in the HVL obtained for the spectra are around 0.7%, which corresponds to a coverage factor k = 1.
| Half-value-layer (mm Al) SRC | ||||
|---|---|---|---|---|
| Beam code | Spectra | NIST | Measured (ionization chamber) | Average energy (keV) |
| M20 | 0.159 | 0.15 | 14.54 | |
| M30 | 0.364 | 0.36 | 19.20 | |
| M40 | 0.72 | 0.74 | 24.45 | |
| M50 | 1.042 | 1.04 | 28.43 | |
| M60 | 1.674 | 1.68 | 1.74 ± 0.11 | 34.40 |
| M80 | 2.75 | 3.08 | 43.04 | |
| M100 | 4.80 | 5.10 | 53.24 | |
| M120 | 6.53 | 6.77 | 61.58 | |
| M150 | 10.3 | 10.3 | 77.40 | |
| H30 | 1.181 | 1.2 | 24.40 | |
| H40 | 2.81 | 2.93 | 34.10 | |
| H60 | 5.81 | 6.06 | 48.60 | |
| W25 | 0.197 | 15.80 | ||
| W27 | 0.244 | 0.25 ± 0.19 | 17.13 | |
| W30 | 0.271 | 18.10 | ||
| W36a | 0.31 | 0.35 ± 0.13 | 20.28 | |
| W36b | 0.48 | 0.51 ± 0.11 | 21.65 | |
| W44 | 0.76 | 0.85 ± 0.11 | 25.70 | |
| W53 | 1.0 | 1.13 ± 0.11 | 29.40 | |
| W70 | 2.0 | 2.22 ± 0.37 | 37.57 | |
| W78 | 2.85 | 2.83 ± 0.11 | 42.56 | |
| W96 | 4.72 | 4.80 ± 0.12 | 51.90 | |
| W116 | 6.53 | 6.54 ± 0.10 | 59.79 | |
| W145 | 10.0 | 10.03 ± 0.21 | 75.26 | |
| W155 | 10.46 | 10.41 ± 0.23 | 79.10 | |
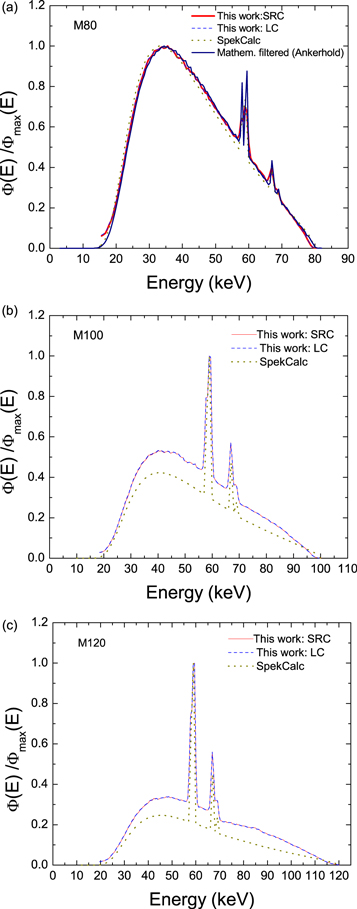
SpekCalc is an executable for calculating x-ray emission spectra from tungsten anode x-ray tubes in the energy range between 40 to 300 kV and anode angles between 6° and 30° (Poludniowski et al 2009). It is based on Monte Carlo methods for electron penetration and an analytic approach for the x-ray emission, using theoretical bremsstrahlung cross sections (Poludniowski 2007). The x-ray spectra are generated through a user interface where the characteristics of an x-ray tube can be reproduced by selecting the distance from the focal spot, the anode angle, and the inherent and additional filtrations. X-ray spectra generated through SpekCalc, have been used by several research groups for dosimetry or biomedical studies (Tedgren et al 2011, Friedland et al 2019, Massillon-JL et al 2019). In this work, X-ray spectra from SpekCalc were also generated for x-ray beams of 80 kV, 100 kV and 120 kV considering the characteristics of our x-ray tube and the additional filtration for the M-series beams. Thus, also displayed in figures 6(a)–(c) are the x-ray spectra calculated with SpekCalc for M80, M100 and M120 beams. As observed, the SpekCalc reproduces qualitatively the experimental spectra, but not quantitatively, mainly for M100 and M120 beams. Nonetheless, the differences on the HVL are 4.4% (2.63 mm Al from SpekCalc versus 2.75 mm Al this work), 2.3% (4.69 mm Al from SpekCalc versus 4.8 mm Al this work) and 1.4% (6.44 mm Al from SpekCalc versus 6.53 mm Al this work) for the M80, M100 and M120 beams, respectively. With respect to the average energies, the discrepancies are 0.8% (42.7 keV from SpekCalc versus 43.04 keV this work), 1.0% (52.7 keV from SpekCalc versus 53.24 keV this work) and 2.24% (60.2 keV from SpekCalc versus 61.58 keV this work) for the M80, M100 and M120 beams, respectively. Such a result suggests that having a good agreement between the HVL of a beam from two different methods does not mean the x-ray spectra are the same. Besides, we compared the M80 spectrum with a mathematically filtered beam measured at PTB by Ankerhold. The result is depicted in figure 6(a). Both spectra agree quite well with a difference of 0.7% in the average energy (43.36 keV from Ankerhold versus 43.04 keV this work).
Figure 6. (a). X-ray spectra for the M80 beam obtained under LC and SRC compared with that obtained with SpekCalc and mathematically filtered beam from PTB. (b). X-ray spectra for the M100 beam obtained under LC and SRC compared with that obtained with SpekCalc. (c). X-ray spectra for the M120 beam obtained under LC and SRC compared with that obtained with SpekCalc.
Download figure:
Standard image High-resolution image
4. Conclusions
This work has measured a list of x-ray spectra for the NIST-M series beams and other beam qualities that have been characterised in our lab for dosimetry study. We also measured some mammography spectra for tungsten anode with additional filtration of molybdenum, rhodium, and silver in the range between 25 and 35 kV. The results indicate that if the beams are filtrated, the effect of the air density affects only the x-ray spectra below 50 kV.
The spectra measured in this work were compared with those obtained through calculation using SpekCalc and with mathematically filtered beam measured at PTB by Ankerhold (2000). Our result agrees quite well with that reported by Ankerhold but comparing with SpekCalc the agreement is qualitative but not quantitative.
Acknowledgments
This project is partially supported by PAPIIT-UNAM Grant IN118120. We acknowledge Eduardo López-Pineda and César Ruiz-Trejo for the technical support. We also thank Jaime Everardo Perez Rodriguez, Ricardo Ramírez Jiménez, and Jose Angel Flores from the Mechanical shop at the Physics Institute of UNAM for the construction of the collimator and for providing the liquid nitrogen for the experiments.
Data access
To get access to the data, please send an email to massillon@fisica.unam.mx