
Abstract
Radiochromic films are useful as dosimeters in high-precision radiotherapy owing to their high spatial resolution. However, when a particle beam is measured using a radiochromic film, the dose cannot be estimated accurately because the film darkness varies with variations in linear energy transfer (LET). This paper proposes a novel method for estimating the LET and the dose based on the film darkness. In this method, after a high-LET particle beam, such as a carbon-ion beam, was incident on the film, the film was digitized and its net optical density was determined. Further, the non-linearity of the film response curve between the dose and the darkness, depending on LET, was used. Then, calibration curves were created using 290 MeV u−1 mono energetic carbon-ion beams. We used LETs of 20, 50, 100, and 150 keV µm−1 and a physical dose of 2–14 Gy. The calibration curves were approximated for each LET using a quadratic function. The correlations between the coefficients of the quadratic function and the LET were also obtained. To verify the proposed method, the films were irradiated under 12 different conditions corresponding to various depths and doses. Four depths of −2, −5, −10, and −20 mm with respect to the Bragg peak, and three different preset values were used for the film measurements. The films were analyzed in four groups, where each group comprised films irradiated at the same depth. The LETs obtained from the film analysis, ordered from the upstream of the beam, were 20, 41, 56, and 97 keV µm−1, and the doses for the lowest preset value were 3.95, 4.07, 4.03, and 3.99 Gy for the four groups. The LETs obtained from the film analysis increased toward the Bragg peak, and the doses measured in the ionization chamber were almost equal to 4 Gy.
Export citation and abstract BibTeX RIS

Original content from this work may be used under the terms of the Creative Commons Attribution 3.0 license. Any further distribution of this work must maintain attribution to the author(s) and the title of the work, journal citation and DOI.
1. Introduction
In radiation therapy, accurate irradiation is essential to control tumors and to reduce side effects on normal organs surrounding tumors. Quality assurance (QA) measurements are required to confirm patients' treatment plans (Miften et al 2018). Dosimeters that can measure two-dimensional (2D) dose distributions are efficient with patient-specific QA. Furthermore, radiochromic films can obtain a 2D dose distribution with a high spatial resolution more easily compared to 2D Array Seven 29TM (T10024, PTW, Freiburg, Germany). Therefore, radiochromic films are a useful tool for verifying high-precision treatment. The irradiated films generically exhibit film darkness, which is calibrated to the radiation dose. The physical quantity that represents film darkness can be any optical density (OD) based functions such as netOD (Soares 2006, Devic 2011). The dose distribution can be obtained from the film darkness.
However, when high linear energy transfer (LET) particle beams are measured using radiochromic films, the film darkness changes with LET even at the same dose (Moyers 2008, Martišíkovsá and Jäkel 2010). The LET of a particle beam increases towards the end of the Bragg peak (Kanai et al 1999). Owing to the complex dependence of the film response on the particle type and energy, it is not possible to perform absolute dose measurements for mixed-particle radiation fields (Spielberger et al 2001, 2002). Castriconi et al (2017) reported that when the same physical dose was measured in the plateau and peak of the depth-dose curve of carbon-ion beams using radiochromic films, the film darkness was suppressed by about 40% in the peak region. Kanematsua et al (2019) reported a method for correcting the LET dependence of the film darkness. The report described a method for compensating the film darkness by predicting the LET using simulations. Here, the LET of the measurement point needs to be known in advance. The measurements based on simulations may not be accurate due to changes in the depth and the effects of the scattered radiation when the measurements are performed on an actual patient. In addition, Parisi et al (2019) reported a method for quantifying the LET of proton beams. The LET was measured using two different thermoluminescent detectors. However, the operation is complicated since the characteristics of each detector need to be examined.
This study proposes a new method using radiochromic films. This method uses the non-linearity of the film response curve between the dose and the darkness depending on LET. By changing the preset value, which is the reading value of the primary monitoring ion chamber, the respective films are irradiated with multiple ratios of the dose. The LET is analytically determined from the ratio of the dose and the film darkness. Once the LET has been determined, a calibration curve is fixed. In addition, the dose can be calculated from the film darkness using the calibration curve. This is a novel method for simultaneously determining the LET and the dose using only one detector measurement, that has not been reported previously. This paper describes the calibration of the films, the principle of simultaneous LET and dose quantification, and verification of the proposed method.
2. Materials and methods
2.1. Irradiation setup
In this study, GafChromic (TM) EBT3 films (International Specialty Products, Palmer et al 2015) were used. These films can be handled in visible light and exhibit self-developing behavior. The films were cut into 4 cm × 4 cm pieces to be irradiated using 290 MeV u−1 mono energetic carbon-ion beams. The irradiation setup is shown in figure 1. A water tank capable of changing the water thickness by adjusting the amount of water was used, and the various LETs were selected by adjusting the water thickness. A solid phantom (Tough Water Phantom, Kyoto Kagaku Co.) with a thickness of 20 mm was placed on the downstream side of the water tank, and a piece of film was placed on the phantom. In addition, a solid phantom with a thickness of 2 mm was placed on the film piece to flatten the film. The film pieces were irradiated at the isocenter with various water depths.
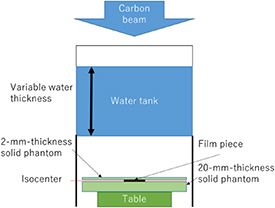
Figure 1. Irradiation setup. By changing the amount of water in the water tank, the height of the water column can be adjusted in multiples of 0.1 mm. The center of the film was set at the isocenter.
Download figure:
Standard image High-resolution imageThe following conditions were used when irradiating the films. The size of the irradiation field was set to 110 × 110 mm2 with a multi-leaf collimator. The wobbler radius was set to 77 mm, the scattering device was 2 mm thickness, and there was no range shifter. Experiments were conducted in the vertical port in the C room of the Gunma University Heavy Ion Medical Center (GHMC) (Ohno et al 2011).
2.2. Scanning and data analysis for film
For digitization, a commercial flatbed scanner (Seiko Epson Corp. ES-10000G) was used with a transmission unit. The irradiated film was scanned approximately 24 h after irradiation. The scan settings were 48-bit color with a resolution of 75 dots per inch. The scanned images were saved as the tagged image file format.
The scanned images were split into three colors (Red, Green, and Blue) using ImageJ software (National Institutes of Health, MD, USA). The average pixel value of a 1 cm square of the film center was obtained from the red channel image for each irradiated film. In addition, three unirradiated film pieces were scanned, and analyzed under the same conditions. The average of the three images was used as the background of the film.
These pixel values were converted to netOD, as reported by Devic et al (2005), where netOD is expressed by the formula:

where  is a pixel value of an unirradiated film;
  is a pixel value of the irradiated film; and
  is the value exhibited by the scanner when a transmission is not being performed.
2.3. Calibration curves
In this study, the calibration curves for netOD and the dose were created using a mono energetic 290 MeV u−1 carbon-ion beam for some LETs. This mono energetic 290 MeV u−1 carbon-ion beam was simulated via a Monte Carlo simulation using GEANT4 (Allison et al 2006). The simulation was performed using the method previously reported by Sakama et al (2012). This study used the standard model of the electromagnetic process and the JQMD (QMD) model in G4QMD (Koi 2008). Figure 2 illustrates the relationship between the depth, physical dose, and LET obtained via the simulation. In this simulation, the peak depth of the physical dose was 153.9 mm. The physical dose results via the simulation were compared with measurements for verification. The measurements were performed using an Advanced Markus plane-parallel chamber (No. 34045, PTW, Freiburg, Germany). The peak depth was measured with and without an entrance window, and the water equivalent thickness of the entrance window was determined to be 1 mm from the difference. The depth was determined while considering the entrance window thickness. These measurements are also plotted in figure 2.

Figure 2. Relationship between the depth, physical dose and LET simulated using GEANT4 when the water was irradiated with 290 MeV u−1 mono energetic carbon-ion beams. The data points represent the measurements obtained using an ionization chamber. The horizontal axis represents the depth of the water. The left and right vertical axes are LET (keV µm−1) and the relative physical dose, respectively.
Download figure:
Standard image High-resolution imageSeveral calibration curves were created using the various LETs. For this investigation, the LET values were chosen to be 20, 50, 100, and 150 keV µm−1. The depths corresponding to each LET were 113.1, 149.0, 153.0, and 153.6 mm, respectively, from the simulation. The films were irradiated between 2–14 Gy, at 2 Gy intervals, for each LET. These films were scanned to obtain pixel values. The pixel values were then converted to netODs using equation (1). These netODs were approximated by a quadratic function with the y-intercept set to zero to obtain each calibration curve. This study adopted the following formula based on the form proposed by Devic et al (2005):

where Dose was the irradiated dose and netOD was an experimental value obtained using equation (1) from the darkness of the irradiated film. The coefficients  and
and  were determined using the least-squares method to best fit the experimental data for each LET. Moreover, the LET and the coefficients of the approximate equation were also determined using a quadratic function as follow:


where  ,
,  , and
, and  in equation (3) were constant so that LET and
  were best fitted by a quadratic function. The same applies to the coefficients, with
  instead of
  , in equation (4).
2.4. The principle of analysis method
This study used the non-linearity of the film response curve between the dose and the darkness depending on the LET. The equation that correctly represents the calibration curve has not been theoretically solved. However, in most cases, the calibration curves are expressed as an exponential, logarithmic, or polynomial curves. Therefore, the dose ratio and the darkness ratio are not coincident.
When the film is irradiated with a specific dose (x Gy) at a specific LET, the following equation is obtained from the calibration curve (equation (2)). When irradiating with n*x Gy (n > 0) at the same LET, it is presented as:


where  and
and  are experimental data that are obtained from the film darkness when the film is irradiated to the dose given in parentheses. n is the ratio of the preset value.
 and
and  in equations (5) and (6) are replaced with equations (3) and (4). Then, upon removing the dose part from equations (5) and (6), a quadratic function with only the LET variables is obtained.

This quadratic function has two solutions. One solution is a negative value that is not realistic for LET. Therefore, the positive value can be considered as the correct solution.
After the LET is determined, the coefficients  and
and  in equation (2) are determined by substituting the LET value in equations (3) and (4). By substituting the netOD obtained from the experiment into equation (2), the dose used in the experiment can be also derived.
2.5. Examination of the proposed method
The examination was performed with the same setup as that when the calibration curve was created, and the same mono energetic carbon-ion beam was used. The films were irradiated at depths excluding the depth in which the calibration curve was created. The depths were −2, −5, −10, and −20 mm with respect to the Bragg-peak. At these depths, the films were irradiated at respective preset values. The doses corresponding to the respective preset values were 4, 8, and 12 Gy, as measured using an ionization chamber. In principle, the LET and the dose can be determined from two measurements since the quadratic functions were used. However, it is conceivable that there could be an error in the analysis due to film measurement errors. In this experiment, three doses were measured to reduce the possibility of finding an incorrect approximate curve. The dose ratio n for each measurement was 1:2:3.
The films irradiated at the same depth were analyzed as a set. A calibration curve that best matches data of the same set and the dose ratio was determined by the least-squares method. The calibration curve was determined from the LET function (equations 2–4). The minimum value of the LET was assumed to be 20 keV µm−1, based on the simulation. The obtained results were verified by performing a comparison with the simulation results.
In addition, the netOD ratios were calculated to evaluate the accuracy exhibited by the proposed method. For assumed each LET value, the LET functions obtained from the calibration curve were used. The doses were the same as those used in the experiment.
3. Results
3.1. Calibration curves
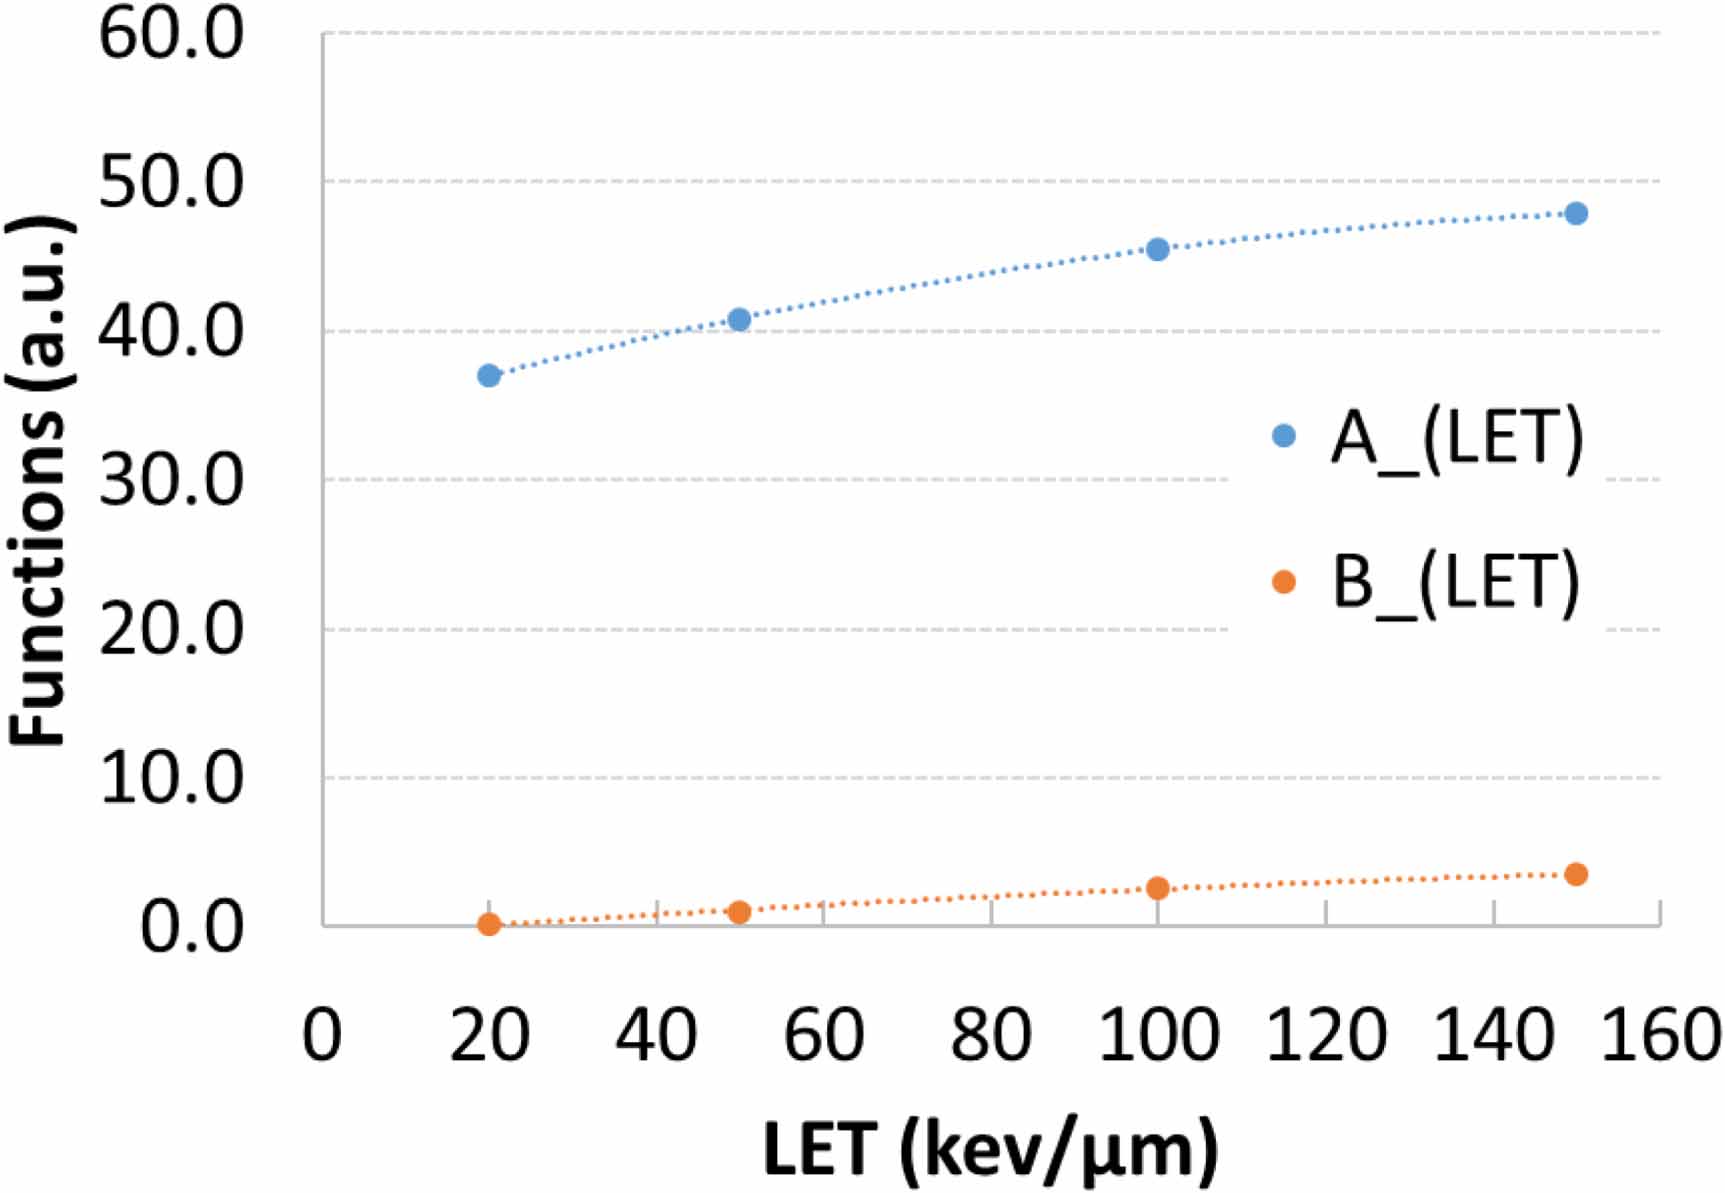
The calibration curves for the LETs of 20, 50, 100, and 150 keV µm−1 are shown in figure 3. The fitted quadratic functions and coefficients are listed in table 1. Moreover, the relationships between the coefficients and LET are shown in figure 4. The coefficients  ,
,  , and
, and  in equation (3) are −4.44 × 10-04, 1.59 × 10-01, and 3.40E+01, respectively. In addition, the coefficients
  ,
,  , and
, and  in equation (4) are −8.26 × 10−05, 4.05 × 10−02, and −6.70 × 10−01, respectively. The R2 values for the LET and coefficients were 0.9999 for
  and 0.9971 for
  , respectively.
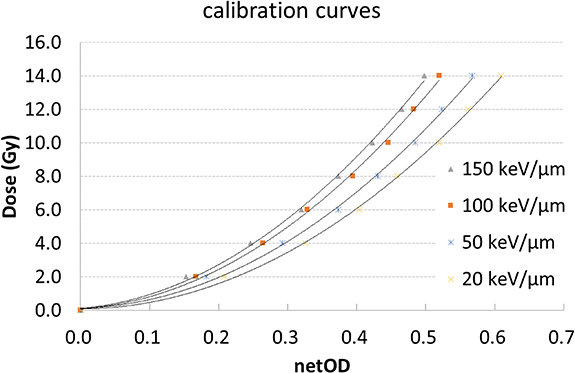
Figure 3. Calibration curves for the LETs of 20, 50, 100, and 150 keV µm−1. The vertical axis represents the physical dose (Gy) and the horizontal axis represents the netOD.
Download figure:
Standard image High-resolution image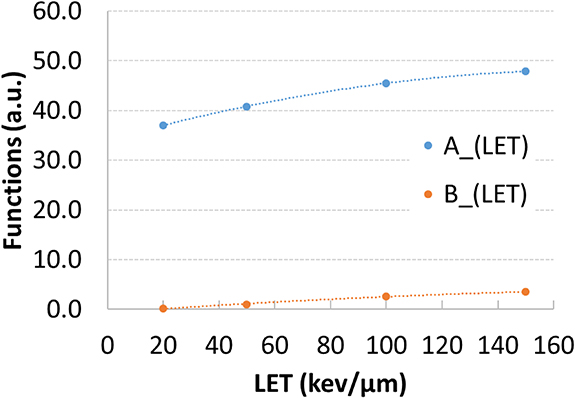
Figure 4. Relationship between the calibration curve coefficients and the LET. The coefficient of the quadratic term is A(LET) and the coefficient of the primary term is B(LET). Moreover, the R2 values of approximation function were 0.9999 for  and 0.9971 for
  , respectively.
Download figure:
Standard image High-resolution imageTable 1. Summary of the approximate equations and the coefficients for each LET.
| LET | Approximate expressions | A(LET) | B(LET) |
|---|---|---|---|
| 150 | Dose = 47.9 × netOD2 + 3.52 × netOD | 47.9 | 3.52 |
| 100 | Dose = 45.5 × netOD2 + 2.63 × netOD | 45.5 | 2.63 |
| 50 | Dose = 40.8 × netOD2 + 1.04 × netOD | 40.8 | 1.04 |
| 20 | Dose = 37.1 × netOD2 + 0.156 × netOD | 37.1 | 0.156 |
3.2. Results of the examination
Table 2 summarizes the netODs obtained from the films that were irradiated under the examination conditions. In addition, the results of the analysis, simulation, and measurement are presented in table 2. This study analyzed three films that were irradiated at the same depth as a set. The doses obtained from the film analysis were 3.95, 4.07, 4.03, and 3.99 Gy for the preset values of n = 1 and the corresponding LETs were 20, 41, 56, and 97 keV µm−1.
Table 2. Irradiation conditions and film measurement results. The first column shows the depths used in this experiment. The second column summarizes the irradiation doses, and the netODs obtained from the irradiated films. The third column shows the analysis results obtained via the proposed method. The fourth and fifth columns present the measured dose performed using the ionization chamber and the LETs simulated using GEANT4.
| −20 mm | x | 0.325 | 3.95 | 20 | 4.0 | 28 |
| 2x | 0.465 | 7.89 | 8.0 | |||
| 3x | 0.561 | 11.84 | 12.0 | |||
| −10 mm | x | 0.308 | 4.07 | 41 | 4.0 | 38 |
| 2x | 0.444 | 8.15 | 8.0 | |||
| 3x | 0.542 | 12.22 | 12.0 | |||
| −5 mm | x | 0.295 | 4.03 | 56 | 4.0 | 50 |
| 2x | 0.428 | 8.06 | 8.0 | |||
| 3x | 0.523 | 12.09 | 12.0 | |||
| −2 mm | x | 0.269 | 3.99 | 97 | 4.0 | 74 |
| 2x | 0.398 | 7.99 | 8.0 | |||
| 3x | 0.485 | 11.98 | 12.0 |
Figure 5 displays the calibration curves that were determined using the simulated LETs and the measured doses. Figure 5 also displays the film analysis results in the examination. The error is 3% on the vertical axis, which is the error of dose measurement using the film. Task Group 55 of the American Association of Physicists in Medicine described that uncertainties for film measurements were 5% at two standard deviations (Niroomand-Rad et al 1998). In this study, we adopt uncertainties of 3%, which are commonly used in radiation therapy (Mclaughlin et al 1994). With regard to the error in the horizontal axis, the netOD deviation when the dose was shifted by 3% was used.
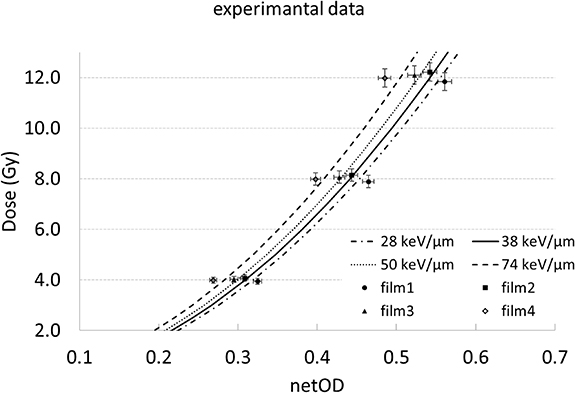
Figure 5. Calibration curves for each LET and the data points in the examination. The calibration curves were determined from the simulated LETs. The plots show the data points that were obtained from the film measurements. Film 1–4 corresponds to the films irradiated at depths of −20, −10, −5, and −2 mm with respect to the Bragg peak. The error bar is 3% in the vertical axis, which is the error of the dose measurement using the film. For the error bar of the horizontal axis, netOD was used deviation when the dose was shifted by 3%.
Download figure:
Standard image High-resolution imageThe doses obtained from the film analysis exhibited a good match with the ionization chamber measurements. The maximum deviation was 1.75%, which was less than 3%. The LET was matched within 10 keV µm−1 for the low LET region. The largest difference was 23 keV µm−1 at 74 keV µm−1.
Table 3 summarizes the netODs that were calculated from the calibration curves. The LET values were between 20 and 160 keV µm−1 at intervals of 20 keV µm−1. The dose values were 4,8, and 12 Gy, which were the same as the experiment. The ratios of netOD were different for all of the LETs. The LET and the dose were obtained due to the difference between these ratios.
Table 3. netODs calculated from the approximate expressions. This calculation used LETs ranging from 20 to 160 keV µm−1 at intervals of 20 and the physical dose was the same as that in the experiment. The netOD and the ratio of each LET are shown. The netOD ratio is different for each LET even at the same dose.
| LET (keV µm−1) | ||||||||||
|---|---|---|---|---|---|---|---|---|---|---|
| 20 | 40 | 60 | 80 | 100 | 120 | 140 | 160 | |||
| Dose (Gy) | 4 | 0.327 | 0.307 | 0.292 | 0.280 | 0.270 | 0.262 | 0.257 | 0.253 | |
| 8 | 0.463 | 0.439 | 0.420 | 0.404 | 0.392 | 0.383 | 0.376 | 0.371 | ||
| 12 | 0.568 | 0.540 | 0.518 | 0.500 | 0.486 | 0.476 | 0.468 | 0.463 | ||
| * The value in the table is netOD | ||||||||||
| Relative values | netOD(4)/netOD(8) | 0.706 | 0.700 | 0.696 | 0.691 | 0.688 | 0.685 | 0.682 | 0.680 | |
| netOD(4)/netOD(12) | 0.576 | 0.569 | 0.564 | 0.559 | 0.555 | 0.551 | 0.548 | 0.546 | ||
| * netOD ratio corresponding to 4 Gy | ||||||||||
4. Discussion
This study established a new method to measure both the LET and the dose of carbon-ion beams using radiochromic films. The error in the doses measured using the films and the ionization chamber were consistently within 3%. The LETs obtained via the measurements and the simulation were in agreement at 10 keV µm−1 or less in the plateau regions for 28, 38, 50 keV µm−1 LET, and a large deviation was observed at the 74 keV µm−1 LET. The following are the potential sources of error in this method.
4.1. Approximation error
In this study, approximation was performed using a quadratic function to simplify the analysis performed using the calibration curve. However, as depicted in figure 3, the difference between the experimental data and the calibration curve was large at a dose of 2 Gy. The netODs of the films irradiated at 2 Gy using LET 20 and 150 keV µm−1 carbon-ion beams in the calibration curve measurements were 0.208 and 0.153, respectively. However, the corresponding doses obtained from the approximate expressions using the netOD values were 1.64 Gy and 1.66 Gy. These doses are reduced by approximate 20% compared to 2 Gy. Thus, there was a need to obtain more accurate approximate expressions with a consistent accuracy for all LETs and dose regions. It was necessary to obtain a more accurate calibration curve.
To this end, the effects of film background and position error on netOD were discussed. First, we considered the film background, which was considered to be the same for all films in this study. It was expected that if the background of each film is measured individually, the uncertainty in the measurement would decrease. Second, we considered the position error. The LET near the physical dose peak has a difference of 10 keV µm−1 per 0.1 mm via the simulation. The depth was set in consideration of the water equivalent thickness of the film in this experiment. The position of the dose peak with and without the 10 films on the beam path was measured using mono energetic carbon-ion beams. The deviation of the peak position was 3.5 mm. Therefore, the water equivalent thickness of one film was 0.35 mm. This result is approximately equal to the value reported by Khachonkham et al (2018). In present experiment, the depth was shifted by 0.2 mm to irradiate the center of the film because the water level had to be controlled in multiples of 0.1 mm. In addition, the active layer also has a width. Thus, it is difficult to precisely position the active layer of films at the target depth. It is necessary to improve the accuracy of the approximate expression by considering these errors.
4.2. Range and error of the LET measurements
The range of the LETs used in this experiment was only 20–150 keV µm−1. The lowest LET obtained using 290 MeV u−1 mono energetic carbon-ion beams was set to 20 keV µm−1. Moreover, the highest LET was set to 150 keV µm−1. Because it is challenging to set the positioning of the films at exactly the mono energetic Bragg peak. Therefore, 150 keV µm−1, which is slightly before Bragg peak, was selected.
Yonai et al (2018) reported calibration curves were created using carbon-ion beams for high LETs and photon beams for low LET. When the data of the 20 keV µm−1 LET or less was added, the accuracy of the approximate expression could be improved by increasing the number of data points.
A displacement of 0.1 mm in the 150 keV µm−1 LET region changed the LET by approximately 10 keV µm−1 via the GEANT4 simulation. The film position of this study was obtained from the physical dose peak measured using the ionization chamber. The measurement of peak position has a random error of ±0.05 mm, and the active layer position has a systematic error of 0.03 mm at least. When these errors are added with uncertainty of beam range and random errors in the position of active layer, it can be assumed that there is an error of about 0.2 mm. A displacement of 0.2 mm in the position of the active layer in the 100 and 150 keV µm−1 LET regions caused approximate differences of about 20 keV µm−1 in the LET and about 5% in the dose. In contrast, a displacement of 0.2 mm in the position of the active layer in the 74 keV µm−1 LET region led to approximate differences of 2 keV µm−1 in the LET and 3% in the dose. Assuming the position error of 0.2 mm in 74 keV µm−1 LET region, film measurements using an LET of 74 keV µm−1 were consistent with the calculated calibration curve in the error bar.
The LET values obtained in this study were slightly higher than the simulation values, except for the LET of 20 keV µm−1. The difference was considered to be due to the position error of the active layer. The position error caused small analysis errors in the plateau region, and large analysis errors occurred in the high LET region.
When measuring the spread-out Bragg peak (SOBP), it might not be possible to analyze the LET using the calibration curves obtained in this experiment owing to the different LET distributions. However, in a study by Yonai et al (2018), the dose distributions were obtained from the calibration curves measured using the SOBP. Therefore, a similar measurement can be performed if the calibration curves are created using the SOBP, which has the same dose-averaged LET in measurements. The change in the LET in SOBPs is smoother than that in mono energetic carbon-ion beams, except for the distal edge. Therefore, the errors due to positioning may be smaller and the calibration curves may be more accurate.
4.3. Quenching of film darkness variation
The netODs in table 2 were measured by irradiating the films with a constant dose for each LET. The quenching of the variation in film darkness was determined by comparing these netODs.
First, we compared the films that were irradiated with a dose of 4 Gy for each LET. The LETs used here were calculated from the simulation. The netOD for an LET of 50 keV µm−1 was 9.2% lower than that for an LET of 28 keV µm−1. The netOD for an LET of 74 keV µm−1 was 8.8% lower than that for an LET of 50 keV µm−1. When the films were irradiated at the same dose, the variation of film darkness was quenched by increasing the LET. Then, the netODs obtained when different doses were irradiated on the films at LETs of 28 and 38 keV µm−1 were compared. When films irradiated at the LET of 38 keV µm−1, the respective netODs obtained for the films irradiated at 4, 8, and 12 Gy decreased by 5.2%, 4.5%, and 3.4% compared to those irradiated at the LET of 28 keV µm−1. The variation of the film darkness was quenched by increasing the dose. The film darkness variation was small at a high dose and high LET. If the film darkness variation is small, there may be no difference in the analysis. In some cases, the dose needs to be reduced, such as halved, instead of being increased.
In addition, this study suggested that there was an error in the position of the active layer. Here, a method for accurately irradiating the active layer will be examined. If the quenching of the film darkness variation is accurately estimated, the film darkness can be estimated to consider the dose, LET, and suppression based on the simulation. The point where the film was the darkest in the percentage depth-dose curve when irradiated with the same preset value can be determined. By irradiating the film with the same preset value while changing the depth in increments of 0.1 mm, the position where the active layer is accurately irradiated can be determined. Thus, it will be possible to reduce the position error of the active layer.
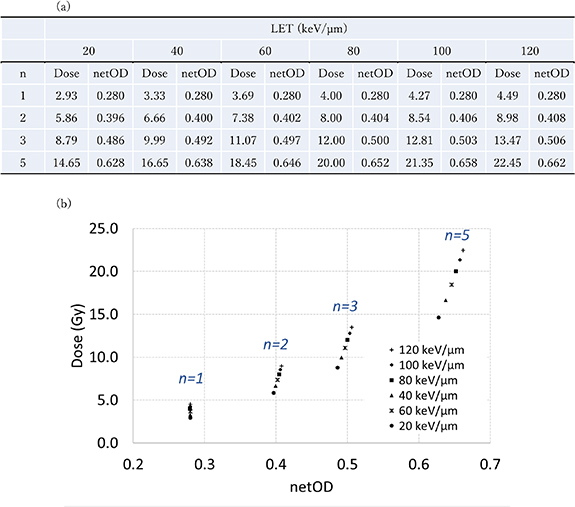
The film darkness depends on the LET and the dose. Therefore, netOD may take the same value even upon changing the LET and the dose. Using the netOD of the film irradiated with a dose of 4 Gy at an LET of 80 keV µm−1 as a reference, the same netOD can be observed for other LETs and doses. The results are summarized in figure 6(a), which shows the netOD when the dose was increased by factors of 2, 3, and 5. These results are calculated from the calibration curves. In addition, the data are plotted in figure 6(b). The proposed method analyzed a set of films irradiated at two or more preset values. As shown in figure 6(b), there is a substantial difference in the netOD values when the ratio n is large. In such a case, the accuracy of specifying the dose and the LET will increase. However, the darkness of the film saturates as the dose increases; therefore, the dose magnification should be performed with caution.
Figure 6. Comparison of the netOD and the dose when the reference netOD was the same. The netOD of the film irradiated with a dose of 4 Gy using 80 keV µm−1 LET carbon-ion beams was used as a reference. The dose was determined from the approximate equations so that the netOD with each LET was the same. In addition, the netODs were obtained from the doses by multiplying each dose by 2, 3, and 5, and these were compared. These data are summarized in a table (a) and displayed as a graph (b). The unit of the dose in (a) is Gy.
Download figure:
Standard image High-resolution image
5. Conclusions
A novel method was developed to simultaneously determine the dose and LET of carbon-ion beams. In the low LET region, the LET was determined with an error of ±10 keV µm−1. In addition, the estimated dose matched the simulated result with an error less than 3%. The novel method can compensate for the variation of film darkness caused by variations in LET, which has been a problem in previous studies.
Acknowledgments
This research was performed in the Research Project with Heavy Ions at the GHMC. We would like to thank the staff at the Accelerator Engineering Corporation and the GHMC for supporting the experiments, operating the accelerator in this research, and Editage (www.editage.com) for their writing support.