

Abstract
We computed normalized glandular dose (DgN) coefficients for mean glandular dose estimates in contemporary 2D mammography units, taking into account a homogeneous model for the breast which reflects recent literature reports. We developed a Monte Carlo code based on the simulation toolkit GEANT4 ver. 10.00. The breast was modelled as a cylinder with a semi-cylindrical section with a radius of 10 cm, enveloped in a 1.45 mm thick skin layer, as found out in recent reports in the analysis of breast computed tomography clinical scans. The compressed breast thickness was between 3 cm and 8 cm. The DgN coefficients were calculated for monoenergetic x-ray beams between 4.25 keV and 49.25 keV and were fitted with polynomial curves. Polyenergetic DgN coefficients were then computed for spectra obtained for various anode/filter combinations as adopted in routine clinical practice: Mo/Mo 30 µm (25–40 kV), Mo/Rh 25 µm (25–40 kV), Rh/Rh 25 µm (25–40 kV), W/Ag 50 µm (26–34 kV), W/Al 500 µm (26–38 kV), W/Al 700 µm (28–40 kV) and W/Rh 50 µm (24–35 kV). Monoenergetic DgN curve fit coefficients and polyenergetic DgNp coefficients were released for research and clinical work. Polyenergetic DgNp coefficients were 6% higher than those provided in the recent literature, on average. The differences range between −18% and 30%; up to 50% of the computed coefficients differed by less than 10%. The dataset of DgN coefficients are provided as tables for varying glandular fraction by mass and compressed breast thickness. Moreover, a computer code has been developed for generating user specific coefficients DgNp for user defined x-ray spectra up to 49 kV, calculated by spectral weighting from the dataset of monoenergetic DgN coefficients.
Export citation and abstract BibTeX RIS
1. Introduction
The reference quantity for dosimetry in 2D mammography is the mean glandular dose (MGD), i.e. the average dose absorbed in the glandular tissue of the breast undergoing the exam (Hammerstein et al 1979). The MGD is estimated in quality assurance (QA) procedures for mammographic units (IPEM 2005, European Commission 2006, IAEA 2011, ACR 2018, Gennaro et al 2018), as well as for image quality optimization and comparison (Hammerstein et al 1979, Geeraert et al 2015, 2016). The evaluation of the MGD in given setups is of interest when comparing 2D and 3D breast imaging techniques, such as digital breast tomosynthesis (Feng and Sechopoulos 2012, Bouwman et al 2015) and computed tomography (CT) dedicated to the breast (Sarno et al 2015). Although Hammerstein et al (1979) suggested the use of the energy absorbed in the glandular tissue, rather than the MGD, for radiation risk assessment, MGD is commonly adopted also for such a purpose (Yaffe and Mainprize 2011, Bosmans and Marshall 2013, Dance and Sechopoulos 2016).
The MGD for a specific mammographic exam and patient's breast can be estimated from the incident air kerma (K) measured at the entrance breast surface multiplied by pre-calculated coefficients, the normalized glandular dose coefficients (DgN) or (g, c, s) triad (Dance 1990, Wu et al 1991, Dance et al 2000). DgN and (c, g, s) coefficients are computed via Monte Carlo (MC) simulations; they depend on the breast dimension and composition, as well as on the beam quality (tube voltage, anode/filter materials and 1st half value layer—HVL). For coefficients computation via MC simulations, several assumptions about the breast anatomy and conformation are required in order to be representative of the 'average breast'. The breast model usually adopted for K-to-MGD conversion coefficients presents an outer layer simulating the skin envelope and it is made of a homogenous mixture of adipose and glandular tissue. Wu et al (1991) and Boone (1999) adopted a skin layer with a thickness of 4 mm in the calculation of such coefficients. Dance (1990) proposed to model the skin as a 5 mm thick adipose layer: those conversion coefficients are adopted in several QA protocols worldwide (IPEM 2005, European Commission 2006, IAEA 2011, ACR 2018, Gennaro et al 2018). On the other hand, patient scans obtained via CT dedicated to the breast permitted to investigate breast model parameters, such as the skin thickness and glandular tissue distribution, so providing an improvement in breast modelling and MGD estimates (Sechopoulos et al 2012, Hernandez et al 2015, Boone and Hernandez 2017, Sarno et al 2017a). From a cohort of high resolution 3D breast images, Huang et al (2008) showed that the breast skin layer presents a thickness of 1.45 mm, on average. Shi et al (2013) reached similar results (1.44 mm on average) from a separate breast cohort. Using such a reduced skin thickness in the breast models—instead of 4 mm or 5 mm skin thickness—had a significant impact on the MGD estimates in mammography (Huang et al 2008, Sarno et al 2016a, 2016b, Massera and Tomal 2018). A skin thickness of 1.45 mm has been already adopted in DgN calculation for MGD estimates in breast CT (Sechopoulos et al 2010, Mettivier et al 2015, Sarno et al 2018a).
In a series of previous papers using our MC code for x-ray breast dosimetry (Sarno et al 2016a, 2016b, 2017b, 2017c, 2018a), we studied different aspects of the commonly adopted models for breast dosimetry. In particular, we showed the influence of the skin model (thickness and composition) and of the homogeneous assumption of the breast tissue on the dose estimates (Sarno et al 2016b, 2017b, 2018a). As regards anatomically realistic breast models, in our previous paper (Sarno et al 2018a) we showed that MGD values estimated by means of a homogeneous breast model with a skin thickness of 1.45 mm were closer to those for realistic digital breast phantoms (with realistic silhouette and glandular tissue distribution) when compared to the results obtained for the homogeneous breast model with a 4 mm skin thickness adopted in Wu et al (1991) and Nosratieh et al (2015).
The above considerations highlight the interest in revising some aspects of the MDG calculation via MC simulation. In this work we intend to contribute to the field of x-ray breast dosimetry by providing DgN coefficients for mammography exams, calculated on the basis of the most recent literature findings. Specifically, DgN values reported in this work have been calculated considering a homogeneous breast model which approximates the characteristics of the real breast anatomy (skin thickness = 1.45 mm) (Huang et al 2008, Shi et al 2013, Sarno et al 2018a) with the incident air kerma on the breast surface calculated as in Sarno et al (2017c). The present work provides polyenergetic DgN (DgNp) for x-ray spectra commonly adopted in modern mammographic units and monoenergetic DgN curve fits parameters. DgN coefficients calculated in this work have been compared to those in Nosratieh et al (2015), which are the most recent reported in literature and are computed for the most recent used spectra. In order to ease the user implementation task for DgNp coefficients for user-specific arbitrary x-ray spectra, we produced an application which can be provided upon request to the corresponding author. The application returns the set of DgNp coefficients for given compressed breast thickness and for reference glandular fractions.
2. Material and methods
2.1. Breast model and irradiation geometry
The breast was modelled as a cylinder with a semi-circular cross section with a radius of 10 cm (Sarno et al 2016b). It was made of a homogeneous mixture of adipose and glandular tissue surrounded by a layer simulating the skin. Breast tissue and skin composition were those proposed by Hammerstein et al (1979) as reported in Boone (1999). The skin thickness was 1.45 mm, as shown in the most recent literature (Huang et al 2008, Shi et al 2013). Figure 1 shows the irradiation geometry adopted in this work.
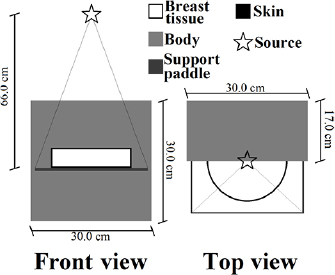
Figure 1. Scheme of the irradiation geometry adopted in this work. Lines from the source indicate the beam shape.
Download figure:
Standard image High-resolution imageThe breast compressed thickness (skin included) ranged between 3 cm and 8 cm with 1 cm steps, and the modelled breasts presented a glandular fraction by mass of 0.1%, 14.3%, 25.0%, 50.0%, 75.0% and 100.0%. The patient body was modelled as a box of water of size 30 × 30 × 17 cm3. In order to take into account the backscatter radiation from the breast support, this was modelled as a 0.2 cm thick PMMA plate (26 × 14 cm2) as used in Sechopoulos et al (2015). The compression paddle was not included (Sarno et al 2016b). The x-ray source was simulated as a monoenergetic and isotropic point source placed at 66 cm from the breast support at the chest-wall side, centered with respect to the breast support. In order to show the influence of the focal spot dimension on the estimated DgN, we run simulations for finite size focal spot of 0.3 × 0.3 mm2 square focal spot. The beam was collimated in order to irradiate a 26 × 14 cm2 surface at the breast bottom surface. The heel effect was not simulated.
2.2. Monte Carlo code
The Monte Carlo code used in this work was based on GEANT4 toolkit version 10.00 and employed the physic list Option4. It was validated versus data provided by AAPM TG195 cases 1–3 (Sechopoulos et al 2015). In particular for the validation case 3, where the MGD to the breast for monoenergetic and polyenergetic x-ray beams in mammography is simulated, our code showed a difference of less than 0.5% (Sarno et al 2016b). In Sarno et al 2016a, we reproduced the DgN coefficients reported in Boone et al (2002) with a difference of only 0.2%, on average. A further validation versus literature data was also provided in Sarno et al (2018c), where conversion factors for MGD calculation in digital breast tomosynthesis reported in Dance et al (2011) were reproduced with a difference lower than 0.4%. In addition, the MC code adopted in this work was also validated versus measurement data acquired with a laboratory scanner (Sarno et al 2018c).
The x-ray photoelectric, coherent and incoherent scatter interactions were simulated. Electrons with energy down to 990 eV were tracked. The MGD was calculated as follows:

where  is the energy released at the interaction event i, f g is the breast glandular fraction by mass, and Wb is the breast mass (skin excluded). The factor G (Boone et al 1999), dependent on the photon energy E, was evaluated as:

Here, µen/ρ is the energy-dependent mass energy absorption coefficient of glandular (subscript g) and adipose (subscript a) tissues, evaluated by considering the functional interpolation given by Fedon et al (2015). The G-factor was evaluated interaction-by-interaction, at the current energy of the interacting photon (Wilkinson and Heggie 2001). Finally, the DgN values were computed as:

where the incident air kerma, K, was calculated as follows (Sarno et al 2017c):

where Ei is the energy of the ith photon which passes through a scoring surface S, (µen/ρ)air is the mass energy absorption coefficient of the (dry) air obtained from the NIST database, and θi is the angle between the photon direction and the normal to S. No backscatter is taken into account in the K evaluation. The scoring region was a square of 3 × 3 cm2 and placed at 2 cm above the breast support and with its center at 4 cm from the patient-chest. The breast was not in place during the K calculation. The air kerma was rescaled to its value at the breast upper surface using the inverse square law. All simulations were performed with a monoenergetic x-ray beam ranging between 4.25 keV and 49.25 keV (0.5 keV step) and the computed values presented a statistical uncertainty lower than 0.1%, reached with 108–109 generated photons. Data in this work are shown in compliance with the recommendations of the AAPM Task group 268 (Sechopoulos et al 2018).
2.3. Monoenergetic DgN curve fit
In order to reduce the amount of the produced data, the DgN coefficient curves (as a function of the energy) were fitted with 8th order polynomial curves. The polynomial coefficients were computed via MATLAB R2017a (MathWork Inc.) and a least absolute residual method. The zero-order coefficients were forced to 0.
2.4. Polyenergetic DgN
Following Boone et al (2002), polyenergetic DgN coefficients (DgNp) were computed from the monoenergetic DgN values, via a spectral weighting procedure:

where ϕ(E) is the un-normalized spectrum at the entrance skin surface (photons/mm2) and ϑ(E) is the photon fluence to air kerma conversion factor (mGy · mm2/photons). For completeness, the x-ray spectra were computed first as in Boone et al (1997) (producing the Model #1 below), and then as in Hernandez et al (2017) (producing the Model #2), for comparison. The final DgNp provided in this work have been produced by means of the x-ray spectral models in Hernandez et al (2017), who provided the most recent spectral models. Table 1 shows the various spectra used in this work.
Table 1. Summary of the modelled spectra.
| Anode | Filter | kV | HVL range (mmAl) | Mammography unit manufacturer |
|---|---|---|---|---|
| Mo | 30 µm Mo | 25–40 | 0.35–0.44 | GE essential |
| Mo | 25 µm Rh | 25–40 | 0.39–0.46 | GE senobright low energy |
| Rh | 25 µm Rh | 25–40 | 0.36–0.54 | GE essential, GE senobright low energy |
| W | 50 µm Ag | 26–34 | 0.53–0.64 | Hologic dimensions, IMS Giotto Tomo |
| W | 500 µm Al | 26–38 | 0.39–0.56 | Philips microdose |
| W | 700 µm Al | 28–40 | 0.51–0.72 | Hologic dimensions |
| W | 50 µm Rh | 24–35 | 0.48–0.58 | Siemens mammomat, hologic dimensions, IMS Giotto Tomo |
In order to take into account the presence of the compression paddle (which was not simulated) we added a 2 mm thick polycarbonate (PC) layer (European Commission 2006) in the calculation of the x-ray source spectrum. The HVL values indicated in the table 1 are those calculated after the introduction of the compression paddle in the spectra computation. For the case of mammographic units with a PMMA compression paddle, we calculated the influence in the spectra shaping of a 2 mm thick PMMA added filter. There is no practical difference between the cases of PC or PMMA in the beam path (figure A1 in the appendix).
The HVL was calculated without taking into account the contribution of the x-ray scatter, so being consistent with the EU QA protocols (European Commission 2006, Gennaro et al 2018). For each anode/filter and tube voltage combination, two spectra were used with two different HVLs. They were tuned by changing the added filtration thickness. Since DgNp coefficients present a linear relation with the HVL beam (Wu et al 1991), this procedure will permit to estimate MGD in different mammography units which can present different HVL values. In addition, to ease the user handling of this coefficient datasets, we developed in MATLAB (MathWork Inc.) an executable program with a graphical user interface for the computation of DgNp coefficients for any given mammographic spectrum.
3. Results
3.1. Monoenergetic DgN
Figure 2 shows the computed monoenergetic DgN coefficients as a function of the photon energy, for a 14.3% glandular breast, with breast thickness from 3 cm to 8 cm. The supplementary material (stacks.iop.org/PMB/64/125012/mmedia) reports the fitting coefficients for monoenergetic DgN for breasts with thickness ranging between 3 cm and 8 cm and for glandular fraction by mass (skin excluded) of 0.1%, 14.3%, 25.0%, 50.0%, 75.0% and 100.0%. Due to boundary condition, the fitting curves are usable only in the photon energy range 8–49 keV. Percent ratio between DgN calculated for an isotropic point source and those for a 0.3 × 0.3 mm2 square source for monoenergetic beam ranging between 8 keV and 49 keV is reported in appendix (figure A2). The simulated breast presented 25.0% glandular fraction by mass and a compressed breast thickness of 5 cm. The differences are negligible and it resulted smaller than the MC statistical uncertainty for the investigated energy range.
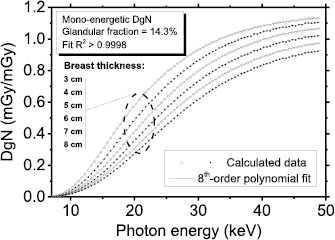
Figure 2. Monoenergetic DgN curves for a 14.3% glandular fraction. The curves were well fitted with 8th-order polynomials (R2 > 0.9998).
Download figure:
Standard image High-resolution image3.2. Spectral model 1
Figure 3 shows polyenergetic DgN coefficients for Mo/Mo spectra at 25 kVp (figure 3(a)) and at 35 kVp (figure 3(b)) computed in this work by means of the spectral model indicated in Boone et al (1997). For comparison, coefficients provided in Nosratieh et al (2015) are also shown. In all the cases shown in figure 3, the coefficients calculated in this work had the highest values, and the differences reduce for higher tube voltages (figure 3(b)). Figure 4 shows DgNp coefficients evaluated within this work versus those in Nosratieh et al (2015), for several HVL ranges. Although the breast models are different, small differences in the DgN values were present between this work and Nosratieh et al (2015). As expected, the linear fits indicate that the discrepancies are smaller for higher HVLs, since the impact of the breast model reduces for more penetrating x-ray beams (Sarno et al 2016b). The DgNp coefficients computed in this work by adopting the spectral model in Boone et al (1997), are 5% higher than those in Nosratieh et al (2015), on average (figure 5). The differences extend up to 27% (data in Nosratieh et al (2015) taken as reference), and in about 25% of the cases, the values of this work are lower than those in Nosratieh et al (2015) (figure 5).
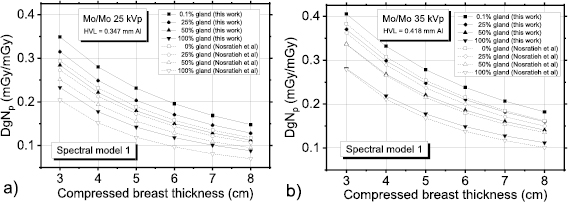
Figure 3. DgNp coefficients computed within this work (spectral model from Boone et al (1997)) and those in Nosratieh et al (2015), for Mo/Mo (a) 25 kVp and (b) Mo/Mo 35 kVp spectra.
Download figure:
Standard image High-resolution image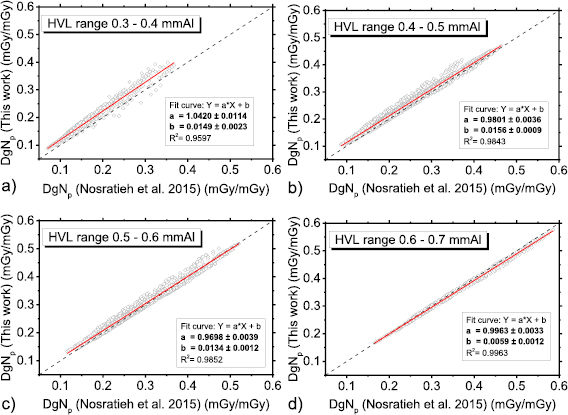
Figure 4. DgNp coefficients evaluated in this work (spectra from Boone et al (1997)) versus those in Nosratieh et al (2015), in the HVL range 0.3–0.4 mmAl (a), 0.4–0.5 mmAl (b), 0.5–0.6 mmAl (c) and 0.6–0.7 mmAl (d). The red line is a linear fit to the data, while the dashed line indicates the unit slope, zero intercept line.
Download figure:
Standard image High-resolution image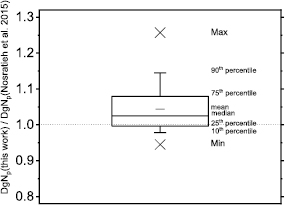
Figure 5. Ratio between polyenergetic DgN evaluate in this work (skin thickness = 1.45 mm; spectra computed following Boone et al (1997) and those reported by Nosratieh et al (2015).
Download figure:
Standard image High-resolution imageFigure 6 shows the DgNp coefficients as a function of the beam HVL, calculated for 28 kVp tube voltage and for given breast and anode/filter combinations—Mo/Mo (figure 7(a)) and W/Al (figure 7(b)). The HVL was varied by varying the thickness of the added filter. Linear fits to the data points (R2 > 0.999) confirmed that the DgNp coefficients have a linear dependence on the beam HVL, when all the other parameters are fixed.
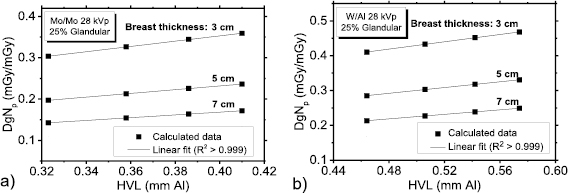
Figure 6. DgNp coefficients calculated at 28 kVp as a function of the HVL for (a) Mo/Mo spectra and (b) W/Al spectra.
Download figure:
Standard image High-resolution image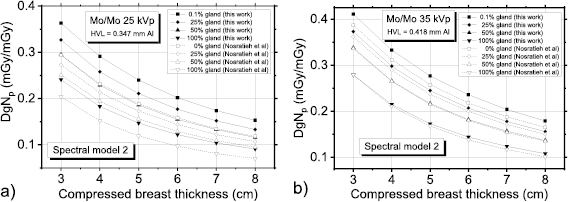
Figure 7. DgNp coefficients computed within this work (spectral model from Hernandez et al (2017)) and those in Nosratieh et al (2015), for Mo/Mo (a) 25 kVp and (b) Mo/Mo 35 kVp spectra.
Download figure:
Standard image High-resolution image3.3. Spectral model 2
The figure 7 compares polyenergetic DgN coefficients provided in Nosratieh et al (2015) to those computed in this work for Mo/Mo spectra at 25 kVp (figure 7(a)) and 35 kVp (figure 7(b)). These coefficients have been computed by adopting the spectral model proposed in Hernandez et al (2017). In this comparison, we observed that DgNp coefficients calculated in this work were systematically higher, the differences reducing for increasing tube voltages (figure 7(b)).
Figure 8 shows DgNp coefficients evaluated in this work by means of the spectral model proposed in Hernandez et al (2017), versus those in Nosratieh et al (2015), for several HVL ranges. The differences decrease as the beam HVL increases. Indeed, the DgNp coefficients computed in this work are about 10% higher (linear fit curve slope of about 1.10 in figure 8(a)) than those in Nosratieh et al (2015) in the HVL range 0.3–0.4 mmAl; these differences reduce to about 1% for HVL ranges on 0.5–0.6 mmAl and 0.6–0.7 mmAl. On average, our coefficients are 6% higher than those in Nosratieh et al (2015); this difference ranges between −18% and 30%, for the compared cases (figure 9). About 50% of DgNp coefficients computed in this work differed from those in Nosratieh et al (2015) by less than 10%, while 10% of the computed coefficients are at least 20% higher than the latter (figure 9).
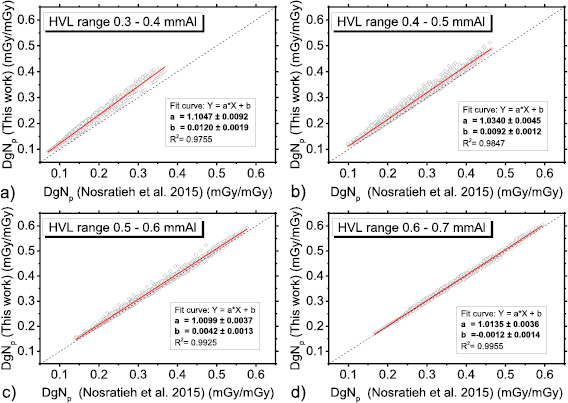
Figure 8. DgNp coefficients evaluated in this work (spectra from Hernandez et al (2017)) versus those in Nosratieh et al (2015), in the HVL range 0.3–0.4 mmAl (a), 0.4–0.5 mmAl (b), 0.5–0.6 mmAl (c) and 0.6–0.7 mmAl (d). The red line is a linear fit to the data, while the dashed line indicates the unit slope, zero intercept line.
Download figure:
Standard image High-resolution image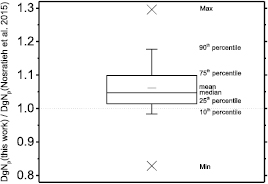
Figure 9. Ratio between DgNp coefficients evaluated in this work (skin thickness = 1.45 mm; x-ray spectra computed following Hernandez et al (2017) and those reported by Nosratieh et al (2015).
Download figure:
Standard image High-resolution imageIn order to compare the spectral models, figure 10 shows the ratio between the DgNp coefficients calculated in this work, by adopting the spectral model in Hernandez et al (2017) divided by those evaluated by adopting the spectra in Boone et al (1997). More than 80% of the compared data differ by less than 5% in absolute terms.
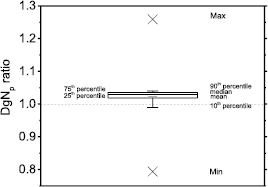
Figure 10. Ratio between DgNp coefficients calculated from x-ray spectra in Hernandez et al (2017) and those calculated by adopting the spectra modeled in Boone et al (1997). Skin thickness = 1.45 mm.
Download figure:
Standard image High-resolution imageFigure 11 shows DgNp coefficients for a W/Al spectrum (HVL = 0.546 mmAl) and 25% breast glandularity. Here, the coefficients determined by Nosratieh et al (2015) are plotted together with those computed in this work with the spectra modelled following Hernandez et al (2017). For comparison, in order to reproduce the breast model of Nosratieh et al (2015), we have also modelled the breast with a skin thickness of 4 mm (made of skin tissue). As for the spectral model of the previous paragraph, the DgNp coefficients calculated by simulating the skin with a thickness of 1.45 mm do not differ significantly from those in Nosratieh et al (2015). On the other hand, when the skin is modelled with a thickness of 4 mm, as done in this last case, the discrepancies are larger. However, it is worth noting that in Nosratieh et al (2015) the 4 mm thick skin layer composition of the breast model is the same as the inner breast portion and its thickness was tuned in order to present the same attenuation as in the case of 4 mm skin with a real breast composition.
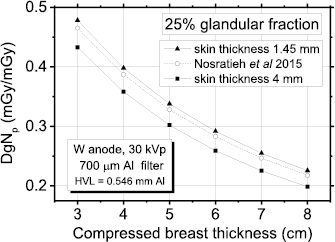
Figure 11. Polyenergetic DgN evaluated in this work for a skin thickness of 1.45 mm and 4 mm and those in Nosratieh et al (2015); breast glandularity 25%.
Download figure:
Standard image High-resolution imageThe DgNp coefficients for all the spectra contained in table 1 are available by request to the corresponding author. They have been computed for compressed breast thickness ranging between 3 cm and 8 cm and breast glandular fraction by mass of 0.1%, 14.3%, 25.0%, 50.0%, 75.0% and 100.0%, and by adopting the spectral model presented in Hernandez et al (2017).
3.4. DgNp calculation for arbitrary spectrum
We developed a Windows-based application for deriving spectrally weighted DgNp coefficients calculated for arbitrary x-ray spectra. User input via a specific graphical user interface are the breast glandular fraction by mass, the compressed breast thickness and an arbitrary x-ray spectrum whose tabular entries (photon energy, intensity) are uploaded from the user storage. The DgNp coefficients are calculated using the monoenergetic DgN curve fits produced in this work (supplementary material), based on a breast model which includes a skin thickness of 1.45 mm. Spectra produced with a tube voltage up to 49 kV can be entered.
4. Discussion
Estimation of the MGD in a mammography exam is a fundamental process for mammography QA and dose optimization, in addition to 'average patient' dose assessment. To this purpose, the development of suitable breast models and the use of an MC code for DgN computation, is a necessary step. The availability of breast CT images from clinical scanners dedicated to the breast have permitted to improve the previously developed breast models for breast dosimetry by taking into account realistic breast shapes and heterogeneous glandular tissue distributions, as well as to better clarify the role of the skin thickness (Boone et al 2017, Massera and Tomal 2018). Indeed, from high resolution clinical 3D breast images the average skin thickness of the breast was shown to be 1.45 mm, on average, i.e. much less than 4–5 mm as in the breast models adopted for the MGD estimates. This new assumption presented a huge impact on the breast dose estimates: adopting a skin thickness of 4 mm instead of the experimentally confirmed 1.45 mm thickness led to MDG underestimates up to 30% for contemporary adopted spectra (Sarno et al 2016b). In addition, when compared to digital breast phantoms with realistic anatomy and heterogeneous glandular distribution, the 1.45 mm skin model permitted to reproduce MGD estimates better than with a breast model involving a 4 mm skin thickness (Sarno et al 2018b). In this respect, we also note that the AAPM/EFOMP joint Task Group 282 is revising the paradigms for MGD estimates aiming '... to develop and disseminate a new model and corresponding methodology to estimate the breast average glandular dose (AGD) from x-ray based image acquisitions including standard mammography, contrast-enhanced mammography, and breast tomosynthesis'6.
In this work we produced new monoenergetic and polyenergetic DgN coefficients on the basis of a simple breast model which assumes a homogeneous distribution of the glandular mass, assuming a skin layer with a thickness of 1.45 mm and a composition as provided by Hammerstein et al (1979). We produced a dataset of monoenergetic DgN coefficients for MGD estimation in mammography; polyenergetic DgNp coefficients have been computed for several spectra routinely adopted in clinical practice. The data of monoenergetic DgN versus photon energy have been fitted with 8th-order polynomial curves and fit coefficients are reported in the supplementary material. This will permit to evaluate polyenergetic DgNp coefficients for spectra which are not included in this paper, as well as for those particular mammography applications where monoenergetic x-ray beam are adopted (Longo et al 2014). For each anode/filter combination and tube voltage, the DgNp coefficient was computed for two HVL values. Due to the linear dependence between HVL and DgNp coefficients, additional values can be calculated by interpolating the DgNp values here provided on the basis of the estimated HVL of the specific mammographic unit. It is worth to note that we did not simulate the heel effect. Indeed, the beam modulation and the spectral modulation due to the anode absorption as function of the irradiation angle have not been considered. However, the beam intensity distribution at the breast and at the detector surface could largely vary on the basis of the considered mammographic unit and a thorough characterization would be necessary (Sechopoulos et al 2007), for future implementation in upgraded MC codes for MGD estimations.
A computer code has been developed for generating DgNp coefficients on the basis of user-specific spectra and a model which includes a skin thickness of 1.45 mm. Such a code computes the DgNp from the monoenergetic DgN values computed in this work, with corresponding polynomial fit coefficients reported in supplementary material.
Monoenergetic and polyenergetic DgNp coefficients have been provided for a range of compressed breast thicknesses between 3 cm and 8 cm and for various breast glandular fractions; they have been compared with those in the recent literature (Nosratieh et al 2015). When we compared our MC results with that of Boone et al (2002) we found a difference in DgN of only 0.2%, on average (Sarno et al 2016a). Nosratieh et al (2015) used the same DgN coefficients reported in Boone et al (2002). Hence, the differences that we found between our DgNp and those in Nosratieh et al (2015) can be mostly attributed to the differences in the adopted models.
5. Conclusions
We provided DgN coefficients for MGD estimation in mammography. They have been calculated for spectra today used in mammographic units (DgNp). In addition, monoenergetic DgN fitting curves were calculated and fitting parameters have been tabulated. We modeled the breast as a homogeneous mixture enveloped in a layer simulating the skin with a thickness of 1.45 mm, as recently reported from clinical breast CT scans. The comparison between our DgNp coefficients and those reported in the most recent literature showed a discrepancy up to +6%, on average, with minimum and maximum differences of −18% and +30%, respectively. To facilitate the calculation of polyenergetic DgNp coefficients for arbitrary spectra, we developed and made available a computer code which performs spectral weighting of the monoenergetic DgN coefficients calculated up to 49 keV. The tabulated DgNp coefficients and the weighting application are available by request to the corresponding author.
Acknowledgments
This work is supported by the Istituto Nazionale di Fisica Nucleare project 'MC-INFN'.
Appendix
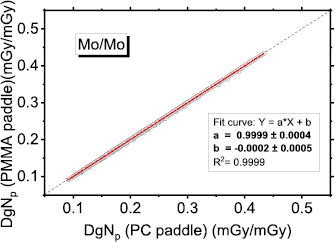
Figure A1. DgNp coefficients evaluated for PC paddle used in the spectra calculation and those obtained for PMMA paddle (spectra from Hernandez et al (2017)). The continuous red line is a linear fit to the data, while the dashed line indicates the unit slope, zero intercept line.
Download figure:
Standard image High-resolution image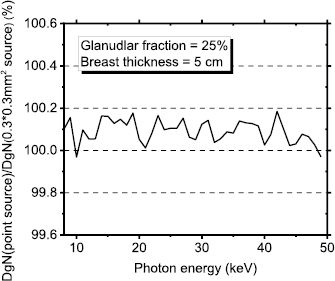
Figure A2. Percent ratio between DgN calculated with an x-ray point source and those for a 0.3 × 0.3 mm2 square source.
Download figure:
Standard image High-resolution image