
Abstract
With the advent of MRI-guided radiotherapy, the suitability of commercially available radiation dose detectors needs to be assessed. The aim of this study was to investigate the effect of the magnetic field (B-field) on the response of the Gafchromic EBT-3 films. Moreover, as an independent study, we contribute to clarifying the inconsistency of the results of recent published studies, on the effect of B-field on the sensitivity of Gafchromic films.
A 60Co beam was used to irradiate film samples in an electromagnet. An in-house PMMA phantom was designed to fit in the 5 cm gap between the two poles of the magnet. The phantom consists of two symmetrical plates where a film can be inserted. The absorbed dose rate of the 60Co beam for zero B-field was measured using alanine pellets in a Farmer-type holder. A 12-point response curve was created, representing  as a function of dose, for each of five different B-field strengths (0 T to 2 T).
This study finds that there is at most a small effect of the magnetic field on the response of EBT-3 film. In terms of netOD (red channel) the change in response varied from ‒0.0011 at 0.5 T to 0.0045 at 2.0 T, with a standard uncertainty of 0.0030. If uncorrected, this would lead to an error in film-measured dose, for the red channel, of 2.4% at 2 T, with a standard uncertainty on dose of 1.4%. Results are also presented for B-field strengths of 0.5 T, 1 T and 1.5 T, which are all zero within the measurement uncertainty. Comparison between other studies is also presented.
Considering the small change on dose determined with EBT-3 when irradiated under the presence of B-field and taking into account the overall uncertainty in dosimetry using EBT-3 film achieved in this work, EBT-3 is assessed to be a suitable detector for relative and absolute dosimetry, with appropriate corrections, in MRI-guided radiotherapy. The results of the current work also elucidate the inconsistency on the reports from previous studies and demonstrate the necessity of similar investigations by independent teams, especially if the existing results may be in conflict.
Export citation and abstract BibTeX RIS

Original content from this work may be used under the terms of the Creative Commons Attribution 3.0 licence. Any further distribution of this work must maintain attribution to the author(s) and the title of the work, journal citation and DOI.
1. Introduction
Recent progress in MRI-guided radiotherapy includes the integration of a linear accelerator (Linac) with a magnetic resonance imaging (MRI) scanner. MRI-Linacs provide real-time imaging during patient treatment and greatly enhanced soft-tissue image contrast, while completely avoiding radiation dose associated with x-ray imaging (Lagendijk et al 2008, Raaymakers et al 2009).
While great benefits for cancer treatment are anticipated using this new technology, the external magnetic field (B-field) affects conventional dosimeters and dose distributions. Currently, there are no available protocols that can provide traceability for reference dosimetry and there is no guidance available for performing measurements of the radiation field characteristics. Furthermore, experimental techniques to measure the commissioning data required for treatment planning systems (TPS) need to be adapted for the context of MRI-guided radiotherapy (MRIgRT). Indeed, detector specifications are crucial to correctly measure input data for TPS, such as beam profiles and depth doses, since the presence of a B-field is known to perturb the detector dose response (Meijsing et al 2009, Reynolds et al 2013, Smit et al 2013, O'Brien 2016). In this context, the performance of suitable detectors under the influence of a B-field needs to be characterised. Detector suitability will then be defined by the ability to capture electrons affected by the Lorentz force in a medium and consequently the distorted lateral beam profiles and depth dose curves. Among available detectors that could fulfil such conditions, radiochromic film is a promising candidate.
Radiochromic film is a useful tool for relative dosimetry (measurements of the radiation field characteristics) and reference dosimetry (Girard et al 2012, Devic et al 2016, Billas et al 2017). It has high spatial resolution and a large measurement area suitable for validation of 2D dose maps. It is known to be almost water equivalent (Niroomand-Rad et al 1998) and shows small energy dependence (Devic et al 2004, Arjomandy et al 2010). Radiochromic film is used in advanced radiotherapy modalities (such as stereotactic radiosurgery (SRS) (Palmer et al 2015b, Dimitriadis et al 2017), intensity modulated radiotherapy (IMRT) (Sankar et al 2006, Low et al 2011), etc) that require complex quality assurance (QA) and verification methods for radiation dosimetry. It is also used for end-to-end dosimetry audits where the whole treatment chain as experienced by a patient is considered (Clark et al 2015, Palmer et al 2015a). Radiochromic film has shown that it is a promising candidate for the detection of the affected lateral profiles and depth dose curves due to the B-field in MRIgRT systems (Crijns et al 2011, 2012, Smit et al 2014). It has also been demonstrated that radiochromic film is a good detector for capturing the electron return effect (Raaijmakers et al 2005, 2007), which increases the dose at tissue-air boundaries.
Recent studies (Reynoso et al 2016, Roed et al 2017, Barten et al 2018, Delfs et al 2018) have investigated the performance of EBT-2 and EBT-3 films in different B-field strengths, at different orientation of the reference film edge with respect to the B-field, with and without real-time MR imaging and using different beam energies. Contradicting data were published by various authors and these will be covered in more detail in discussion. Briefly, the peer reviewed work by Reynoso et al (2016) investigated the effect of a 0.35 T B-field strength on EBT-2 film, using a 60Co energy beam, and they found that the dose was changed by up to 15%. A study by Roed et al (2017) examined the effect of a 1.5 T B-field strength on EBT-3 film using the same energy beam as Reynoso et al (2016) (60Co) and their results show a change on dose ranging from 1% to 3%. Delfs et al (2018) studied the effect of B-field strength (0.35 T and 1.42 T) on EBT-3 film. Although they used a different energy beam (6 MV) from Reynoso et al (2016) and Roed et al (2017), they report a dose change of 2.1%. A recent study by Barten et al (2018) investigated the response of EBT-3 film sheets at different angles to a B-field in a 60Co unit with an integrated 0.35 T MRI system by VIEWRAY (MRIdian). They compared to equivalent measurements at a 6 MV conventional linac (0 T) and they found a change of 0.9%.
The Gafchromic EBT-2 production has been discontinued and its next generation, EBT-3, differs in its structure (symmetrical polyester layers in order to eliminate errors on the scanning orientation) and the surface (matt surface to prevent Newton rings). However, both EBT-2 and EBT-3 films feature the same composition in the sensitive layer (Reinhardt et al 2012, Moylan et al 2013) and any change due to the B-filed is expected to be similar.
Considering the need for a suitable detector to perform relative and absolute dosimetry in MRI-linac systems and the apparent inconsistencies between results from some recent publications (specifically between Reynoso et al (2016) and Roed et al (2017) that used same energy beam) on the effect of the B-field on radiochromic film signal, the aim of this study is to independently investigate the effect of the B-field on the response of the Gafchromic EBT-3 films at different magnetic strengths and clarify the contradiction between the findings of different published studies.
2. Materials and methods
2.1. Experimental setup
The experimental setup (figure 1) involved irradiation of Gafchromic EBT-3 film in an electromagnet (GMW type 3474-140) using a 60Co beam (Theratronics, Theratron 780c). The distance from the 60Co source to the centre of the magnetic poles (measurement point) was 162 cm. An in-house polymethyl methacrylate (PMMA) phantom, 5 cm width and 26 cm height, was designed to fit inside the 5 cm gap between the two poles of the magnet (as shown in figure 1), which provide a maximum B-field strength of 2 T. The phantom consisted of two symmetrical PMMA plates, each at a water equivalent depth of 1 cm, placed in front of and behind the film, and located so that the central axis of the film is placed in the centre of the two magnetic poles. The edge of the film was orientated parallel to B-field, along the x-axis, and perpendicular to radiation beam, in direction of the z-axis (figure 1). The B-field uniformity in an area of 3 × 3 cm2 along the centre of the two magnetic poles (in z and y direction) was found to be within ±0.5 mT.
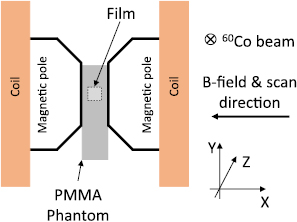
Figure 1. Schematic front view of the experimental setup. EBT-3 film placed between two PMMA plates in the centre of the two magnetic poles of the electromagnet. The edge of the film and the scanning direction are orientated parallel to B-field and its surface perpendicular to radiation beam.
Download figure:
Standard image High-resolution image2.2. Output measurements
Output measurements were made using alanine/EPR dosimetry, calibrated in terms of absorbed dose to water and traceable to the NPL primary standard, to determine the absorbed dose rate of the 60Co beam at zero B-field. Nine alanine pellets, 2.5 mm height and 5 mm diameter, placed in a Farmer type (F-type) holder were used in a similar phantom to the one adopted for film dosimetry. Alanine was chosen due to non-standard condition of our experimental setup (such as field size and scatter conditions in the restricted space between the poles of the electromagnet). The phantom was built from a PMMA block, 2 cm × 5 cm × 26 cm, with a hole drilled into the insert to take an alanine F-type holder which could be fitted perpendicular to the direction of the radiation beam. The film and alanine phantoms were constructed to place the film and alanine reference points at the same measurement point.
2.3. Effect of B-field on absorbed dose to water at 60Co beam quality
Although the effect of a B-field is more pronounced in air cavities, it also modifies the distribution of dose in water. A study by O'Brien et al (2016), including Monte Carlo calculation of depth-dose curves at 0 T and 1.5 T with an ELEKTA MR-linac beam quality (7 MV), has shown that the 1.5 T field systematically decreases the dose by 0.5% at depths beyond  . The effect of a B-field on dose to water, needs to be taken into account and corrected for.
In the current work, 60Co absorb dose to water was calculated in B-field strengths up to 2 T using the usercode cavity that forms part of the EGSnrc Monte Carlo system (Kawrakow et al 2011) (development version: GitHub: Aug 2017). The simulation used a water phantom to represent the PMMA phantom, with water equivalence defined by scaling depth inversely with electron density. Dose was scored in slabs of 0.05 cm thick and 1 cm wide up to a depth of 2 cm.
2.4. Film response curve
Films were prepared, scanned and analysed by using the method developed by Bouchard et al (2009). Briefly, 12 pieces of EBT3 films (3.5 cm × 3.5 cm), cut from one sheet of film, were used to generate a calibration curve. Each piece maintained the same orientation as the original short dimension of the film (landscape orientation) and placed parallel to the B-field during irradiation and parallel to scanning direction during digitisation. The film orientation and alignment was kept consistent throughout the measurements.
The radiation field filled the gap between the two magnetic poles and the source-to-surface distance was set at 161 cm. Films were irradiated at a depth of 1 cm (a sufficient amount of PMMA was used to provide charged particle equilibrium) and the maximum dose given at each B-field was approximately 825 cGy. A region of interest of 2.5 cm × 2.5 cm was analysed for each film in order to obtain the  , where
  is the difference between the optical density (OD) after and before irradiation. The film response curve is defined as
  as a function of dose.
2.5. Film digitisation
The films were digitised with an EPSON Expression 10000XL Pro flat-bed colour scanner in transmission mode. Coloured images were acquired with a spatial resolution of 150 dpi with 48 bit RGB and all scanner colour corrections turned off. A frame was used to position the films at an area of the scanner bed which could correct OD readings for scanner light non-uniformity (Saur and Frengen 2008). The orientation of all films was kept constant and aligned within ±5° to avoid any effect due to polarised light. A 3.5 mm PMMA sheet was placed on top of the films during digitisation in order to position the films flat on the scanner bed. The scanner warming-up effect was diminished by using ten repeated scans. Films were scanned before, to account for background correction, and 48 h after irradiation in order to allow the film optical density to stabilise (Cheung et al 2005).
2.6. Film uncertainty
In a measurement of absorbed dose, the additional uncertainty5 introduced by using film arises from two sources: (i) the variations in film response from pixel to pixel within each ROI, which was determined using the method of Bouchard et al (2009), and (ii) the variations in response between ROIs on different pieces of film (in particular, the film used for measurement, compared with the films used for calibration), which was determined from a statistical analysis of repeated film measurements with 40 degrees of freedom.
3. Results
3.1. Effect of B-field on absorbed dose to water at 60Co beam quality
Figure 2(a) shows the MC calculated 60Co depth-doses for 0 T and 1.5 T B-field strengths and the ratio, dose from B-field of 1.5 T ( ) divided by the dose in zero B-field (
 ), on the right y -axis. It can be observed that for a B-field of 1.5 T the surface dose is enhanced by 13% and the
  position is shifted closer to the surface by 0.05 cm. No effect was observed on the dose of
  between the two B-field strengths. Figure 2(b) shows the ratios of calculated dose in water with and without B-field as a function of a B-field strength. The ratios were determined from the average ratios between the depths of 0.5 cm and 1.7 cm and it was found to change by ‒0.08% per T when a linear model is fitted. Based on this change, the dose values of the EBT-3 calibration curve at each B-field strength were adjusted to account for the effect of the B-field on dose to water. The electron return effect could also be visible after a depth of approximately 1.7 cm.
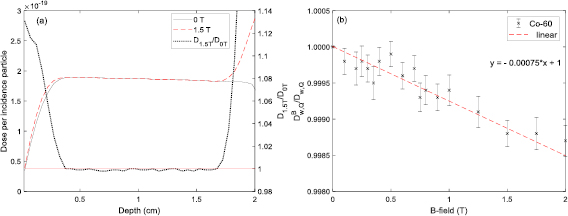
Figure 2. MC calculated 60Co depth doses for 0 T and 1.5 T and their dose ratio (shown on the right y -axis) (a). Ratios of dose with and without B-field at different strengths (b).
Download figure:
Standard image High-resolution image3.2. Effect of B-field on EBT-3 signal
In this work we have analysed the red, green and blue channel. However, we present selected results in graphical form, but mostly for the red channel only, as this is the channel which is usually used for single channel film dosimetry.
The EBT-3 film response curves (expressed in terms of  as a function of dose) for the red channel for all B-field strengths considered in this study are shown in figure 3. The maximum spread between all the B-fields for the red channel is also presented on the right y -axis of the same figure. For dose values greater than 75 cGy the maximum spread is 2.6% for the red channel, 3.5% for the green channel and 4.2% for the blue channel.
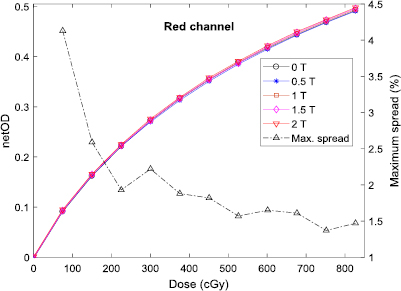
Figure 3. EBT-3 film response curves for all B-fields for the red channel. The maximum spread is presented on the right y-axis.
Download figure:
Standard image High-resolution imageTable 1 shows the average absolute difference (in percent) of all dose levels between the response curves irradiated with and without a B-field. The difference is presented for each B-field and each colour channel.
Table 1. Average absolute difference for red, green and blue channel. 
| Channel | 0.5 T (%) | 1.0 T (%) | 1.5 T (%) | 2.0 T (%) |
|---|---|---|---|---|
| Red | 0.5 | 0.9 | 0.8 | 1.6 |
| Green | 0.8 | 1.2 | 1.2 | 2.1 |
| Blue | 1.2 | 1.6 | 0.8 | 0.7 |
We define  to be the difference between the
  with and without a B-field:

Figure 4 shows  as a function of dose, for each B-field and for the red channel only. The error bars denote the standard uncertainty in
  . The maximum
  was found to be 0.006 for the red and green channels and −0.003 for the blue channel. Figure 4 shows that
  does not have a strong dependence on dose. Similar results were observed for the green and blue channels.
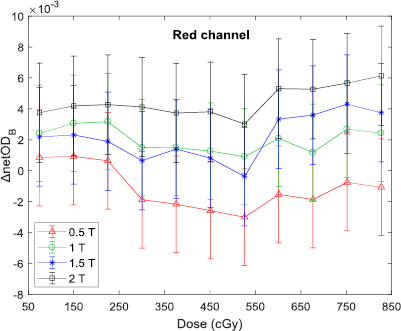
Figure 4.  for each B-field strength as a function of dose for the red channel only. Error bars represent statistical uncertainties calculated with the technique described in the previous section.
Download figure:
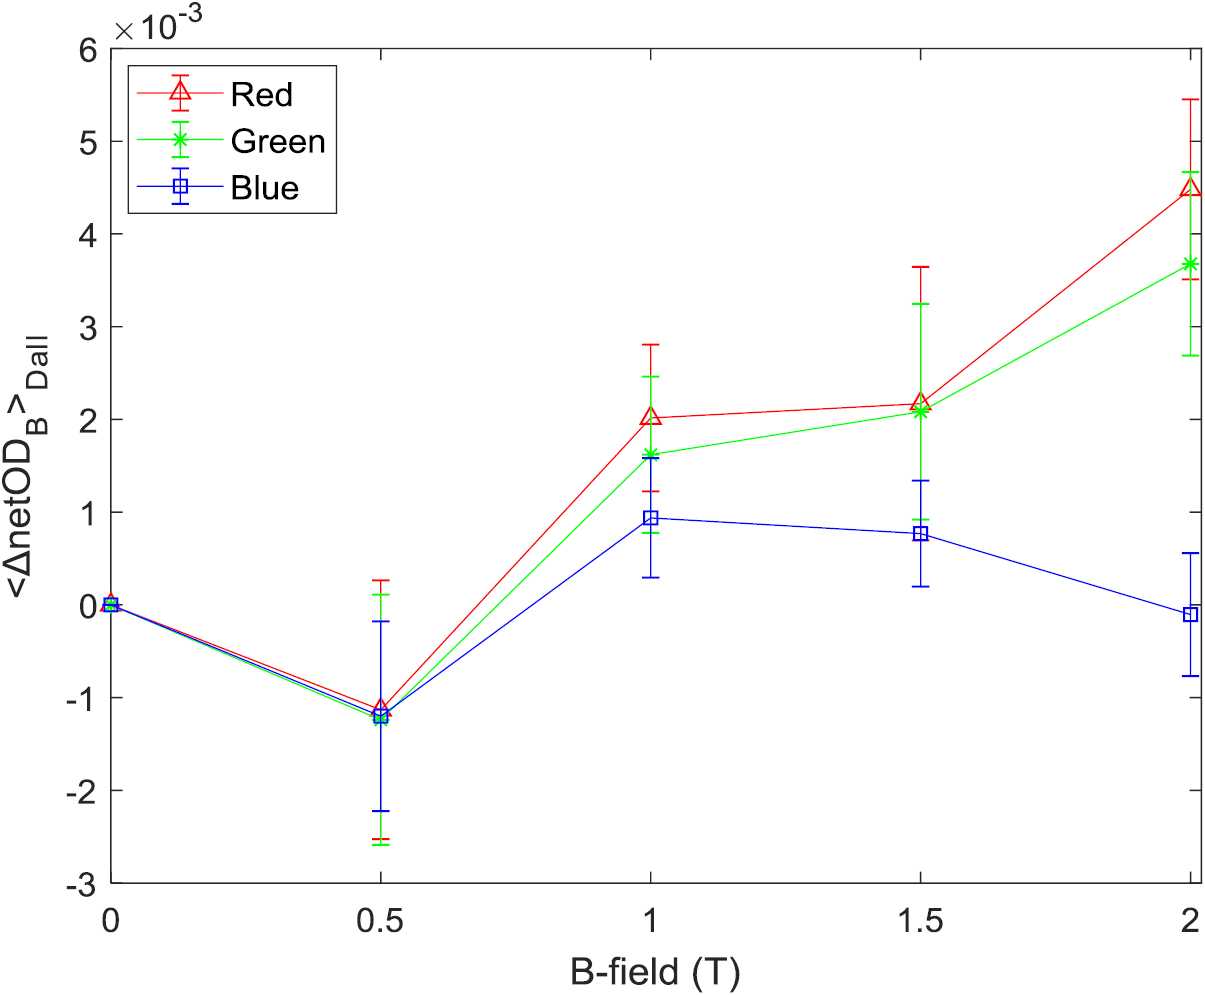
Standard image High-resolution imageIt appears that  does depend on the B-field strength, being typically negative at 0.5 T and positive at 1 T and above. This effect is shown more clearly in figure 5, which depicts the average
  over all dose levels,
  , as a function of B-field strength, for each channel.
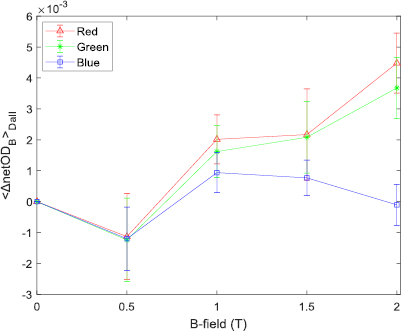
Figure 5.  as a function of B-field strength. Error bars represent the standard deviation of the distribution of the averaged
  values.
Download figure:
Standard image High-resolution image3.3. Effect of B-field on dose determined with EBT-3 film
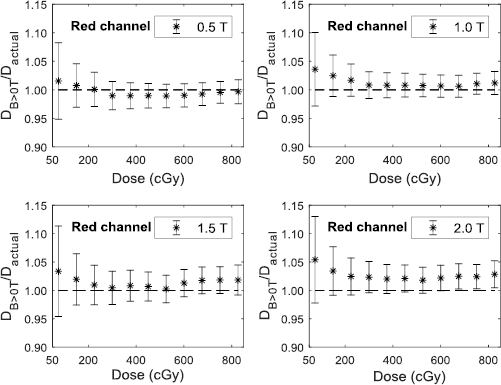
The effect of the B-field on dose measured using EBT-3 films is shown in figure 6. The calibration curve, based on films irradiated at zero B-field, was used to obtain absorbed dose from films irradiated at non-zero B-field, which would be valid if the B-field has no effect on film response. Figure 6 shows the ratios, dose obtained from non-zero B-field films (using red channel) divided by the dose actually delivered. The delivered dose value takes account of the small effect of the B-field on dose to water, which was calculated by MC. The extent to which these ratios are significantly different from unity indicates the effect of the B-field on the film response. For all B-field strengths the ratios decrease with dose, up to 225 cGy. Such behaviour would be accounted for by the inability of a fourth order polynomial to adequately represent film response at low dose. For values above 225 cGy, the ratios as a function of dose do not follow a simple trend and are somewhat scattered. Indeed, all ratios below 2 T are unity within the uncertainties.
Figure 6. Ratios of dose, with combined standard uncertainties, obtained (using the red channel) from films irradiated in non-zero B-field divided by the dose actually delivered.
Download figure:
Standard image High-resolution image
Taking averages over all dose values above 75 cGy, the mean ratios are 0.994 ± 0.024 (0.5 T), 1.011 ± 0.023 (1 T), 1.012 ± 0.028 (1.5 T) and 1.024 ± 0.026 (2 T).
4. Discussion
The performance of the EBT-3 film in the presence of a B-field, has been investigated at different dose levels and over a range of B-field strengths. A 60Co unit was used to irradiate film pieces placed between the poles of an electromagnet and the film response as a function of dose was obtained at five different field strengths. MC simulations were performed to determine the effect of a B-field on dose to water at the position of the film, and this effect was included in the analysis. The results show that there is at most a weak dependence of film sensitivity on magnetic field strength. At the smallest field strength (0.5 T), the film was found to under respond, while for field strengths of 1 T and above there was an over response. In terms of netOD (red channel) the under response was ‒0.0011 and the over response was up to 0.0045 at 2.0 T, with a standard uncertainty of ±0.0030. Similar results were observed for the green and blue channels. If this effect remains uncorrected, the error in a film measurement of absorbed dose (using the red channel) would vary from ‒0.6% at 0.5 T up to 2.4% at 2 T. The error at 1.5 T would be 1.2%. The standard uncertainty on this dose error is ±1.4%, which is the contribution to a measurement of absorbed dose to water which arises from the use of film.
For the dose levels typically measured with EBT-3 film, and for the magnetic field strengths considered here, the actual values measured at different dose levels do not differ significantly from a magnetic field-dependent (but dose-independent) constant value.
Several studies have investigated the various sources of uncertainties on film dosimetry (Martisikova et al 2008, Saur and Frengen 2008, Bouchard et al 2009, Garcia and Azorin 2013), including film manufacturing, film manipulation, the irradiation and digitisation processes and film characterisation, leading to estimates of best uncertainty that range from 1% to 2%. The measurement uncertainties in the present work with EBT-3 (as explained in section 2.6) are consistent with this, ranging from 1.1% to 2.2% for dose levels above 75 cGy. This includes the small uncertainty related to the effect of the B-field on dose to water (0.05%). The magnitude of the effect of B-fields on EBT-3 film dosimetry observed in this study is comparable to the best achievable measurement uncertainty.
4.1. Comparison with different studies
The development of dosimetry in MRIgRT is still at a fairly early stage and it is essential that the performance of detectors used is well characterised. In the current literature on film dosimetry in B-fields, there remains some apparent inconsistency in the results reported from different studies. With the aim of resolving any consequent confusion we compare, where possible, the results reported here with those already published.
Roed et al (2017) examined the effect of a B-field (0 T and 1.5 T) on the response of EBT-3 film signal exposed in a 60Co radiation beam. Their experiment involved two different orientations of the reference film edge with respect to (a) the B-field and (b) to scanning direction: either parallel or perpendicular in both cases. In all possible combinations, when film analysed using red channel, they found an under-response (ranging from approximetly 1% to 3%) on all examined dose levels with B-field strength of 1.5 T compared to zero B-field dose. However, they also state that when the film is left in the B-field for a duration of (a) 6 min and 30 min the dose is over responding by less than 1% and (b) 7 min and 10 min the dose is under responding by less than 1%. The relationship between the dose change and the time of the film left in B-field they do not follow a simple pattern. In our study, the irradiation time of the films was ranging between 4 min to 15 min and the dose was found to over respond by an average of 1.2% at 1.5 T.
Reynoso et al (2016) used a 60Co 0.35 T MRIdian system to irradiate EBT-2 films. Their results indicate that the  of the red, green and blue channel is decreased by an average of 8.7%, 8% and 4.3%, respectively. This study concludes that B-fields affect crystal orientation and polymerization during irradiation, judging from films scanned with an electron microscope. Although that study evaluated a different type of film, they specifically state that similar behaviour can be expected for EBT-3 because of the identical composition of the active layer. In the present work, the effect of a B-field on the netOD response of EBT-3 was found to be small. In the Reynoso et al (2016) study they show an average under response of netOD of approximately 7% for data up to 8 Gy (figure 2(b) in Reynoso et al (2016)). The reason for the difference between the results of these two studies is unclear.
A publication by Delfs et al (2018) assessed the effect of the B-field on EBT-3 using a 6 MV conventional linac and irradiating films in an electromagnet at two different magnetic strengths (0.35 T and 1.42 T). They report a decrease in the OD of up to 2.5% with an average, over all channels and over a range of dose values, of −0.8%. This effect was described by the authors as 2.1% increase in the dose values needed to produce a given OD at a B-field of 1.42 T. Our study found that there is indeed a change on film sensitivity however in the opposite direction of Delfs findings: the net OD is increased by +0.8% (red channel, 1.5 T). The dose required to produce a given optical density is smaller by 1.2%. Part of this difference might be explained due to energy dependence of EBT-3 film.
A recent study by Barten et al (2018) investigated the suitability of EBT-3 film for QA use in a 0.35 T 60Co MRIdian system. Their measurements involved irradiation of EBT-3 film with and without MR imaging and at different angles with respect to B-field. They also performed equivalent measurements at 0 T, but this time using a 6 MV conventional linac. Comparing calibration curves generated in 60Co, with B-field, and in 6 MV, without B-field, they found a maximum difference of 0.9%. In our study the difference on dose measured using EBT-3 film with and without B-field in a 60Co beam and at 0.5 T (the closest strength to 0.35 T) was found to be 0.7%, which agrees with the findings from Barten et al (2018).
The observed differences between the current study and the study by Roed et al (2017) show to be consistent within film uncertainties. Due to the nature of the film technique, any deviation can be explained because of the film perturbations influencing measurements uncertainties. However, this cannot explain the difference with the findings from Reynoso et al (2016) as it exceeds uncertainty margins. Although different type of EBT film generations were used, we anticipated consistency of published data and that EBT-2 to have a similar behaviour to EBT-3 under the strength of B-field.
It is essential to take measurement uncertainty into account when assessing the degree of agreement between two investigations. The field strength used by Delfs et al (2018) was 1.42 T. Assuming that it is fair to compare their result with our result for 1.5 T, and assuming that no correction is made for the possible effect of B-field on a film measurement of absorbed dose, then Delfs et al (2018) would estimate the uncorrected error as +2.1%, and we would estimate the uncorrected error as −1.2%. We quantify our standard uncertainty on this error as 1.4%, while Delfs et al (2018) merely assert that their 2.1% value 'exceeds the uncertainty margin of the experiment' but without quantifying the uncertainty on dose measured by film in their paper. We would note, however, that the difference between our results could only be significant at the level of two sigma if their standard uncertainty on dose is smaller than 0.8%, which is not plausible.
A good agreement was found between our study and the study of Barten et al (2018). Each of these studies (Barten et al 2018, Delfs et al 2018), however, used different beam quality, or a combination of beam qualities, to examine the effect of B-field on EBT-3 film response, compared to our work.
5. Conclusion
For the strongest B-field considered here (2 T), the sensitivity of Gafchromic EBT-3 film may be affected by the presence of a magnetic field at the time of irradiation. However, for MRI-linacs currently in use or under development, for which the field strength is at most 1.5 T, the effect of the B-field on EBT-3 film response was found to be zero within the best achievable measurement uncertainty. Results from this work agrees well with results presented by Roed et al (2017), but significantly deviates from the results shown by Reynoso et al (2016). A 3.3% difference was found from Delfs et al (2018) and a good agreement was observed with the findings by Barten et al (2018). The outcome of the current work contributes on settling the contradiction of these studies and conclude that EBT-3 film is a suitable dosimeter for absolute and relative dosimetry, with appropriate corrections, in MRI-guided radiotherapy.
Acknowledgments
The authors wish to thank Hugo Palmans from the Chemical, Medical and Environmental Science Department at NPL for his useful comments on the manuscript. The work was supported by the UK government's Department for Business, Innovation and Skills and the European Metrology Programme for Innovation and Research (EMPIR) project 15HLT08 MRIgRT. The EMPIR initiative is co-funded by the European Union's Horizon 2020 research and innovation programme and the EMPIR participating states. Research at The Institute of Cancer Research is supported by Cancer Research UK under Programme C33589/A19727 and NHS funding to the NIHR Biomedical Research Centre at The Royal Marsden Hospital and The Institute of Cancer Research.
Footnotes
- 5
That is, in addition to the uncertainty of the dosimeter against which the film is calibrated.