
Abstract
Limited by the intrinsic low electronic conductivity and inferior electrode kinetics, the use of TiO2 as an anode material for lithium ion batteries (LIBs) is hampered. Nanoscale surface-engineering strategies of morphology control and particle size reduction have been devoted to increase the lithium storage performances. It is found that the ultrafine nanocrystal with mesoporous framework plays a crucial role in achieving the excellent electrochemical performances due to the surface area effect. Herein, a promising anode material for LIBs consisting of phosphorus-doped TiO2 mesoporous nanocrystals (P-TMC) with ultrafine size of 2–8 nm and high specific surface area (234.164 m2 g–1) has been synthesized. It is formed through a hydrothermal process and NaBH4 assisted heat treatment for anatase defective TiO2 (TiO2–x) formation followed by a simple gas phosphorylation process in a low-cost reactor for P-doping. Due to the merits of the large specific surface area for providing more reaction sites for Li+ ions to increase the storage capacity and the presence of oxygen vacancies and P-doping for enhancing material's electronic conductivity and diffusion coefficient of ions, the as-designed P-TMC can display improved electrochemical properties. As a LIB anode, it can deliver a high reversible discharge capacity of 187 mAh g–1 at 0.2 C and a good long cycling performance with ∼82.6% capacity retention (101 mAh g–1) after 2500 cycles at 10 C with an average capacity loss of only 0.007% per cycle. Impressively, even the current rate increases to 100 times of the original rate, a satisfactory capacity of 104 mAh g−1 can be delivered, displaying good rate capacity. These results suggest the P-TMC a viable choice for application as an anode material in LIB applications. Also, the strategy in this work can be easily extended to the design of other high-performance electrode materials with P-doping for energy storage.
Export citation and abstract BibTeX RIS

Original content from this work may be used under the terms of the Creative Commons Attribution 4.0 licence. Any further distribution of this work must maintain attribution to the author(s) and the title of the work, journal citation and DOI.
1. Introduction
With the increasing concerns on the environmental issues and energy crisis, lithium-ion batteries (LIBs) have become the most common and widespread energy storage devices recently [1–3]. Titanium dioxide (TiO2), with the advantages of low toxicity, high abundance in nature, chemical stability, and cost effectiveness, has attracted intensive attention of many researchers globally for applications in energy storage systems because of the push toward clean energy concern and increased demand for electric vehicles [4–6]. In particular, it has been widely recognized as a viable candidate as a safe anode material for LIBs owing to its low volume change (∼4%) during Li+ charge/discharge and the flat operating potential based on the following equation [7, 8]:

where x is the mole fraction of Li ions in TiO2. The theoretical capacity of anatase-type TiO2 will obtain to be 336 mAh g−1 when x equals 1. However, in general the maximum x always determines to be 0.5 [9], due to the low electrical conductivity and poor Li-ion diffusivity of TiO2 [10, 11], which would hinder their practical industrial applications. Many strategies have been made to compensate for this problem. One approach is to tailor the size and morphology of TiO2-based materials. It was reported that the mesoporous nanocrystal based electrode materials have been widely reported for LIB anodes because of their increased active sites and large contact area between electrolyte and electrode to shorten the ion diffusion length of active materials, as well as good accommodation of strain during cycling [12–14]. In addition, ultrafine TiO2 nanostructures less than 10 nm as the electrode materials can effectively facilitate the Li insertion/extraction in/from the interstitial sites in TiO2 and lead to enhanced specific capacity [15]. Nevertheless, to the best of our knowledge, the formation of mesoporous TiO2 nanocrystals with ultrafine small size for LIBs remains challenge because of the aggregation effect in materials limited to the surface. In addition, long transport length of electrons in pristine low-conductive TiO2 materials is an another concern in regard to the high efficiency of electrode materials [10]. Therefore, for addressing this issue, point defect engineering in TiO2 including the introduction of oxygen vacancies for enhancing the electrical conductivity and kinetics as well as heteroatoms doping modification for improving ion diffusion dynamics and electron transport to promote fast and efficient charge transfer have has been widely studied [16, 17]. Among various heteroatom doing processes, phosphorus doping (P-doping), which is to be able to induce an increase in the free charge carriers, promote the electron/ion transfer kinetics and enhance the surface active sites due to the synergistic effect of surface phosphorylation layer and bulk P doping defect, is known to be beneficial for improving electrochemical performances [18, 19]. Until now, much effort has been focused on the research of P-doped TiO2 due to its reduced band gap, which in turn helps to exhibit effective photocatalytic efficiency under visible light exposure and enhance electrode's electrical conductivity and charge carrier [20, 21]. In addition, P is an earth abundant dopant with much cheaper price as compared to most of other heteroatom dopants, and so represents an promising alternative for large scale industrial deployment [22]. There have been a large number of publications that deal with the preparation of TiO2 with P-doping by one-pot or one-step wet chemical methods, including sol–gel and solvothermal/hydrothermal reaction [23–29]. Though the doping during the above synthesis process can obtain efficient and uniform results, it is still quite difficult for many nanomaterials to maintain the morphology and phase after doping. Therefore, lots of researchers are now focusing on the possibilities of heteroatom-doping after growth. Two-step process is an effective way for doping heteroatoms into nanomaterials for keeping the morphology and phase unchanged. It always involves in two-steps, including creating vacancies into material's crystal or surface and then filling the vacancies with desired dopants [30]. Phosphorylation process has recently been introduced for P-doped material production because of its industrially appealing properties such as less-toxic characteristics, cation exchange, and easy to implement [21, 31, 32]. However, the expensive tube furnace for heat treatment is always needed, which would raise the manufacturing cost. Nevertheless, only few papers reported this process for application of the doped materials in LIBs. For example, Cao et al show that not only the conductivity but also the astonishing surface lithium affinity of TiO2 (B) can be improved after P-doping [33]. Despite its infancy, phosphorylation process still remains an emerging strategy that is worth investigating for P-doping of TiO2.
In this work, an ultrafine nanomaterial of phosphorus-doped anatase TiO2 mesoporous nanocrystals (P-TMC) with the size of 2−8 nm is applied as anode for LIBs. It is prepared via a facile hydrothermal method for TiO2 growth, and followed by a two-step process for P-doped TiO2 formation, including NaBH4 assisted heat treatment for anatase defective TiO2 (TiO2–x) formation and subsequent phosphorylation process in a low-cost reactor for P-doping. The P-doping and existence of oxygen vacancies are verified to modified the crystal structure and electronic structure of anatase TiO2, thereby realizing the improvement of electronic conductivity and charge transfer capability. When working as the LIB anode, the P-TMC with higher surface area and improved electrochemical properties can afford a high reversible discharge capacity of 187 mAh g–1 at 0.2 C and provide a capacity retention of ∼82.6% over 2500 continuous cycles at 10 C, which is competitive with most other doped TiO2-based nanostructured materials reported to date.
2. Experimental section
2.1. Synthesis of anatase TiO2–x mesoporous nanocrystals (d-TMC)
TiO2 mesoporous nanocrystals (TMC) were firstly prepared by a common hydrothermal process, which described and characterized detailly in supplementary information (figure S1). For d-TMC production, the mixture of prepared TMC sample and NaBH4 with the weight ratio of [TMC]:[NaBH4] = 2:1 was collected and thoroughly mixed using an Agate pestle and mortar, followed by heating in the furnace at 350 °C under argon atmosphere for 4 h. The sample then cooled down, washed with DI water for several times, and dried at 80 °C to get the light brown powder.
2.2. Preparation of phosphorus-doped TMC (P-TMC)
Before P-doping process, the d-TMC sample was firstly manually ground for 10 min in an agate mortar to decrease the particle size and prevent sample aggregation. Afterwards, P-TMC was fabricated by a phosphorylation process in a low-cost reactor made from two-neck round-bottom flask connected with a glass tube (figure S2), in which the gas-solid P-doping reaction would perform at 300 °C for 2 h with the assistance of sodium hypophosphite (NaH2PO2, Acros Organics, >99%) based on d-TMC. In detail, NaH2PO2 was placed on the one of a flask and the d-TMC was placed on the other one. As the temperature increases, phosphine gas slowly evolved and passed through the glass tube along with the argon carrier gas for accelerating the doping of the phosphine gas on the surface of the TiO2–x. Finally, the brown powder of P-TMC was obtained and the P doping amount was about 2.8 at%.
2.3. Material characterization
X-ray diffractometry (XRD, D8-SSS with Cu kα radiation (λ = 0.1506 nm)) and Raman spectroscopy (Nanofinder 30 from Tokyo Instruments, Inc., excitation line at 632.8 nm) were used to characterize the crystal form and structure of the samples. Field emission scanning electron microscope (FESEM, Zeiss Ultra Plus, accelerating voltage of 3 kV) and high-resolution transmission electron microscope (HRTEM, JEM 2010, 200 kV) were used to characterize the morphology and elemental distribution of the prepared samples. The electronic states of as-synthesized samples were determined by x-ray photoelectron spectroscopy (XPS, ULVAC-PHI PHI 5000 Versa P-robe x-ray photoelectron spectrometer, Al Kα x-ray). The surface area was measured from the N2 adsorption–desorption isotherms by using an automated gas sorption analyzer (Quantachrome Instruments autoSorb iQ-TPX) with the Brunauer–Emmett–Teller (BET) method. Electron paramagnetic resonance (EPR) analysis was carried out using a Bruker EMX-plus (PREMIUM X)-10/12 spectrometer.
2.4. Electrochemical measurements
The anodes were made by dispersing active material, carbon black (Alfa-Aesar, >99%), and poly(vinylidene fluoride) (PVDF) (Sigma-Aldrich, >99%) binder in N-methylpyrrolidone (NMP) (Alfa-Aesar, >99%) solvent, at a weight ratio of 7:2:1. The active material loading was about 1.0 mg cm−2. The lithium-ion battery test was carried out with 2032-type coin cells, which were assembled in an Ar-filled dry glove box with the samples as the positive electrodes and the lithium foil as the negative electrode. The electrolyte is the 1
M LiPF6 dissolved in a mixture of ethylene carbonate (EC)/diethyl carbonate (DEC) (1:1, v/v) (Guangzhou Tinci Materials Technology Co., Ltd China). Celgard 2325 membrane was used as the separator. Electrochemical evaluations were carried out in the voltage window of 1.0–3.0 V versus Li/Li+ by using a Wonatech WBCS 3000 battery tester (Korea) and Landt CT3002A battery test system (China). The cyclic voltammetry (CV) and electrochemical impedance spectroscopy (EIS) tests were operated on a CHI 611E electrochemical workstation.
3. Results and discussions
3.1. Sample characterizations
Figure 1 schematically illustrates the formation mechanism of the P-doped anatase TiO2 mesoporous nanocrystals. Firstly, the TiO2 mesoporous nanocrystals (TMCs) were synthesized through a hydrothermal process. Subsequently, the TMCs were mixed with NaBH4 and then heated under Ar atmosphere to create oxygen vacancy defects on TiO2 nanocrystals and metastable surface layer, which was beneficial to facilitate efficient phosphorus doping due to the increased electronic conductivity and enhanced diffusion and mobility of heteroatoms [21]. Afterwards, during P-doping process of phosphorylation, P (V) dopants substituted Ti sites in TiO2 lattice happened, in which the charge compensation was accomplished by the reduction of Ti4+ to Ti3+ per P5+ introduced and/or the formation of oxygen interstitials, resulting in an increase in electron mobility. Finally, P-doped TiO2 mesoporous nanocrystals with enhanced electronic conductivity and fast diffusion path for Li+ ions were carried out. Figure 2(a) gives the XRD pattern of the d-TMC and P-TMC materials. Both results show the characteristic anatase TiO2 pattern with no other impurity peaks and no obvious difference between the two, implying a lack of bulk structural change to the as-synthesized TiO2 samples. Nevertheless, the ionic radius of P5+ (38 pm) is smaller that of Ti4+ (60 pm); thus, substituting P5+ for Ti4+ may lead to the TiO2 lattice contraction. Figure 2(b) and figure S3 display that the peak positions (2-theta) of the two anatase planes in TiO2, (101) and (200), have a slight shift toward higher diffraction values with P-doping. This phenomenon is caused by the contraction of the TiO2 lattices. The fringe spacings of 3.50 (d101) and 1.87 Å (d200) for d-TMC is decreased to 3.47 and 1.86 Å for P-TMC, according to the calculation result from Bragg's law of nλ = 2d sinθ where θ is the incident angle, n is the reflection order, λ is the wavelength of the incident x-rays, and d is the interplanar spacing between planes in the atomic lattice. Therefore, the changes of XRD peaks demonstrate that the P is successfully doped into TiO2 crystal framework through the gas phosphorylation process. Figures 2(c) and (d) display the Raman spectroscopy of the d-TMC and P-TMC samples. For the d-TMCs, a strong band at 153 cm–1 (vibration mode Eg), three bands at 398, 514 and 636 cm–1 (modes B1g, A1g and Eg), and a weak band at 201 cm–1 (mode Eg) are displayed, confirming that our samples belong to anatase TiO2 [34, 35]. This result is consistent with the results obtained by XRD. From the Raman analysis, we can observe that all the bands of the P-TiO2 sample become broadening and weakening of intensity as compared to the undoped one due to the formation of Ti–O–P with asymmetric vibration and the existence of oxygen vacancies [34, 36].
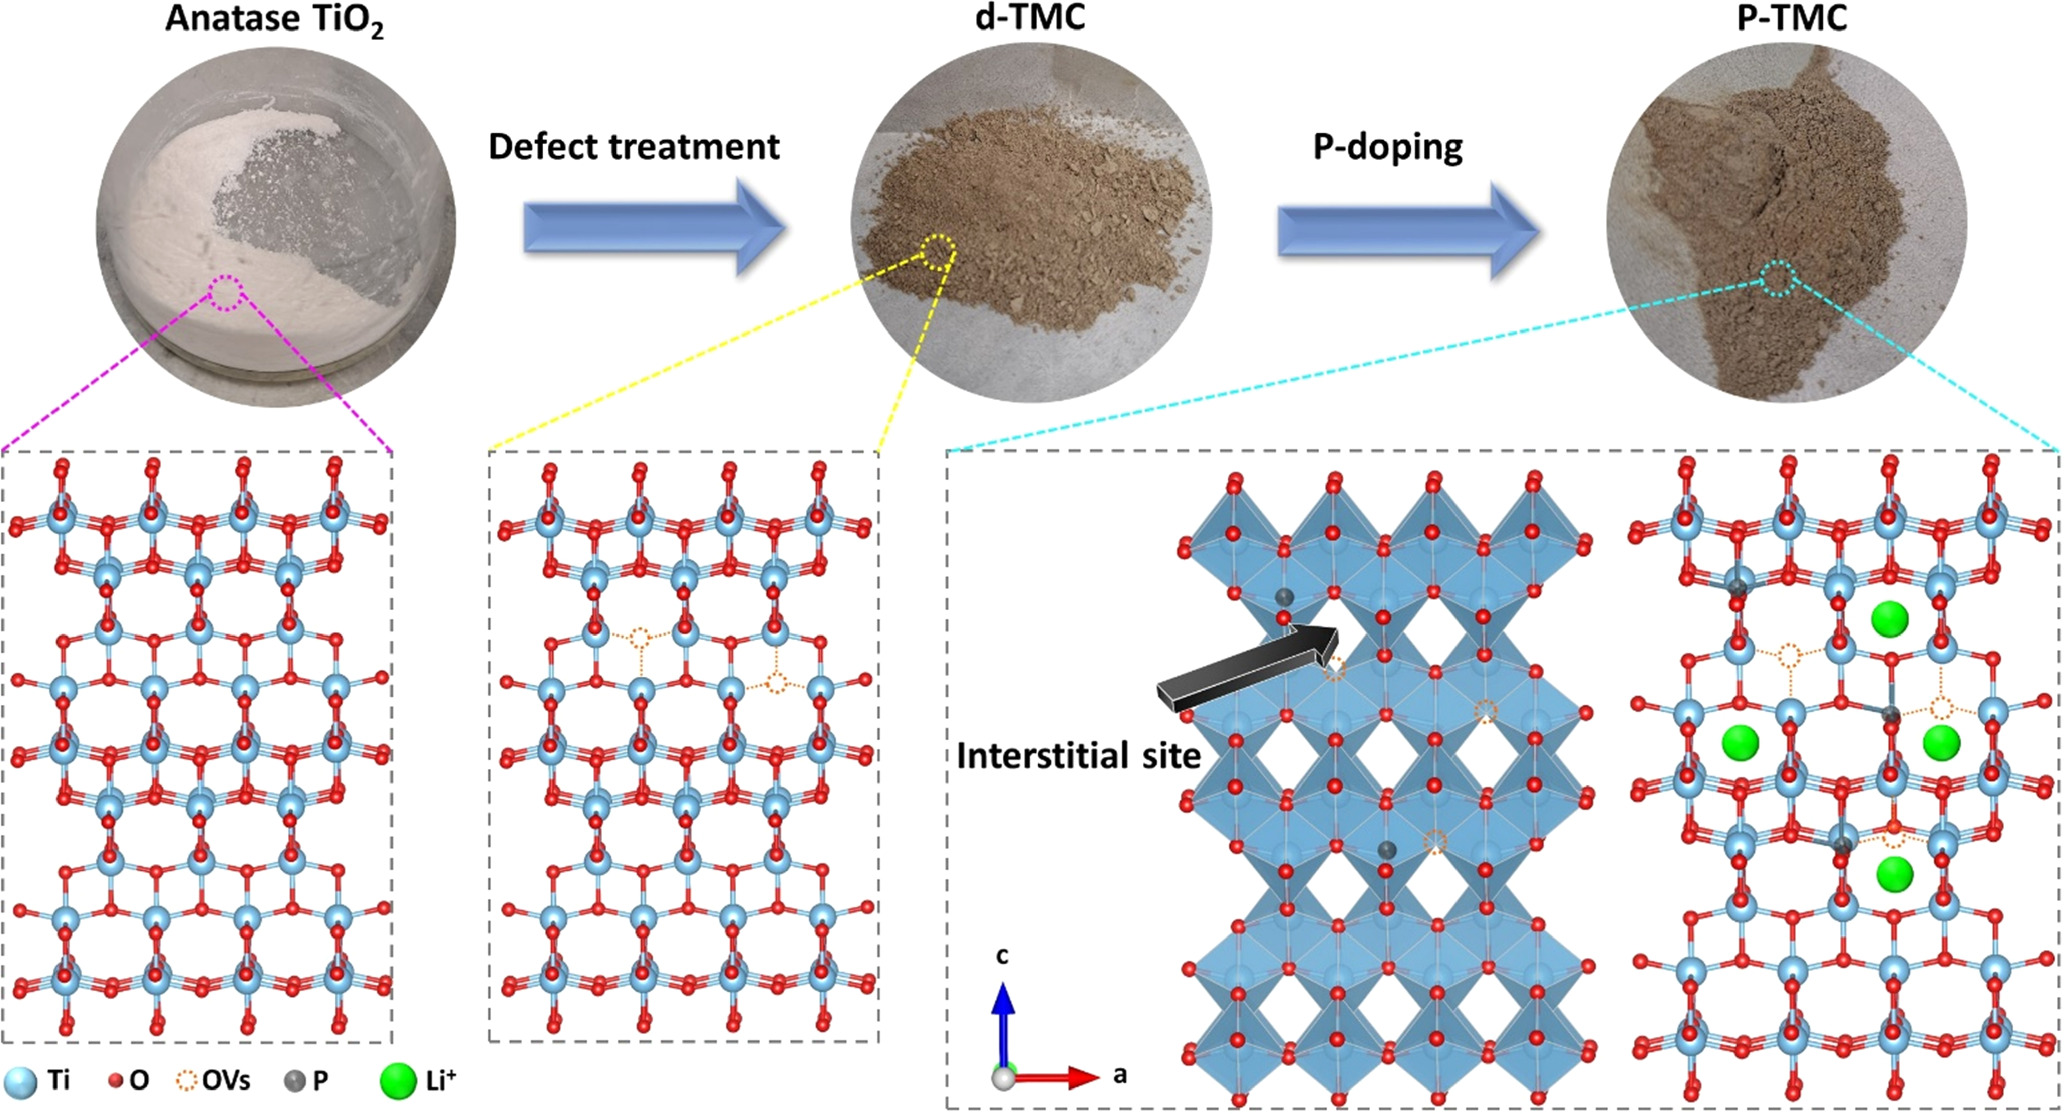
Figure 1. Schematic illustration of the synthesis process, the micro-structure of the prepared samples, as well as the transportation path of Li+ ions in P-TMC.
Download figure:
Standard image High-resolution image
Figure 2. (a) XRD patterns and (b) the enlarged XRD patterns of peaks of (101) plane of undoped and P-doped TiO2. (c) Raman spectra and (d) the corresponding enlarged region near Eg peak at 100–250 cm–1 of the undoped and P-doped samples.
Download figure:
Standard image High-resolution imageMorphologies of d-TMC and P-TMC are revealed by SEM micrographs and presented in figures 3(a) and (b). Both samples appear smaller spherical-like nanostructures. Interesting, reduction of particle size is observed as doping of phosphorus. To further elucidate the size and structure of these particles for both samples, TEM measurements are carried out. Figures 3(c)–(f) shows the low magnification and high-resolution TEM images of d-TMC samples with and without P-doping. It reveals the almost spherical shaped particles for both cases, but with the particle size distribution of 5−30 nm for d-TMC and about 2−8 nm for P-TMC, respectively. In addition, according to figure 3(e), the lattice spacing of 0.358 nm indexed to (101) facets of anatase TiO2 is found out for d-TMC sample. After P-doping, we can observe that part of P-TMCs interplanar spacing becomes narrower due to the smaller ionic radius of the doping element, which is consistent with the XRD result. In addition, the EDX element mapping of the P-TMC sample demonstrate the uniform distribution of Ti, O, and P elements in the sample (figure S4). Therefore, the above observations confirm that the P elements can serve as cation doping into d-TMCs with our designed efficient synthesis methodology.
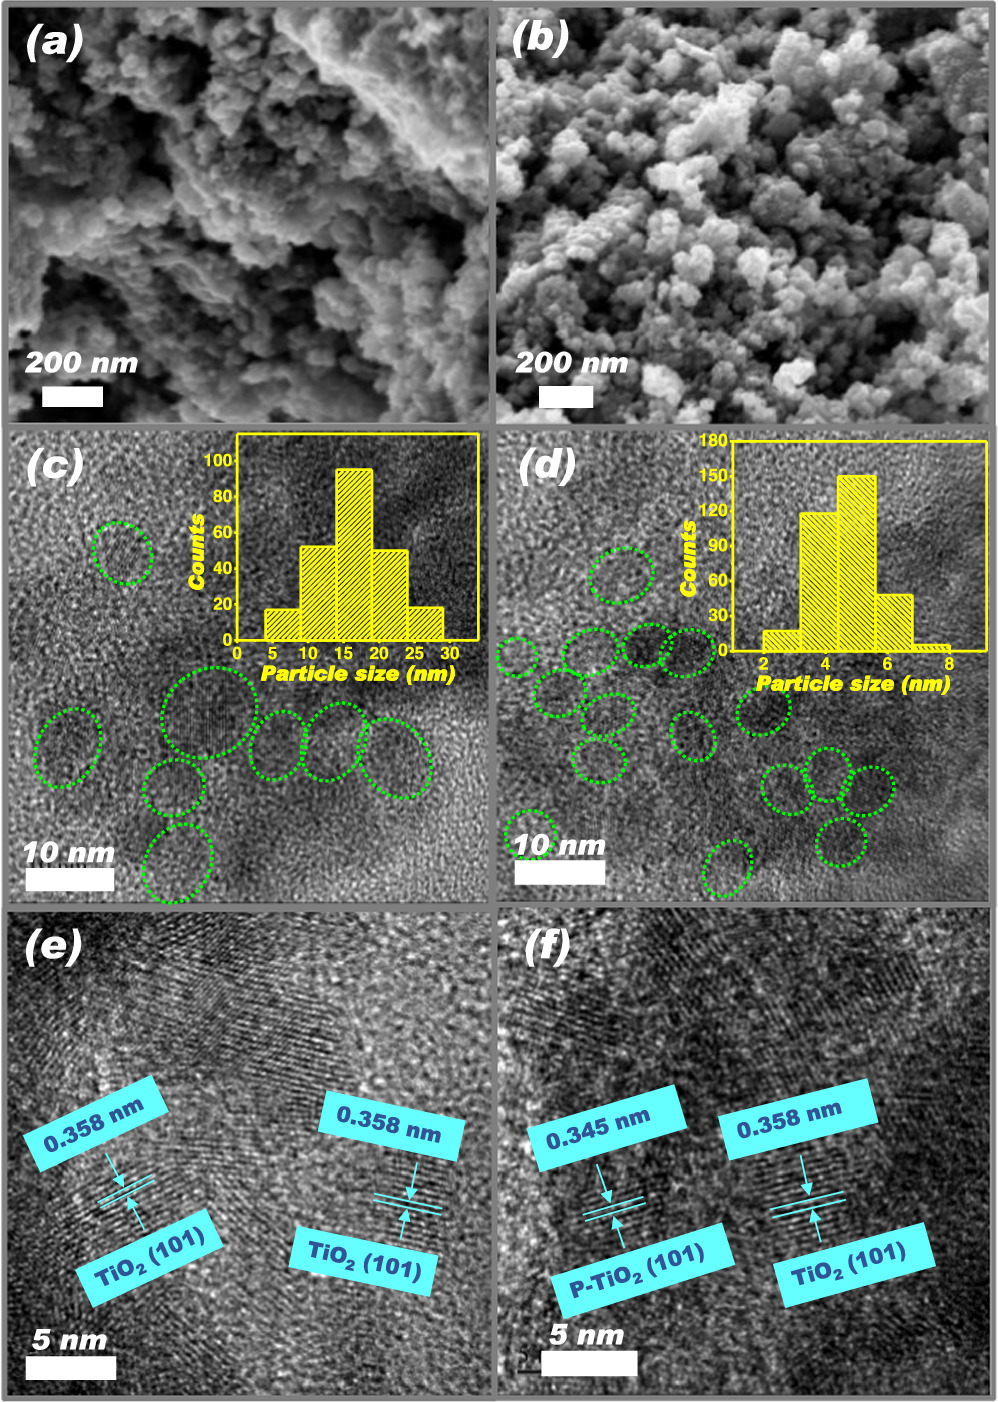
Figure 3. SEM images of (a) d-TMC and (b) P-TMC, TEM images of (c) d-TMC and (d) P-TMC, and HRTEM images of (e) d-TMC and (f) P-TMC. Inset of figure (c) and (d): the corresponding size distribution taken from TEM images.
Download figure:
Standard image High-resolution imageTo further check the chemical structure and oxidation states of elements that exist in P-TMC and d-TMC, XPS analysis are carried out. The survey scanned spectra (figure 4(a)) demonstrate that Ti, C, and and O elements exist in undoped d-TMC. One extra peak of P in addition to these peaks appears in P-TMC, where the P content is about 2.8 atom% from the measurement. In figure 4(b) of the high resolution XPS spectra related to O 1s, there are three deconvolution peaks located at around 532.3, 531.4, and 529.9 eV observed. The peak located at approximately 532.3 eV is corresponding to the surface oxygen about the –OH adsorbed on the material surface (OI). The peak at 531.4 eV is assigned to the surface-adsorbed oxygen and/or the surface oxygen defects (OII). The peak observed at about 529.9 eV represents the lattice oxygen (OIII). And the relative content of oxygen vacancies could be calculated by the ration of (OI + OII)/OIII [37]. It could be obtained that the peak area ratio of (OI + OII)/(OIII) in P-TMC is 1.3, which is higher than that of d-TMC (0.7). This result demonstrates that the oxygen vacancy content could be increased by P-doping. For the P 2p spectrum illustrated in figure 4(c), there is only one peak at approximately 133.40 eV corresponding to phosphorus in the form of pentavalent-oxidation state (P5+) observed. Also, no peak at around 129 eV corresponding to characteristic peak of P in Ti–P bonds formed as P atoms replacing O atoms in the lattice is obtained, implying the substitution of Ti sites by P dopants in the crystal lattice of TiO2 [38]. Further seen from figure 4(d) of Ti 2p spectrum, it shows that there are two characteristic peaks in the Ti 2p region. The peaks at binding energies 458.83 and 464.66 eV for d-TMC, and 458.61 and 464.55 for P-TMC, refer to Ti 2p3/2 and Ti 2p1/2, respectively, of TiO2. It is found that the Ti 2p binding energy in P-TMC is slightly shifted to lower energy states because of the existence of lower binding energy in comparison with that in d-TMC sample. It could be related to the introduction of oxygen vacancies and a slight increase of Ti3+ states with P dopants, as demonstrated by other reported works about TiO2 with defects [21, 39, 40]. For the Ti 2p3/2 and Ti 2p1/2 peaks, the signals of Ti4+ and Ti3+ are observed for both samples, and the Ti3+ species are created to maintain the charge balance of TiO2 as oxygen vacancies formation [41]. In addition, the Ti3+ signals slightly increased and the Ti4+ signals decreased after P-doping, which could be ascribed to the replacement Ti+4 sites by P and the formation of Ti3+ for charge balance [42].
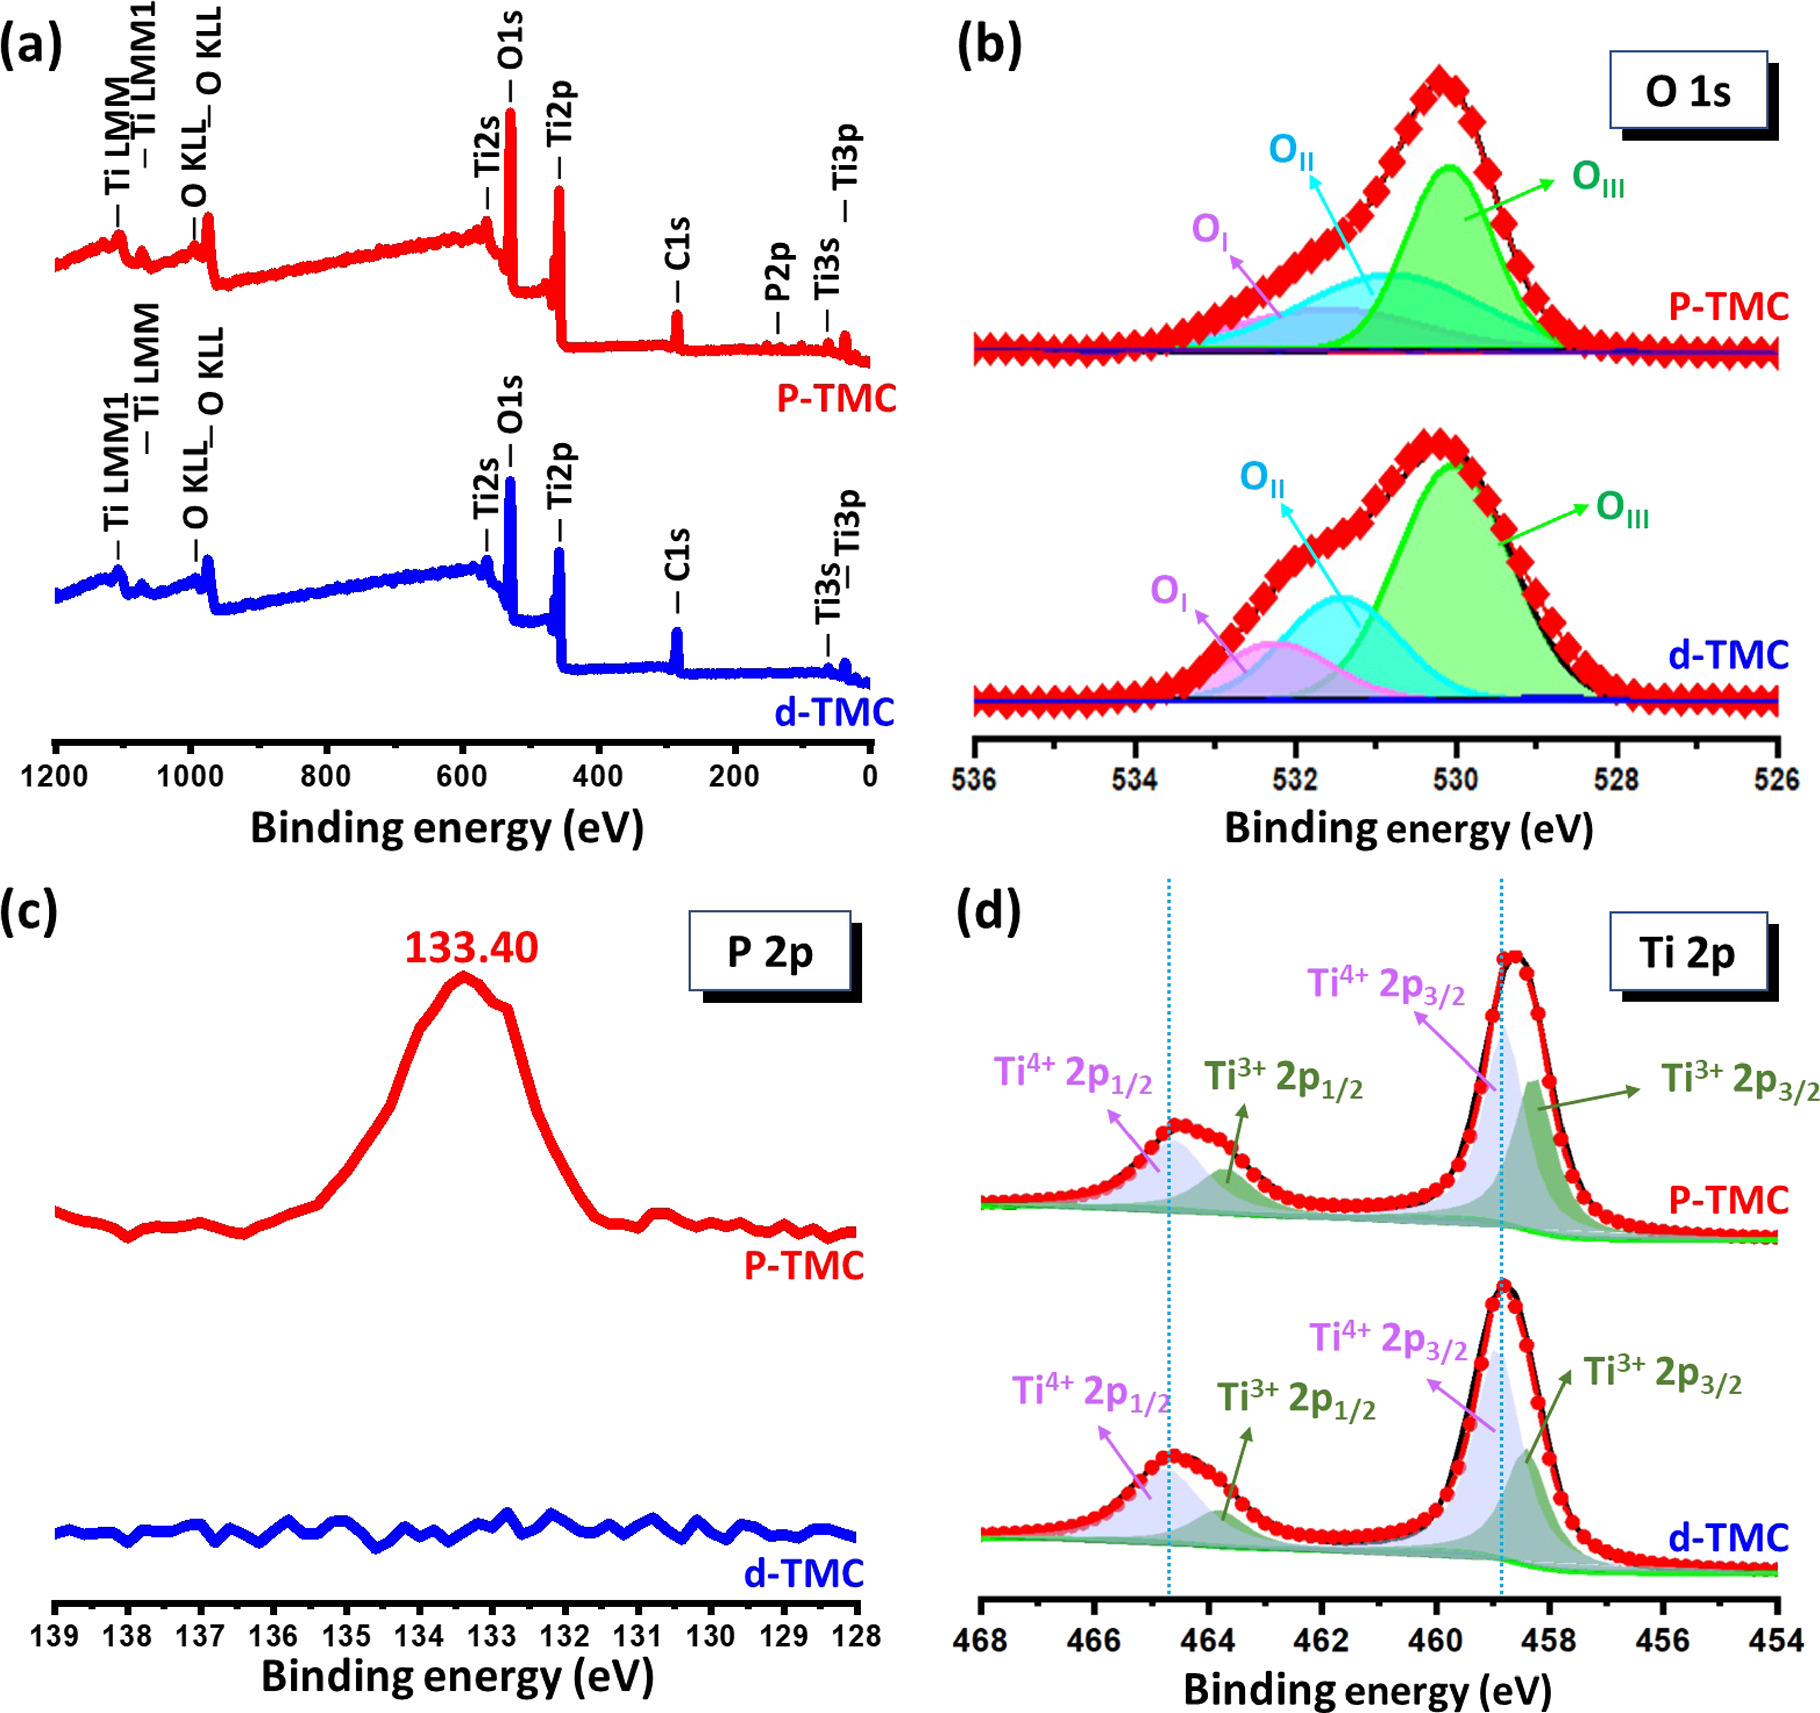
Figure 4. XPS spectra of the as-prepared d-TMC and P-TMC samples: wide scan spectra (a) and high-resolution spectra of O 1s (b), P 2p (c), and Ti 2p (d).
Download figure:
Standard image High-resolution imageIn addition, the existence of oxygen vacancies is confirmed by EPR analysis, which is used to verify the electron structure of the as-synthesized samples for providing valuable information about the existence of oxygen vacancies, trapped electrons, and surface defects (figure 5 and figure S5). No obvious EPR signal is observed for the non-defective TiO2. However, a strong EPR signal at g = 2.01 (g-factor) can be seen in d-TMC sample, which is characteristic of unpaired electrons trapped by oxygen vacancies, indicating the presence of oxygen vacancies in TiO2 lattice [41, 43]. In contrast, the P-TMC sample shows a stronger EPR signal at 2.01, revealing that a higher oxygen vacancy content generated after P-doping process.

Figure 5. EPR spectra of d-TMC and P-TMC samples.
Download figure:
Standard image High-resolution imageThe isothermal adsorption/desorption curves and pore size distribution curves of d-TMC and P-TMC samples are presented in figure 6 and indicate that the P-TMC sample possesses a large specific surface area with a mesoporous structure. Firstly, both isotherm curves depict the typical type IV behavior with H3-type hysteresis loops due to capillary condensation in the mesoporous channels and/or cages [44]. Using the multipoint BET method, the specific surface area of d-TMC is measured to be 159.757 m2 g–1, which is much smaller than that of P-TMC one with surface area of 234.164 m2 g–1. Additionally, it is observed from the plot that the pore size distribution for both samples is with the average pore size ∼2.0 nm determined by Barrett–Joyner–Halenda (BJH) method. These results declare that the P-TMC sample can create more active site for the contact between the electrolyte and the electrode material, which can promote electrochemical redox reaction and facilitate the ion transport in the electrolyte during charge/discharge process, and then improve the electrochemical performances.
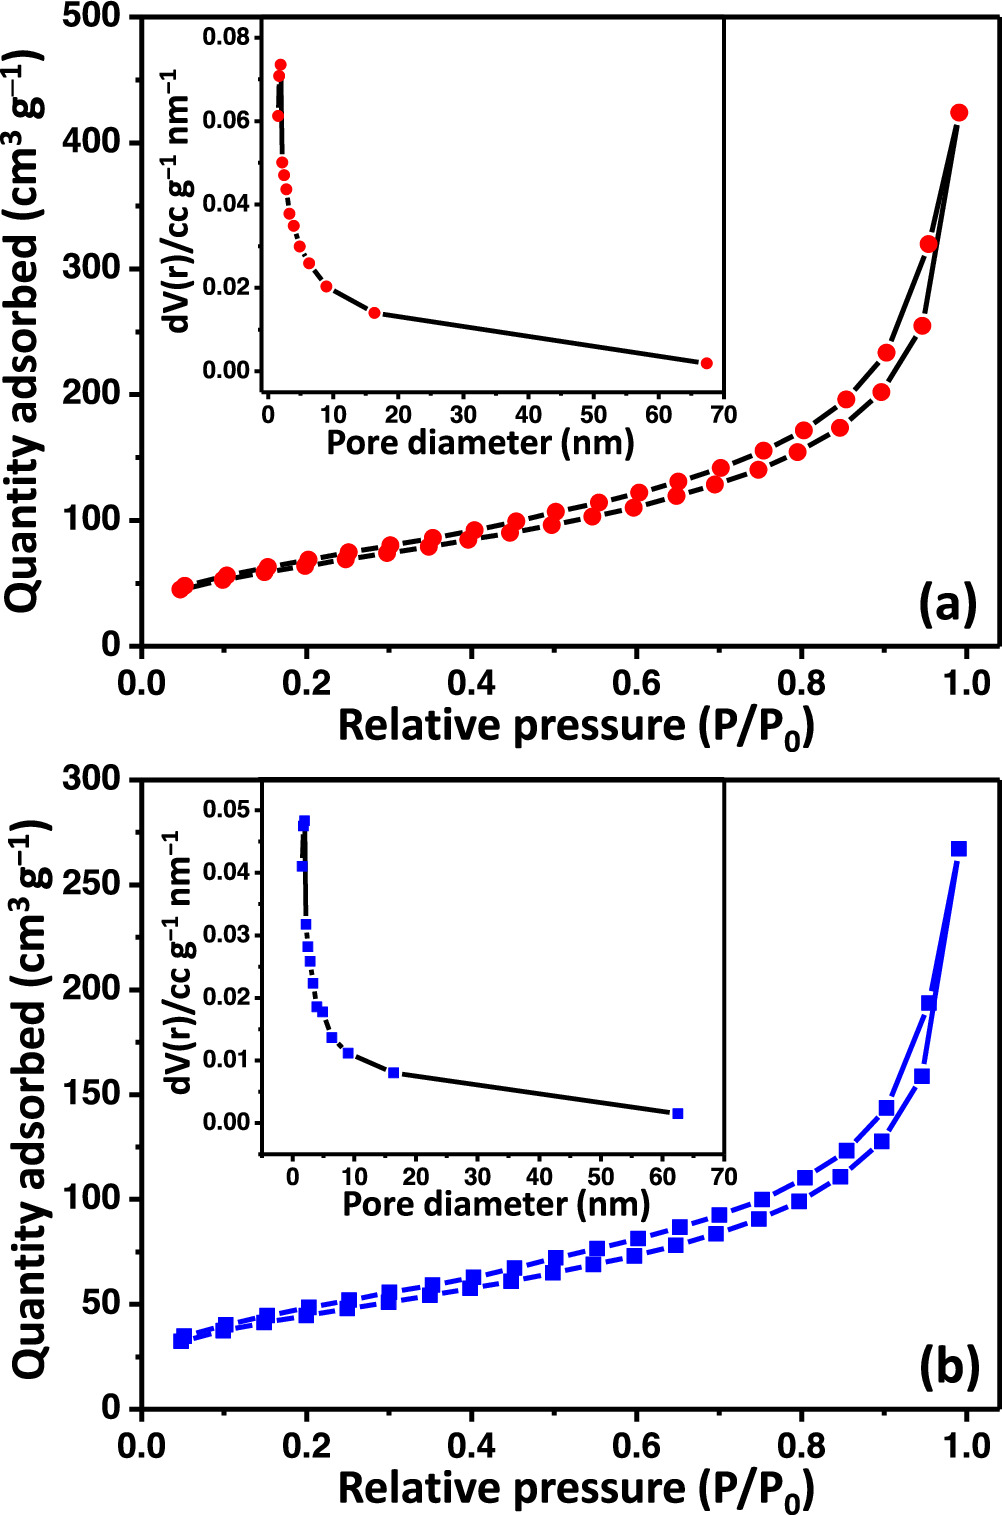
Figure 6. Nitrogen adsorption−desorption isotherm of (a) d-TMC and (b) P-TMC. The pore size distribution curve is shown in the inset.
Download figure:
Standard image High-resolution image3.2. Electrochemical performance measurements
To elucidate the positive P-doping effect, both CV and galvanostatic charge–discharge (GCD) measurements were firstly evaluated for d-TMC and P-TMC cells. CV analysis is first performed on a half-cell in a potential range between 1.0 and 3.0 V versus Li/Li+ at a scanning rate of 0.5 mV s−1. As illustrated in figure 7(a), it is observed that both cells exhibit similar redox curves with two pairs of redox peaks, suggesting these cells undergo a two-step electrochemical process. The pair of peaks located at near 1.71/2.03 V and 1.72/1.99;V for P-TMC and d-TMC, respectively, can be assigned to Li+ insertion/extraction into anatase TiO2, resulting in reversible phase transition between tetragonal TiO2 to orthorhombic Lix TiO2 [45]. The other pair of peaks observed at approximately 1.50/1.65 V and 1.49/1.60 V for P-TMC and d-TMC are characteristic for the pseudocapacitive Li+ storage at the surface due to the formation of oxygen vacancy trivalent titanium (Ti3+) [46]. Importantly, the P-TMC cell not only displays a higher current density but also presents enlarged area of CV curve than the d-TMC one (the area of CV is 0.522 mW mg−1 for P-TMC and 0.302 mW mg−1 for d-TMC, respectively), indicating the improvement of energy storage capacities by P-doping. Figure 7(b) illustrate the cycling performance of these anodes at 1 C (170 mA g−1) for 100 cycles. Both anodes exhibit gradual capacity fading but bear the specific capacity of ∼149.1 and 107.6 mAh g−1 after 100 cycles for P-TMC and d-TMC, respectively. We believe that the improved specific capacity of the P-TMC stems from phosphorus-doping in TiO2 for increasing the electric conductivity of the electrode and delivering faster charge transfer during the Li+ intercalation/deintercalation processes. This enhancement can be supported by the EIS data. As revealed by the EIS spectrum (figure 7(c) and figure S6(a)), the P-TMC cell displays a smaller semi-circle in the high-frequency region corresponding to lower charge transfer resistance (Rct) and a higher Warburg slope in the low-frequency region referring to faster ion diffusion speed and ion storage kinetics, as compared to those of the d-TMC and TMC cells [47, 48]. To further discuss the ion diffusion of these cells (figure 7(d) and figure S6(b)), the corresponding ion diffusion coefficient D, which is related to Warburg impedance coefficient (σw) from the linear fitting of Z' and ω−1/2 in the low-frequency range, is investigated according to the following equations [49, 50]:


Here R is the gas constant, T is the absolute temperature, A is the contact area between electrode and electrolyte, F is the Faraday constant, and C is the molar concentration of ions. The Li+ ion diffusion coefficient D is in direct proportion to (1/σw)2 from the equation. By calculating the slope of the line after fitting, the σw of P-TMC cell is obtained to be 19.50 Ω cm2⋅S−1/2, which is lower than the values for d-TMC (51.47 Ω cm2⋅S−1/2) and TMC (141.91 Ω cm2⋅S−1/2). It indicated the P-TMC sample can provide better lithium-ion diffusion kinetics. The above results confirm that phosphorus doping in TiO2 could boost the mobility of ions/electrons, beneficial to improve the reversible capacity and lead to improved electrochemical performances for P-TMC sample.
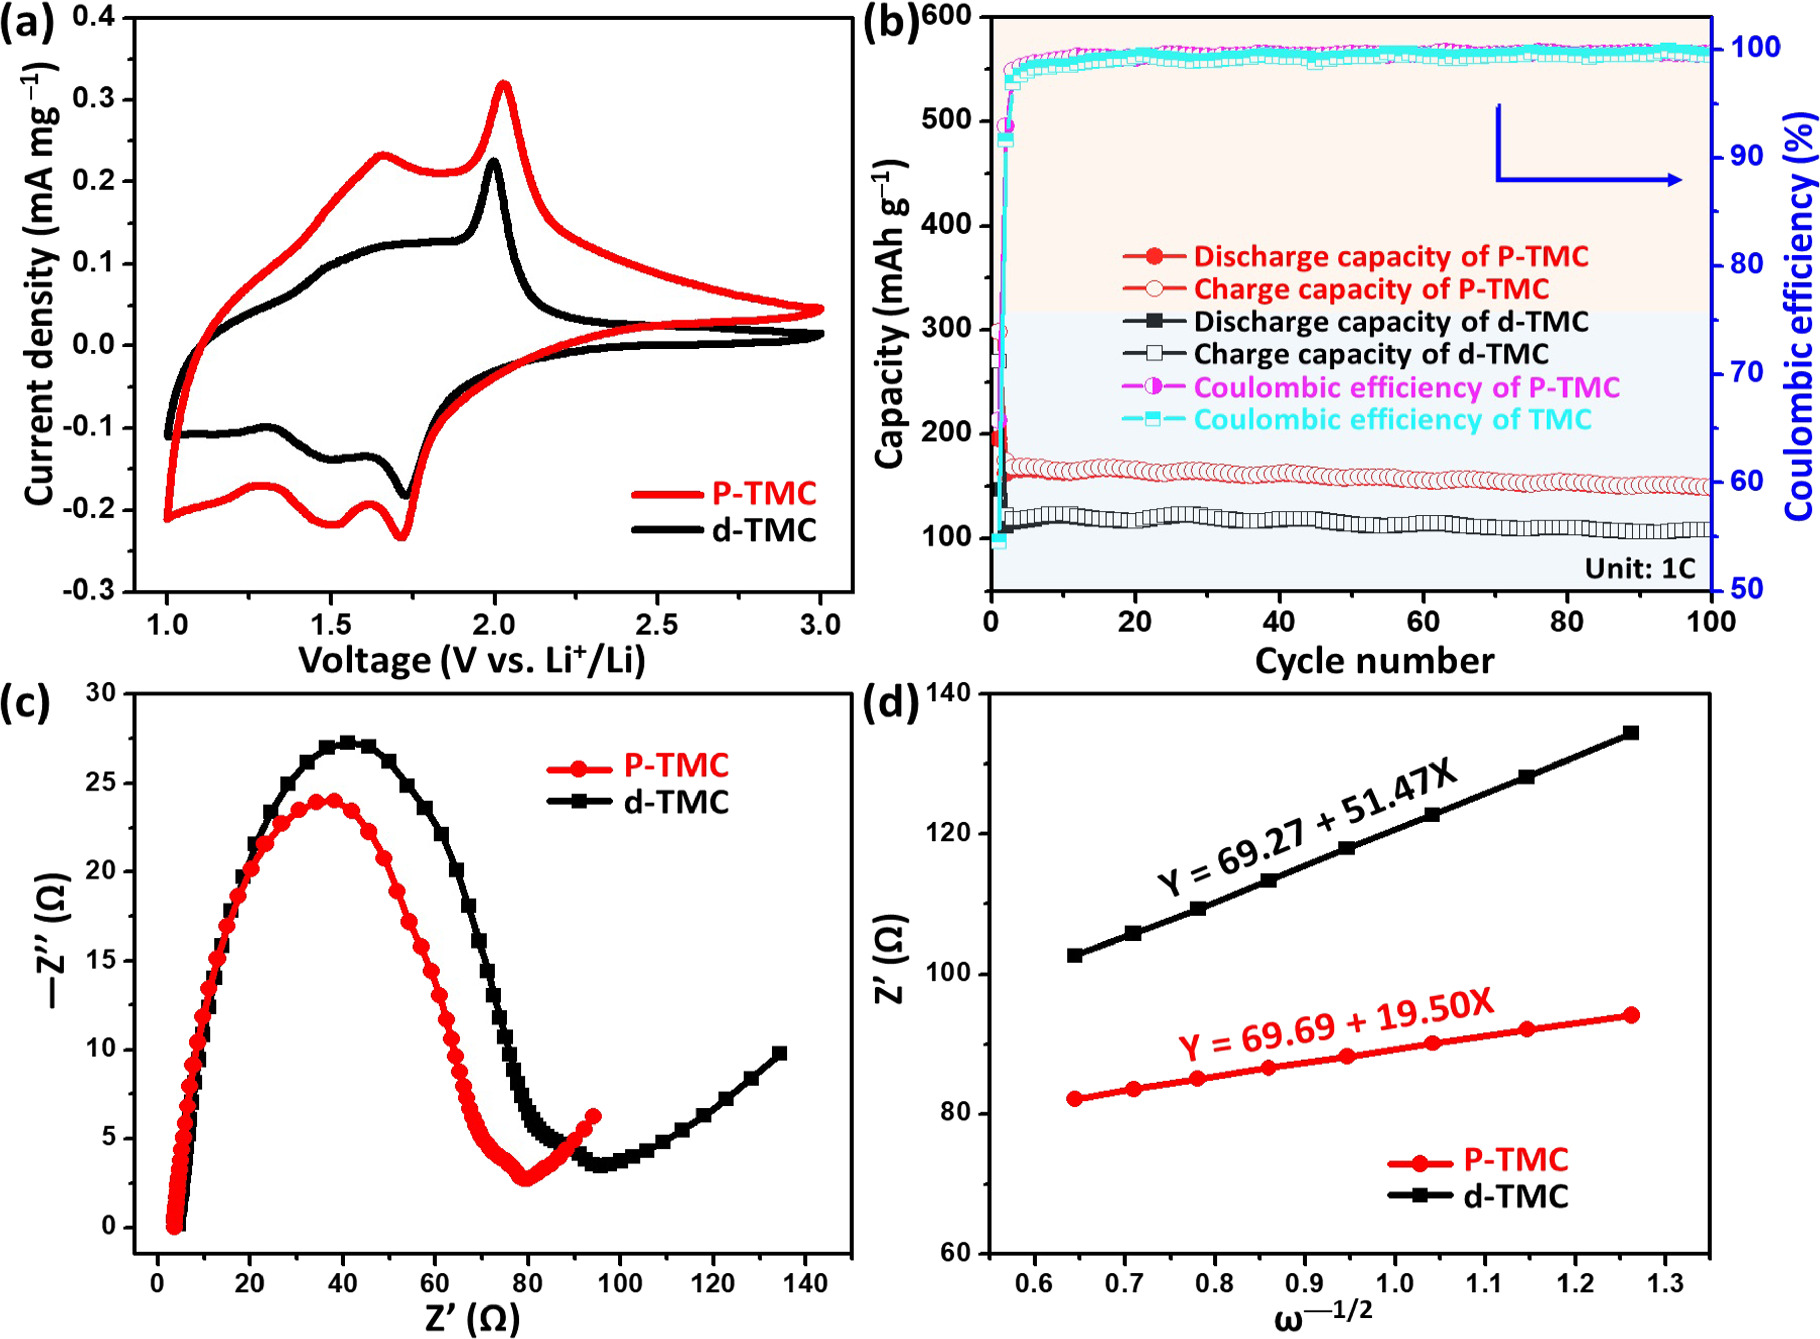
Figure 7. (a) The CV curves in third cycle at a scan rate of 0.5 mV s–1, (b) cycling performances at 1 C (1 C = 170 mA h–1), (c) Nyquist plots, and (d) fitting of the linear relationship between Z' and ω−1/2 at low frequency for P-TMC and TMC samples, respectively.
Download figure:
Standard image High-resolution imageFigure 8(a) shows the CV curves of the P-TMC sample in a half-cell configuration scanned at a scanning rate of 0.2 mV s−1, which can be implemented as the primary tool to understand the electrochemical redox reactions during charge/discharge process. The first cathodic CV sweep of the P-TMC displays three peaks, locating at ∼2.32, 1.57, and 1.28 V. The broad peak centered at 2.32 V in the first cathodic scan without an anodic pair disappears in the subsequent cycles, revealing the irreversible formation of the solid electrolyte interphase (SEI) layers, and this may be due to the extension of the voltage window of electrolyte [51, 52]. The cathodic peak at 1.57 V in the first cathodic sweep is assigned to the insertion of Li+ into the TiO2 structure and another one at 1.28 V is corresponding to the pseudocapacitive Li+ intercalation at surface. An obvious anodic peak located at 1.97 V associated with the lithium extraction from anatase lattice is revealed. Importantly, the CV curves turn gradually steady when the number of cycles is increased. The basically overlapped CV curves after the fourth scans indicates the cell's good reversibility which can uptake and release Li+ ions with good reversibility. In addition, figure 9(a) shows the CV curves recorded at various sweep rates, which can be applied to elucidate the pseudo-capacitive electrochemical behaviors involved in LIB. To be specific, the effects of diffusion-controlled and surface pseudocapacitive reactions could be distinguished from the power-law equation of i = avb, in which a and b are the constants for the power-law exponent, and v is the sweep rate [47, 53]. In general, the b-value, determined by the relationship between peak current and the sweep rate and derived from the slope of log(i) against log(v), is applied to qualitatively classify the electrochemical behaviors for diffusion-control process as the b-value is close to 0.5 and pseudo-capacitive behavior as the b-value is approaching 1, respectively. From figure 9(b), we could observe that b-values for peak 1 and 2 are 0.61 and 0.64, respectively, indicating its dominance of the diffusion-limited redox reaction. For the peak 3 and 4, the b-values are 0.81 and 0.89, demonstrating the corresponding redox processes are dominated by pseudocapacitive behavior from storage of Li ions occurring at or near the surface of the electrode material. In addition, figure 9(c) indicates that the contribution ratio of the pseudocapacitive capacity reaches 76.07% at the sweep rate of 0.6 mV s–1. Obviously, the pseudocapacitive contribution increases with the increasing scan rate (figure 9(d)), which are beneficial to the rapid transport kinetics of lithium ions and high rate performance.

Figure 8. (a) CV curves at a scanning rate of 0.2 mV s–1, (b) galvanostatic profiles, and (c) rate performance of the P-TMC anode. (d) Rate performance comparison of P-TMC anode with other reported doped TiO2 nanomaterials. (e) Cycling performance of P-TMC anode at the current rate of 10 C. Inset of figure (e) is the SEM image of P-TMC sample after cycling performance test.
Download figure:
Standard image High-resolution image
Figure 9. (a) CV curves at different sweep rates, (b) the corresponding linear fitting for log (peak current) versus log (sweep rate) to determine the b-value of the anodic and cathodic peaks in the CV curves, (c) capacitive contribution in CV curve at sweep rate of 0.6 mV s–1, and (d) capacitive contribution ratio of at different sweep rates of P-TMC anode.
Download figure:
Standard image High-resolution image
Figure 8(b) displays the charge–discharge profiles of the P-TMC anode at 0.2 C. During the first discharge process, the P-TMC anode delivers a high specific capacity of 284.7 mAh g−1 due to the Li-ion insertion into the active material and the SEI formation. Afterwards, the anode exhibits a reversible capacity of about 185 mAh g−1, with the initial coulombic efficiency (CE) of ∼65.0% during the following initial charge process, meaning lithiate-irreversible process occurs to form an irreversible and ionically conductive Lix TiO2 surface layer in the first charge/discharge cycle [54]. Nevertheless, the CE values rapidly increase and achieve to ∼99% in subsequent cycles. It is noted that there is still large room for increasing the initial CE of the P-TMC anode for practical application. For example, controlling the structure/morphology design of the electrode materials and the cell configuration assembly further [55]. Therefore, the development of a nanostructured P-doped TiO2-based material with optimal architectural design and microstructural engineering will be the focus of our future work in this system.
The improved electrochemical performance for P-TMC sample for LIB application compared to the d-TMC one and TMC sample after annealing was additionally detected using the rate capability measurements at various current rates ranging from 0.2 to 20 C for several consecutive discharge/charge cycles. (figure 8(c) and figure S7). The discharge capacities of 187, 174, 162, 151, 136, and 123 mAh g–1 are recorded at the increasing current rates of 0.2, 0.5, 1, 2, 5, and 10 C, respectively. At the highest current rate of 20 C (2 min per charge or discharge), the specific capacity for P-TMC is 104 mAh g–1, much higher than that of d-TMC (65 mAh g–1) and TMC based one (20 mAh g–1). Moreover, the discharge capacity could be recovered to 176 mAh g–1 with approximately ∼94% capacity retention when the current rate returns to 0.2 C, which represents an excellent rate capability. Compared to the lithium storage performance of other previously reported high efficiency doped titanium oxide-based materials (figure 8(d)), the P-TMC sample exhibits competitive rate capability, owing to improved electronic conductivity induced by P-doping [56–66]. To further verify the improved rate capability of the P-TMC sample, the longer cycling at a high rate of 10 C was also carried out. As it is shown in figure 8(e), even after 2500 cycles at 10 C-rate, the P-TMC electrode exhibits approximately 101 mAh g–1 with a capacity retention of 82.6%. It indicates that the average capacity decay for P-TMC is merely around 0.007 mAh g−1 per cycle, indicating its good cycle life. The good cycling performance of P-TMC may be due to the stable structure, in which the existence of mesopores among TiO2 nanocrystals can buffer the high rate insertion–extraction of Li+ ions during cycling test. As can be seen in the inset of figure 8(e), both spherical-like and mesoporous structure is still preserved after 2500 cycles at 10 C, even the aggregation of nanoparticles occurs. It indicates that the good structural integrity of the P-TMC anode. Additionally, it is seen from table S1 that the as-prepared P-TMC sample composite here not only exhibits competitive rate capability but also better cycling stability in comparison to other TiO2-based nanomaterials reported recently for LIB anodes. These results demonstrated that our designed P-TMC is an ideal anode material for LIBs as the mesoporous structure can increase the contact area with electrolyte by high surface area and the existence of oxygen vacancy as well as P-doping can improve electronic conductivity and shorten the Li+ diffusion path, finally greatly enhancing the lithium ion storage capability.
4. Conclusion
In summary, the phosphorous-doped TiO2 ultrafine nanocrystals (2–8 nm) with high specific surface area of approximately 234.164 m2 g−1 was obtained for LIBs anodes. It was prepared through a hydrothermal process for anatase TiO2 nanocrystals formation followed with the simple gas phosphorylation method for P-doping. P-doping proved to be fruitful, and amplified the Li+ ion storage performance to a comparable level to bare un-doped TiO2 nanocrystals. It delivered a notable high capacity (187 mAh g–1 at 0.2 C), high-rate performance (104 mAh g–1 at 20 C), and cycling stability (∼82.6% capacity retention after 2500 cycles at 10 C with an average capacity loss of only 0.007% per cycle), thereby making the approach promising for practical implementation. This performance improvement could be attributed to boosting the Li+ ion diffusion and deducing the charge transfer resistance after P-doping. This work demonstrates that the simple gas phosphorylation strategy could open up a promising avenue for building versatile P-doped nanomaterials with improved electrochemical properties in efficient energy storage systems.
Acknowledgments
This work was supported by National Science and Technology Council (NSTC), Taiwan (111–2113-M-005-023-, 112-2113-M-005-012-). This work was also financially supported by the 'Innovative Center on Sustainable Negative-Carbon Resources' from The Featured Areas Research Center Program within the framework of the Higher Education Sprout Project by the Ministry of Education (MOE) in Taiwan.
Data availability statement
All data that support the findings of this study are included within the article (and any supplementary files).
Supplementary data (2.6 MB DOCX)