

Abstract
Electrochemical activation is an effective method for synthesizing economically feasible heterogeneous hydrogen evolution reaction (HER) electrocatalysts. Herein, we first synthesized MoO2-Co2Mo3O8 precatalyst, which was electrochemically activated to produce K2Mo3O10 within the original phase to form the heterogeneous structure. The electrochemically activated samples demonstrate exceptional HER activity in alkaline medium, which exhibit a low overpotential of 31 mV at current density of 10 mA cm−2 (135 mV at 100 mA cm−2), as well as a small Tafel slope of 34 mV dec−1. This is due to the creation of multiphase heterostructures that prompt interfacial interactions and accelerate charge transfer. Simultaneously, the creation of additional active sites increases their intrinsic activities. The combined effects collectively enhance the HER performance. The application of this method in the preparation of HER catalysts is still relatively unexplored, thus rendering our work a pioneering contribution to the field.
Export citation and abstract BibTeX RIS
Introduction
With the continuous growth of global energy demand and the increasing severity of population issues, the need for sustainable energy is also increasing [1–5]. Hydrogen (H2) is considered as the most promising energy carrier in the future owning to its high energy density, high combustion heat, and zero carbon emissions [6–8]. The development and application of H2 can alleviate a series of negative impacts caused by conventional energy resources [9]. Electrochemically water splitting is an efficient method for preparing high-purity H2 gas in large scale, which is divided into oxygen evolution reaction (OER) at the anode and hydrogen evolution reaction (HER) at the cathode [10–12]. The development of efficient and stable catalysts can reduce the reaction barriers for OER and HER [13–16]. Although noble metal catalysts (such as Pt, RuO2 and IrO2) exhibit high electrochemical activity for HER and OER, the scarcity and high cost of these materials have prevented their large-scale application, [17, 18] which calls for the design and development of non-precious catalysts with high efficiency and large active area.
At a certain external voltage, the transition metal-based material may be reduced or oxidized in the electrochemical environment, [19, 20] which was first found in OER electrocatalysts. This process will change the structure and composition of the catalysts, so as to their electrocatalytic activity. Metal oxides are a large class of materials that exhibit great potential as OER precatalysts [21, 22]. Their activity can be altered through composite reactions in electrochemical environments, which can be essential for designing more efficient catalysts and has been increasingly investigated in recent years [23, 24]. Recent investigation has found that activating the pristine material at high potential can lead to anodic leaching of Cr in CoCr2O4. Depletion of lattice O and Cr produces O vacancies and surface defects, which enable the transformation of inactive spinel CoCr2O4 into a highly active catalyst with better OER activity than IrO2 in alkaline solution [18]. These previous work demonstrate the great significance of the electrochemical activation method.
Expired by this, many researchers have been working on catalyst reconstruction effect during HER process. For instance, it was found that reconstructing of Ni3P into Ni4P4 can increase the surface active sites, which resulted in a relatively large HER performance [25]. Chen et al reported that in situ conversion of Cu2O@MnO2 to Cu@Mn(OH)2 can result in significant enhancement of its HER activity [26]. A recent work reported that the surface reconstruction of NiMoO4-CoO by chronoamperometry method led to the dissolution of Mo and the formation of K2Mo3O10, which decreased the overpotential from 222 to 130 mV at 100 mA cm−2 in 1 M KOH solution [20]. Clearly, the catalytic performance was significantly improved after the generation of new phases upon activation.
For the preparation of HER catalysts, common methods include tube furnace calcination, [27–29] hydrothermal method, [30–32] electrodeposition method, [33–35] plasma method [36, 37] and etching method [38, 39]. For tube furnace calcination and hydrothermal methods, their advantages are that they can provide a reaction environment higher than room temperature, suitable for long-term and high-temperature reactions. The drawbacks of these methods are cumbersome operation and high energy consumption. The electrodeposition method has the advantages of simple operation, fast reaction speed and mild experimental conditions. The electronic structure of the samples obtained through this method is relatively uniform, which may hinder the unique design of catalytic performance. The plasma treatment can effectively introduce vacancies and defects through doping. However, its high cost and relatively complex operation limit its widespread use. The etching reaction can be carried out at room temperature, but sometimes it cannot fully meet the high temperature requirements for reactions between different materials. The electrochemical activation method is simple and can construct multiphase and heterogeneous structures. However, it currently only focuses on the activation of metal oxides, and the electrochemical activation of other material systems still needs to be explored.
In recent years, transition metal-based HER catalysts, such as MoS2, [40, 41] MoSe2, [42, 43] and MoO2 [44, 45] etc, have been increasingly investigated due to their wide availability and low cost. For example, MoO3 powders with oxygen vacancies can serve as good doping platforms [46]. Huang successfully synthesized low-cost nanostructured MoO2/MoS2/MoP heterojunctions by phosphorylating pre-prepared sea urchin-like MoO2/MoS2 nanorods, demonstrating the good prospects for heterogeneous engineering of MoO2 [47]. Wu reported novel hybrid one-dimensional heterogeneous nanorods (NFPMO) based on Ni–Fe phosphide and MoO2. The overpotential was reduced from 93 to 56 mV at 10 mA cm−2. This study demonstrated the excellent performance of molybdenum oxides in doping works [48]. Due to its high specific surface area, abundant active sites and high structure tunability, the Co-MOF (ZIF-67) has been widely used to prepare efficient HER catalysts with transition metal-based compounds [40, 49–52]. It was reported that successfully synthesized MoS2/CoS2 hetero-nanostructures with abundant 1T-MoS2 phase on ZIF-67. And it exhibited low overpotentials in both acidic and alkaline media, with the overpotentials of 37 mV and 51 mV, and the Tafel slopes of 46 mV dec−1 and 45 mV dec−1, respectively [41].
In this work, we synthesized the MoO2-Co2Mo3O8 precatalyst (denoted as CMO in the following) using ZIF-67 as a template. The precatalyst was electrochemically activated to generate a new phase of K2Mo3O10(3H2O). The K2Mo3O10-MoO2-Co2Mo3O8 (denoted as KCMO in the following) shows a significant improvement in HER performance. The overpotential is greatly reduced from 86 to 31 mV at 10 mA cm−2, and the Tafel slope is dropped from 80 mV dec−1 to 34 mV dec−1. The improved performance is attributed to the optimization of the morphology after electrochemical activation, with increased pores and active sites. The presence of multiple phases enhances the interfacial effect and accelerates the electron transport rate.
Experimental section
Preparation of ZIF-67
Carbon cloth (CC) of 2 × 3 cm2 was immersed in acetone, isopropyl alcohol (IPA) and ethanol solution for ultrasonically cleaning of 30 min in each step. 0.58 g Co(NO3)2·6H2O (99%, Aladdin) and 1.3 g 2-methylimidazole (98%, Aladdin) were separately dissolved in 40 ml methanol and stirred for 30 min. Then, the solution was quickly poured into Co(NO3)2·6H2O solution. In this way, the purple ZIF-67 solution is obtained. Next, CC was put into the purple ZIF-67 solution for 5 h and then washed several times with deionized (DI) water and ethanol. Finally, the ZIF-67 loaded on the CC was put into an oven for drying. The mass loading of ZIF-67 was calculated to be 2.08 mg cm−2.
Preparation of Pt/C on CC
The commercial Pt/C (20 wt%, Aladdin) was drop-casted on CC using catalyst ink. The catalyst ink was obtained by homogeneously dispersing 20 wt% Pt/C and 50 μl Nafion solution (DuPont 5% D520) in 0.5 ml ethanol solution. The mass loading of Pt/C was calculated to be ∼2.0 mg cm−2.
Preparation of CoMoO4
The prepared ZIF-67 was immersed into 40 ml solution containing 0.88 g Na2MoO4·2H2O (99%, Aladdin) and kept at 120 °C for 3 h. After etching, the samples were washed by ethanol and dried overnight to obtain CoMoO4. The mass loading of CoMoO4 was calculated to be 1.97 mg cm−2.
Preparation of MoO2-Co2Mo3O8 (CMO) and K2Mo3O10-MoO2-Co2Mo3O8 (KCMO)
MoO2-Co2Mo3O8 (denoted as CMO in the following) was prepared by simple one-step calcination. 100 mg of MoO3 powder was weighed and placed on a quartz porcelain boat. The prepared Co-MOF was placed directly above the MoO3 powder (Aladdin, 99.95%). 30 min evacuation was carried out to remove the oxygen inside the tube. After that, the tube furnace was heated to 900 °C at a ramping rate of 10 °C min−1 and held for 30 min Ar was used as the reaction atmosphere during this period. CMO was finally obtained with the mass loading of 2.05 mg cm−2.
With the property that the excellent porous ZIF-67 nanostructure can expose more reactive sites, it was used as the initial template for the synthesis, and then the CMO was synthesized by heating and reaction in a tube furnace. Afterwards, an external voltage was applied in the alkaline solution to activate the CMO to produce K2Mo3O10-CMO (denoted as KCMO in the following). Different activated samples are obtained by applying the voltages of −1 V, −1.4 V and −1.8 V for 80 min, respectively, which are named as KCMO-1, KCMO-2, and KCMO-3 for simplification. The mass loading of KCMO was calculated to be 2.01 mg cm−2.
The above experimental procedures including the choose of the raw materials are based on the in-depth investigation of previous related work, combined with the optimization through our own controlled experiments.
Material characterization
The morphology of the samples was determined by scanning electron microscopy (SEM, Nova Nano SEM450). The crystal structures of the samples were measured by x-ray diffraction (XRD, Bruker D8 Advance, Cu Kα
radiation) (scan rates: 6° min−1 and scan range is 5°–90°) and transmission electron microscopy (TEM, JEM-2100F, JEOL, 200 kV). The electrochemical properties of the samples were measured using the Vertex. C EIS electrochemical workstation (V01338). Nitrogen-saturated 1.0 M KOH were used as the alkaline electrolytes. The saturated calomel electrode (SCE), the catalyst loaded on CC and graphite rod were used as reference, working and counter electrodes, respectively. Linear scanning voltammetry (LSV) curves were obtained with a scan rate of 5 mV s−1 with iR compensation. Cyclic voltammetry is performed by setting different scan rates in the non-Faraday interval scan. With the following equation:  (where Δj refers to the difference in current density between the cathode and anode and v refers to the scan rate), we can obtain the double layer capacitance (Cdl). Next, the electrochemical surface area (ECSA) of the sample is calculated according to:
  (where Cs refers to the specific capacitance). The electrochemical impedance spectroscopy (EIS) measurements were carried out to obtain the charge transfer resistance (Rct
) in the frequency range of 3 MHz–0.01 Hz with AC amplitude of 5 mV at the overpotential of 300 mV.
(where Cs refers to the specific capacitance). The electrochemical impedance spectroscopy (EIS) measurements were carried out to obtain the charge transfer resistance (Rct
) in the frequency range of 3 MHz–0.01 Hz with AC amplitude of 5 mV at the overpotential of 300 mV.
Results and discussion
Analysis of the CMO
Before electrochemical activation, it is necessary to prepare precatalysts with decent HER performance and component controllability. Figure S1 (in the supporting information) provides the XRD patterns of the comparison samples. The peaks at 2θ = 13.2°, 26.5° and 32.1° are indexed to (001), (002) and (−131) planes of CoMoO4 (JCPDS No. 21–0868). Since CoMoO4 is an excellent catalytic material for HER, [53, 54] its performance is also compared in this work. As shown in figure 1(a), the XRD patterns show the coexistence of two phases, MoO2 (JCPDS No. 73–1249) and Co2Mo3O8 (JCPDS No. 71–1423), in the precatalyst. The peaks at 2θ = 26.0°, 37.3°, 53.6°, 60.6° and 66.9° are indexed to (011), (−211), (220), (031) and (−231) planes of MoO2 (JCPDS No. 73–1249) and those at 17.9°, 25.3°, 36.0°, 45.5° and 85.7° are originated from the (002), (102), (112), (203) and (217) planes of Co2Mo3O8 (JCPDS No. 71–1423), respectively. According to the calculation in table S1 of the supporting information, the ratio of MoO2 and Co2Mo3O8 were found to be: MoO2:Co2Mo3O8 = 4:1. Therefore, MoO2 is the main phase in the precatalyst. Meanwhile, the peaks at 40.5° and 73.7° are indexed to (110) and (211) planes of Mo (JCPDS No. 04–0059), which is probably due to the decomposition of MoO2 at high temperature [55]. From figure 1(a), it can be seen that the content of both Co2Mo3O8 and Mo only accounts for a small percentage. Therefore, the precatalysts are mainly contain MoO2.

Figure 1. XRD patterns (a) and SEM images (b) and (c) of CMO. The red hearts, blue spades and brown clubs represent the diffraction peaks for MoO2, Co2Mo3O8 and Mo, respectively.
Download figure:
Standard image High-resolution imageMorphological and structural changes during the synthesis process were studied by SEM. Figure S2 shows SEM images of ZIF-67 loaded on CC. Evidently, the ZIF-67 nanosheets (NSs) are uniformly distributed and the leaf-like morphology also contains a lot of pores, which can be used as an excellent template for the synthesis of high-performance catalysts. The SEM images in figures 1(b) and (c) depict the nanostructures of CMO, which is mainly composed of some blocks stacked and adhered to each other. As seen, there are also some small pores in the nanostructures.
We used a typical three-electrode system for HER performance evaluation. Figure 2(a) shows the LSV curves of the CMO tested in 1 M KOH solution. Figure 2(b) presents the Tafel slopes obtained by fitting the LSV curves. With iR compensation, the overpotential of CMO at 10 mA·cm−2 (η10) reaches 86 mV and the Tafel is 80 mV dec−1. Even at 100 mA·cm−2 (η100), the overpotential is as low as 173 mV. For ZIF-67, the overpotentials at η10 (η100) are 329 mV (547 mV) and the Tafel slope is 180 mV dec−1. For CoMoO4, the overpotentials at η10 (η100) are 100 mV (404 mV) and the Tafel slope is 143 mV dec−1. Clearly, CMO has better HER catalytic activity at both small and large current densities as compared to CoMoO4 and ZIF-67. This indicates that CMO has a high potential as efficient HER catalyst. For comparison, the performance of Pt/C is also evaluated, which gives an overpotential of 28 mV at η10 and a Tafel slope of 36 mV dec−1. In Figure S3(a), CV curves of CMO with various scan rates from 10 to 100 mV s−1 are presented, from which the Cdl is calculated to be 52.1 mF cm−1. Accordingly, the value of ECSA is obtained to be 1302.5 cm2. This value is among the high range as compared to many previous reported similar samples [56, 57]. Based on Figure S3(b), the Cdl of CoMoO4 is 43.9 mF cm−1, and the value of ECSA is 1097.5 cm2. Clearly, CMO has a larger electrochemically active area as compared to CoMoO4. The surface and bulk characteristics of CMO may contribute to this difference. It can be seen from figure 1(a) that the sample has two-phase coexistence structure, which can increase the heterogeneous interface and promote the production of more active sites through synergic effect of the two. From figures 1(b) and (c), the nanostructure of CMO can accommodate a large number of active sites.
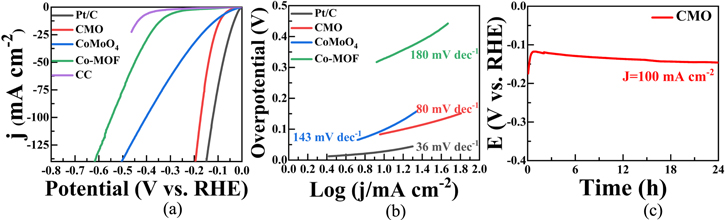
Figure 2. (a) HER polarization curves for Pt/C, CMO, CoMoO4 and ZIF-67 in 1 M KOH. (b) The corresponding Tafel plots of (a). (c) Stability test of CMO under a current density of 100 mA cm−2.
Download figure:
Standard image High-resolution imageFigure 2(c) exhibits the chronoamperometry measurement of CMO over a period of 24 h to assess its stability. The current was kept constant at 100 mA cm−2 during this period. An interesting phenomenon was observed during the stability test, where the sample voltage gradually decreased after ∼1 h and finally reached the peak at ∼80 min. The voltage remained unchanged during the following period. This phenomenon indicates that the sample undergoes noticeable electrochemical stabilization process. As previously reported, [20] an external voltage can be used to electrochemically activate the sample surfaces, thereby forming a more active catalyst. Therefore, we conducted controlled experiments by applying different electrochemical activation voltages to the CMO samples. The influence of the activation process on their HER performance was studied by characterizing the morphology and electrochemical properties after activation.
Characterization of KCMO
Figure 3(a) illustrates the synthesis procedure of KCMO, and the final sample was synthesized by a two-step method. The XRD pattern in figure 3(b) clearly shows an additional characteristic peak at 9.8°, which evidence the new phase formation after electrochemical activation. Compared with the above XRD results, the activated samples still possess MoO2, Co2Mo3O8 and Mo [58]. The XRD peaks at 2θ = 9.8°, 27.6°, 30.0° and 42.4° are attributed to (110), (022), (420) and (350) planes of K2Mo3O10(3H2O) (JCPDS No. 11–1746), respectively. From Figure S4, it shows that the XRD diffraction peaks of the catalyst match well with that of K2Mo3O10(3H2O) even at a very small peak position. The generation of this new phase has an impact on the morphological structure and electrochemical properties of the sample. It will stimulate synergistic catalysis in the composite catalyst, which promotes the reactions of different radicals during the reaction process and improve the catalytic performance of the reaction products [59].
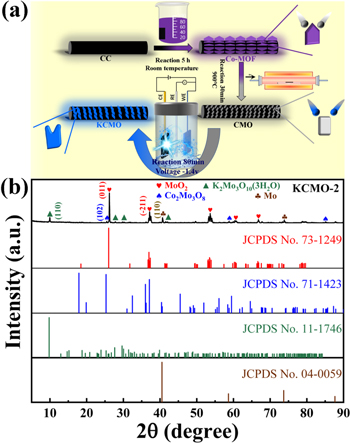
Figure 3. (a) Schematic illustration of the preparation procedure for KCMO-2. (b) XRD patterns of KCMO-2. The KCMO-2 was formed with the electrochemical activation. The red hearts, blue spades, green triangles and brown clubs represent the diffraction peaks for MoO2, Co2Mo3O8, K2Mo3O10 and Mo, respectively.
Download figure:
Standard image High-resolution imageThe morphological and structural changes during the synthesis process are investigated by SEM. As seen in figures 4(b) and (e), the morphology of the samples changes from a blocky stacked structure to a sponge-like structure after the electrochemical activation. This leads to an increase in the active surface area of the sample and enhanced the mass transport capacity through the pores, which accelerates the production of adsorbed H and thus the electrochemical process [60, 61].
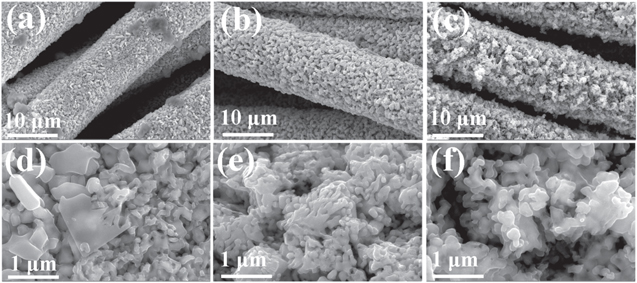
Figure 4. SEM images of KCMO-1 (a) and (d), KCMO-2 (b) and (e), and KCMO-3 (c) and (f).
Download figure:
Standard image High-resolution imageFrom XRD results shown in Figure S5, the phase compositions of KCMO-1 to KCMO-3 are the same. The SEM analysis shows that the overall structure is preserved after activation at different voltages. In figures 4(a) and (d), the sample is not fully activated at −1 V and there is still a large amount of residual CMO bulk nanostructures. Only part of the morphology has been modified, which results in a small amount of pore structure and affects the electron transfer efficiency of the catalyst. From figures 4(c) and (f), the voltage of −1.8 V has an overactivation phenomenon on the sponge-like structure, which causes it to lose its original stability. At the same time, the skeletonization of the structure on CC can be seen, with fewer samples loaded on it. Those results are unfavorable for enhancing the HER activity. On the other hand, the sample activated at −1.4 V exhibits the best morphology.
The microstructure of KCMO was further characterized by TEM. As shown in figures 5(a) and (b), the nanostructures are stacked on top of each other, which are consistent with the SEM results. Figures 5(c)–(f) are high resolution TEM (HRTEM) images. The lattice streak of Co2Mo3O8(102) crystal plane is observed in figure 5(e) with a lattice spacing of 0.35 nm. At the same time, the lattice streak of the MoO2(−211) plane is observed with a spacing of 0.24 nm [62]. This indicates that the two phases of CMO still present after activation, which form good interfaces as shown in figure 5(c). The lattice stripes of the Mo(110) crystal plane are observed in figure 5(d) with a crystal plane spacing of 0.22 nm. Figure S6(a) shows the selected area electron diffraction (SAED) patterns for Mo, which is in agreement with the cubic crystal structure symmetry of Mo. Metal incorporation can promote charge transfer between phases by increasing their conductivity [63]. Therefore, the production of Mo plays a significant role in the improvement of the HER catalytic performance [64]. In figure 5(f), the K2Mo3O10(3H2O) (023) crystal plane with a crystal plane spacing of 0.23 nm are observed, indicating that a new phase is generated after electrochemical activation and that both MoO2 and Co2Mo3O8 are still in presence at the same time. This is in consistent with above XRD analysis. Meanwhile, the interface between each phase can be seen in figure 5(c). Strong chemical bonds are formed between them to accelerate the electron transfer and promote the synergistic catalytic effect [62, 65]. The large number of active sites exposed at the edge sites can facilitate the efficient catalytic reaction. Meanwhile, in figures S7(a)–(e), the elemental mapping images confirm the presence of K element. The results obtained by energy dispersive spectroscopy (EDS) are summarized in table S1 of the supporting information.
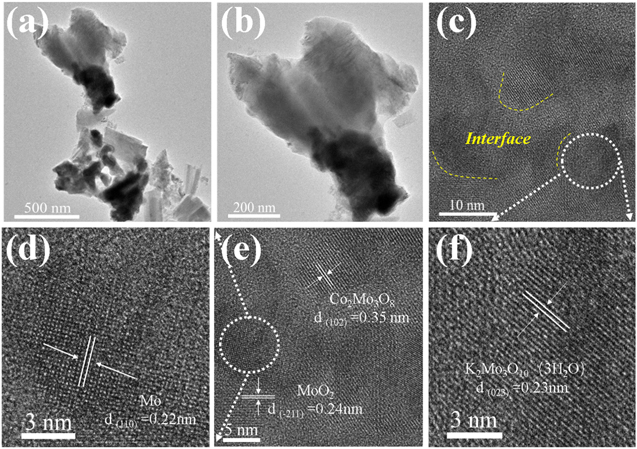
Figure 5. TEM (a and b) and HRTEM (c)–(f) images of KCMO-2. The yellow dotted lines in (c) indicate the location of the interfaces.
Download figure:
Standard image High-resolution imageElectrochemical performance of KCMO
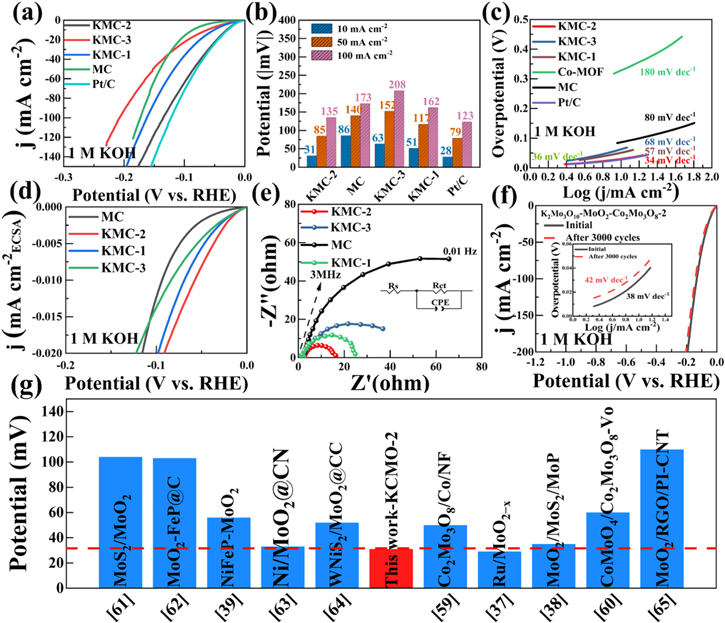
To evaluate HER activities of KCMO samples, we used a typical three-electrode system for testing. First, all samples were examined in 1 M KOH alkaline solution. Figure 6(a) depicts the HER polarization curves of the initial CMO and KCMO samples. Clearly, the best catalytic performance of KCMO-2 can be seen from the LSV curves. From figure 6(b), the overpotential for KCMO-2 at η10 (31 mV) is much smaller than that of KCMO-1 (51 mV) and KCMO-3 (63 mV). The overpotentials of the samples at η100 are 162 mV (KCMO-1), 135 mV (KCMO-2), and 208 mV (KCMO-3), respectively, which indicates that the excellent HER catalytic activity is maintained even at high current densities for KCMO-2. This evidences that the sample performance is optimized at −1.4 V, in agreement with the SEM results.
Figure 6. HER performance in 1 M KOH. (a) Polarization curves for Pt/C, KCMO-1, KCMO-2, KCMO-3, CMO and ZIF-67. (b) Overpotentials required to reach different current densities. (c) Corresponding Tafel plots of (a). (d) Specific activity of KCMO-(1, 2, 3) and CMO normalized by ECSA. (e) Nyquist plots of KCMO-1, KCMO-2, KCMO-3 and CMO. (f) LSV curves of KCMO-2 before and after 3000 CV cycles. Inset in (f) shows the corresponding Tafel plots of KCMO-2 before and after 3000 CV cycles. (g) Overpotential comparison of this work with the reported electrocatalysts.
Download figure:
Standard image High-resolution image
To gain insight of the reaction kinetics and to study the kinetic properties of HER, Tafel slope of the sample is an important criterion for evaluation. The data on the Tafel slopes of the catalysts are given in figure 6(c) for KCMO-2 (34 mV dec−1), CMO (80 mV dec−1), KCMO-1 (57 mV dec−1), KCMO-3 (68 mV dec−1) and Pt/C (36 mV dec−1). As shown, KCMO-2 has a very small Tafel slope comparable to that of Pt/C, indicating its good intrinsic activity. The slope of Pt/C on CC is in good agreement with the previously reported value, [66] which verifies the reliability of our measurements. The smallest Tafel slope for KCMO-2 indicates that the synergic effect between each components accelerates the HER kinetics for faster reaction kinetics [67].
In figure 6(g) and table S2, the results of our samples are compared with several previously reported results in alkaline environment. The performance of the present work is found to be superior to most non-precious metal catalysts, such as Co2Mo3O8/Co/NF (50 mV and 52 mV dec−1), [57] CoMoO4/Co2Mo3O8-Vo (60 mV and 52 mV dec−1), [59] MoS2/MoO2 (104 mV and 76.1 mV dec−1), [68] MoO2-FeP@C (103 mV and 48 mV dec−1), [69] Ni/MoO2@CN (104 mV and 76.1 mV dec−1), [70] WNiS2/MoO2@CC (52 mV and 49 mV dec−1) [71] and MoO2/RGO/PI-CNT (110 mV and 68 mV dec−1) [72]. Compared to these reports, our work has various advantages, such as the synergistic catalytic effect between the multiphase in the activated sample, the tight binding between the nanostructures to accelerate the electron transport and the enhanced conductivity through the incorporated metallic Mo. Also, the performance of the activated sample is better than that of CMO and ZIF-67. The overpotential of the activated sample at η10 (31 mV) is close to that of Pt/C (28 mV), indicating its superior HER activity. The generation of the new phase K2Mo3O10 after activation increases the interfacial interaction and accelerates the electron transport ability. In the end, the formation of new phases enhances the synergistic catalytic effect and improves the catalytic activity of the sample.
The HER process in alkaline solutions is divided into three steps:


where H* denotes the catalytic site of adsorbed H. The Tafel slope obtained for the KCMO suggests that the HER reaction proceeds through Volmer–Heyrovsky. The transport of electrons and hydrogen atoms have significant impacts on the Tafel slope [66]. As shown in the SEM images [figure 4(e)], KCMO-2 possesses a spongy structure that can accelerate the charge transfer rate. The synergistic effect of multiphase coexistence also provides the conditions for electron transport, indicating that the construction of spongy structure and multiphase coexistence structure have positive effects on the regulation of catalytic activity. From the Tafel plots of KCMO-1, KCMO-2, KCMO-3, CMO and Pt/C, the exchange current densities (j0) can be obtained. Obviously, j0 of KCMO-2 (1.33 mA cm−2) is larger than that of KCMO-1 (1.28 mA cm−2), KCMO-3 (1.24 mA cm−2) and CMO (1.11 mA cm−2) [see figure S8 and table S2 for details]. This result further validates the excellent intrinsic activity of KCMO-2.
An important parameter to measure the redox on the electrode surface is ECSA. Figures S9(a)–(c) show the CV curves obtained from different samples with the scan rates in the range of 10–100 mV s−1 in 1 M KOH solution. As shown in the Figures S9(d) and (e), the comparative data of Cdl and ECSA are given for several samples. The Cdl values of KCMO-2, KCMO-1 and KCMO-3 are 117.1 mF cm−2, 69.9 mF cm−2 and 65.4 mF cm−2, respectively, indicating that the activated samples have a high activity. The abundance of active sites enhances the HER performance of the samples [68, 73]. Accordingly, the values of ECSA for KCMO-2, KCMO-1 and KCMO-3 are found to be 2792.5 cm2, 1747.5 cm2 and 1635 cm2, respectively. Clearly, KCMO-2 has the largest ECSA values, which is significantly larger than most previous reports [38, 74, 75]. The presence of metallic Mo in KCMO is evident from the XRD of figure 3(b) and Figure S6. Although the content of metallic Mo is low, it increases the electrical conductivity of KCMO and promotes the electrical connection between isolated active sites and CC. This indicates that not only the number of active sites is increased after electrochemical activation, but also the intrinsic activity of each active site is promoted [76]. As shown in figure 6(d), the LSV curves normalized by ECSA indicate that the intrinsic activity of KCMO-2 is still the best, showing excellent HER catalytic performance.
The equivalent circuit model used for the EIS simulation is presented in figure 6(e). In the Nyquist plots, the semicircle is related to the charge transfer resistance (Rct ). We can see that KCMO-2 has the best impedance performance as compared to other samples under other conditions, exhibiting the smallest Rct of 6.39 Ω. This indicates that KCMO-2 has the highest charge transfer efficiency and the best charge transfer kinetics. In short, the activated samples have excellent electron transport ability and large electrochemical active area, which lead to a great improvement of the HER catalytic performance as compared to the pre-activated samples. This proves the key role of activation engineering on the HER performance improvement of the samples.
In addition, cyclic voltammetry is used to investigate the electrochemical stability of the activated samples. As shown in figure 6(f), the LSV curves of the samples were almost unchanged after 3000 cycles, which indicated the long-term stability under alkaline solution. Furthermore, the Tafel slope has hardly changed and still exhibits excellent reaction kinetics. From figure S10 of the supporting information, it is clear that the samples possess good stability with negligible fluctuations in potential at currents of 20, 50 and 100 mA cm−2 over 24 h. After the electrochemical stability tests, we have performed XRD and SEM measurements for KCMO-2. As shown in figure S11(a), the phase composition of the sample remains the same after the stability test. And in Figures S11(b) and (c), the morphology of the samples after the stability test is almost unchanged. In brief, it can be seen that the sample is highly stable under normal working conditions.
Conclusion
In summary, the MoO2-Co2Mo3O8 (CMO) nanostructures were transformed into sponge-like structure after electrochemical activation, which produced more active sites and improved the intrinsic catalytic activity. The stable presence of metallic Mo in the sample also enhances its electrical conductivity. Meanwhile, a strong synergistic catalytic effect was generated between different phases with the interfacial effect to accelerate the electron transport. The overpotentials of K2Mo3O10 MoO2-Co2Mo3O8 (KCMO) are found to be 31 mV and 135 mV at current densities of 10 mA cm−2 and 100 mA cm−2, respectively, with the Tafel slope as low as 34 mV dec−1 in alkaline conditions. Our work demonstrate that high-performance catalysts can be prepared using electrochemical activation method, not only through morphological modification, but also by generating new catalytic phases.
Acknowledgments
This work was supported by Science and Technology Planning Project of Inner Mongolia (2022YFXM0010) and Local Science and Technology Development Project of the Central Government (2021ZY0006).
Data availability statement
All data that support the findings of this study are included within the article (and any supplementary files).
Conflict of interest
There are no conflicts to declare.
Supporting information
The Supporting Information is available free of charge on the website, which includes additional experimental results etc.
Supplementary data (10.6 MB DOCX)