

Abstract
Tilted fiber Bragg grating (TFBG) is a widespread approach for developing refractive index (RI) sensors. The unique optoelectronic properties exhibited by MXene are expected to enhance the performance of TFBG-SPR sensors. In this study, a Ta2C coating appropriate for sensing was obtained by optimizing the photo-deposition time, which addressed the challenge of preparing large areas of MXene. The uniform coating of the few-layer Ta2C increases the wavelength sensitivity and FOM of the sensor to 229.5 nm/RIU and 2228.15 respectively. This significant enhancement was attributed to an ordered MXene phase of the grown Ta2C. The energy band theory verified the metallic nature of the Ta2C and the amplification effect on the RI response. Finite element analysis demonstrated that the stronger absorption band of Ta2C facilitated the generation of surface plasmon polariton. Based on the above benefits, the sensor detected melamine in milk with a detection limit of 7.9 × 10⁻⁹ M. The TFBG/Au/Ta2C sensor is a promising approach for biochemical analysis and trace detection.
Export citation and abstract BibTeX RIS
1. Introduction
Surface plasmon resonance (SPR) sensors provide real-time continuous monitoring of dynamic processes, which is a unique advantage in biochemical sensing [1–3]. Among them, fiber optic SPR sensors have attracted more attention due to easier integration and miniaturization [4]. SPR originates from the interaction of evanescent waves with plasmonic materials (usually Au and Ag). The surface plasmon (SP) wave with the same frequency is resonated with the evanescent wave propagating to the metal layer [5]. For this consideration, various structures have been developed to enhance the fiber surface energy and produce stronger resonances, so as to satisfy the SPR excitation conditions. Besides, the optical field energy is leaked from the core region by disrupting the total reflection conditions of the fiber, such as physically etching or stretching the fiber [6]. However, this approach inevitably leads to energy loss, which results in a broadening of the SPR spectrum, though it effectively enhances the intensity of the evanescent wave. Additionally, growing metal films on the irregular surface of these treated fibers is challenging [7]. These factors induce a low spectral resolution of the leaky mode fiber optic sensor. Different from the above leaky mode fiber optic sensors, TFBG emerges owing to the non-destructive, high resolution, and easy modulation properties.
TFBG is made of a single-mode fiber which is written as a Bragg grating structure at the core. Therefore, it can couple the optical field energy to the cladding and surrounding medium while maintaining structural integrity [8]. This property allows a simple deposition method to coat the metal film [9, 10]. Additionally, the cladding mode propagates a significant amount of optical field energy, facilitating coupling to SP. The TFBG after depositing a 50 nm thick Au film has a dramatic enhancement in external energy, contributing to a remarkable enhancement of the SPR [11]. Moreover, the SPR peaks appear as an envelope of multiple cladding modes. The accuracy is substantially improved by corresponding the SPR peak to each comb peak, even if the SPR peaks have a broad spectrum [12]. Nonetheless, SPR requires electric field polarization through the metal layer and thus radial electric field polarization in the fiber waveguide [13]. Analysis of the electric field response of the SP and fiber is needed to realize the optimal SPR response. Although noble metals are widely used as plasmonic materials, they suffer from defects such as strong confinement effects and weak bioaffinity. Two-dimensional (2D) materials can be feasibly employed to improve the application scenario of fiber-optic SPR sensors. MXene, antimonene, borophene, and and other 2D materials have been used as functional layers for sensing due to their bioaffinity [14–20].
MXene is an ideal 2D material that has emerged recently. Taking advantage of the high transparency and broadband saturable absorption properties, MXene saturable absorbers have been integrated with various laser resonators [21, 22]. In contrast to graphene and other 2D materials, MXene has a unique accordion-like structure, which boosts the specific surface area and facilitates the adsorption of molecules [23]. Furthermore, the considerable number of groups on the surface of MXene simplifies the modification of biomolecules (aminosilane-functionalized, noncovalent adsorption, coordination interactions) and promotes binding to various solvents [24, 25]. A more fundamental difference is the excellent plasmonic properties of MXene. First, it has a wider visible-near-infrared absorption band covering the operating wavelength of TFBG [26, 27]. The surface plasmonic frequency of MXene sheets can be tuned in the mid-infrared region by controlling sheet functionalization and thickness [28, 29]. Second, MXene's bandgap structure presents metallic properties and possesses strong SPR features in terms of the electron concentration, plasmonic frequency, and electric field confinement properties [30, 31]. Theoretical calculations demonstrated that the sensitivity of the SPR sensor can be significantly improved through the optimization of the number of MXene layers [32, 33]. Therefore, sensors using MXene nanosheets as gain media for SPR sensing have emerged. Chen et al achieved an effective SPR enhancement using photo-deposited thicker Ti3C2-MXene nanosheets on fibers [34]. Although this coating is 5 μm thick, the hydrophilic functional groups of the material facilitate full contact between the analyte and the sensor surface, which increases the effective sensing area. The plasmonic hybridization of Au/MXene system has been studied for SPR sensing [35]. These fascinating properties motivated the development of the MXene-based sensor. However, the growth of large-area, continuous, and uniform 2D MXene is the primary issue for the application of MXene in fiber optic SPR sensors. In addition, the SPR sensitization mechanism of MXene requires in-depth study to optimize the sensor performance.
Considering the above issues, an Au film and few-layer Ta2C MXene wrapped TFBG sensor was proposed in this study to improve the sensing sensitivity. First, a large, uniform Ta2C coating was grown on the surface of the Au film by a photo-deposition method. The challenge of preparing 2D materials on fiber-optic structures is solved by this approach. Secondly, the plasmonic properties of Ta2C and Au films were analyzed. The superior properties of the TFBG/Au/Ta2C sensor were ascribed to the proper response of TFBG/Au and the additional sensitivity of Ta2C, which were verified by the energy band theory and finite element method (FEM). Moreover, the introduction of Ta2C broadened the detection environment of the sensor and enabled the detection of melamine in milk. It is expected to be further extended to the detection of other biochemical molecules.
2. Experimental section
2.1. Fabrication of TFBG/Au/Ta2C sensor
The TFBG was obtained by inscribing a grating on a single-mode quartz fiber using the phase-mask plate method. A high pulse excimer laser was focused onto the mask plate. Interference fringes formed a periodic RI change within the fiber core. The tilt angle of the grating was modulated by rotating the mask plate along the optical axis. Au films were deposited using vacuum thermal evaporation. A 50 nm thick Au film was deposited at a rate of approximately 7 × 10⁻⁵ Pa, 0.2 Å s−1. Subsequently, the TFBG was rotated 180 degrees axially and re-deposited under the same conditions to ensure the complete coating of the Au film. Ta2C coating was deposited using a photo-deposition method. The prepared TFBG/Au sensor was connected to the optical path, and the sensing area was immersed in a Ta2C dispersion at a concentration of 2 mg ml−1. The plasmonic local electric field led to the adsorption of Ta2C nanosheets on the Au film, which facilitates the deposition of materials on non-planar structures. Growth spectra were recorded to analyze the optimal deposition time.
2.2. Sensing optical path setup
The sensor was encapsulated in a PDMS-based sensing cell (width: 2 μm, height: 2 μm, length: 3.8 cm) to facilitate interaction with the analyte. A microfluidic peristaltic pump (QHZS-001B) was utilized to facilitate the injection of the analyte and control of the flow rate. A hybrid light source (ASE-CL-30-M, SLD-1470-10-B) was adopted to ensure a wide spectral band covering the detection band of the sensor. The spectra were analyzed by a high-resolution spectrometer (Yokogawa AQ 63700). Different concentrations of ethanol were taken as the analytes. Their RIs were modulated on demand using an Abbe refractometer (DR-A1).
2.3. Characterization
The microscopic morphology of the sensor surface Au film and Ta2C were conducted using scanning electron microscopy (SEM, Zeiss Gemini Ultra-55) and TEM (JEM-2100F). The thickness of the Ta2C nanosheets was determined by atomic force microscope (AFM, Horiba SmartSPM). The lattice features of Ta2C were analyzed by HRTEM and SAED. XPS (Thermo Fisher Scientific 250Xi), Raman spectroscopy (Horiba HR Evolution), and energy dispersive spectroscopy were employed to determine the composition and valence of the plasmonic structure in the sensing region. The Raman spectrum was obtained using a 532 nm exciting laser, with 1200 grooves per 1 mm, ×50 objective lens, 1 μm laser spot, and 8 s of acquisition time.
3. Results and discussion
3.1. Design and analysis of TFBG-SPR sensor
The greatest advantage of TFBG spectrum is the dense comb-like peaks. The SPR mode is supported under the Au layer attachment. Typical TFBG-SPR transmission spectra are shown in figure 1(a). The core mode propagating within the fiber core results in a signal peak located at the spectral Bragg wavelength. Since it responds more to the changes in temperature and stress of the fiber and less to the external environment, it provides a benchmark for avoiding errors induced by interfering factors [36]. The reflection of the light beam by the grating caused part of the light to be coupled into the cladding to form a cladding mode; the cladding modes with different effective indices were manifested as peaks of different wavelengths in the comb spectrum. Owing to the coating of the Au film, the specific cladding mode can be coupled to the SP at the Au/cladding interface, expressed as the SPR peak at the wavelength corresponding to such an effective index [37]. Figures 1(b), (c) shows the cross-sectional electric field distribution and field profiles for bare TFBG and Au-coated TFBG. The SPR supported by the Au-coated TFBG generates a strong electric field, which causes a significant increase in the energy density outside the fiber, especially at the upper and bottom ends of the fiber. The SPR wavelength is intimately related to the RI of the surroundings, demonstrating a red shift of the peak with the increase in the effective index [38]. In addition, the wavelength and amplitude of the comb peak shift with RI change, as shown in figure 1(d). The amplitude is extremely sensitive to small RI changes and the wavelength can be effective over a larger RI range. The wavelength shift of the signal peak, in this case, can be described as:
where  and
and  denote the wavelength shift of the j-order cladding mode and RI change, respectively;
  and
and  indicate the grating period and grating tilt angle, respectively;
  and
and  represent the effective indexes of the core mode and cladding modes, respectively. Since
  and
and  are insensitive to changes in RI, there are: [39]


An approximation of equation (1) yields the following relationship: [40]

This allows the detection of RI changes by analyzing the shift of the resonance wavelength. Figure 1(e) shows the linear variation of the RI-SPR dip, demonstrating the potential for quantitative detection. Notably, the cladding modes with different effective indices have different sensitivities to the RI response. Therefore, the wavelength sensitivity and figures of merit (FOM) of signal peaks 1–5 were analyzed to determine the optimal signal peak. Figure 1(f) presents the performance of each signal peak measured regarding wavelength sensitivity and FOM. The second peak has the best sensing performance in these metrics. Given the above results, peak 2 was selected to measure the sensor performance in the subsequent experiments.

Figure 1. (a) Transmission spectra of TFBG-SPR sensors in analytes with different RIs. (b) Simulation of the electric field distribution in the cross section of bare TFBG and Au-coated TFBG. (c) Electric field profile at the interface of fiber and analyte. (d) TFBG-SPR spectra (solid line) and theoretical SPR spectra (dashed line) at different RIs. (e) Transmission spectra of SPR resonance peaks with change in refractive index. (f) Performance comparison of SPR signal peaks.
Download figure:
Standard image High-resolution image3.2. Development and characterization of TFBG/Au/Ta2C sensor
Ta2C thin film was grown on the surface of the Au film to form an Au/Ta2C hybrid plasmonic structure and hence further improve the plasmonic photoelectric response of the sensor. A photo-induced deposition method was employed to obtain high-quality few-layer Ta2C film. The optimal enhancement conditions were explored by varying the growth time to modulate the film thickness. Figure 2(a) exhibits the surface and cross-sectional morphology of bare Au and Au/Ta2C structures with growth times of 60–180 min, respectively. Concerning the pure Au sensor structure, the surface was a uniform and flat Au film with a thickness of 50 nm. With the growth time increasing to 60 min, the Au film surface gradually became mottled, and the cross-section presented a sporadic distribution of Ta2C nanosheets. The markings in figure 2(a2) confirmed the growth of Ta2C. As the growth time increased to 120 min, the shadow of Ta2C appeared in a large area, and clear, continuous Ta2C films appeared in the cross-sectional view in figure 2(a3). Besides, a white agglomeration appeared on the sensor surface when the growth time reached 180 min. The cross-sectional view in figure 2(a4) demonstrates the stacking and agglomeration phenomenon caused by Ta2C over-deposition. This Ta2C agglomeration was up to several hundred nanometers thick and formed a macroscopic granular structure. The sensing spectra of each structure were plotted to measure the specific sensing performance. The increase in Ta2C thickness was visualized in the detection spectrum as a redshift in the resonance wavelength. However, the increase in sensitivity was not monotonically with an increase in the thickness of Ta2C. Figure 2(b) compiles the variation of wavelength sensitivity and FOM with growth time. The increase in sensitivity from 0 to 120 min growth time corresponded to the favorable growth of Ta2C. The sensitivity and FOM reached 229.5 nm/RIU and 2228.15 at 120 min, which was a significant improvement relative to the uncoated sensor. The sharp decrease in sensitivity at 180 min was induced by the over-thick Ta2C film that hindered the interaction of the sensor with the external environment. The additional energy loss introduced by the disordered stacking of Ta2C suppressed the SPR, leading to the insignificant SPR signal spectrum in the inset of figure 2(a4). Similarly, the resonance peak was finely red-shifted after 120 min due to the over-thick growth of the Ta2C film. Spectral changes during growth (figure 2(c)) were also recorded to measure the growth of Ta2C. The resonance wavelengths of the key signal peaks exhibited a redshift with time. The amplitude of the resonance peaks also gradually increased with time. After about 120 min of growth, the change in the key wavelength shift became weak and only changed in amplitude, which was a disturbance caused by the thick coating [41]. The shift of the SPR wavelength was minor throughout the growth process. This phenomenon can be attributed to the decrease in RI derived from the gradual deposition of Ta2C dispersion. The spectrum of the TFBG/Au/Ta2C sensor with the ideal morphology and the optimal sensing performance is plotted in figure 2(d) and has a 1.2 nm shift in resonance wavelength relative to the TFBG/Au sensor. This enhancement was confirmed by subsequent characterization and analysis.

Figure 2. (a) Surface and cross-sectional morphology as well as sensing spectra of Au/Ta2C sensors with different growth times. Scale bars: 20 μm and 200 nm. (b) Comparison of wavelength sensitivity and FOM of different growth times. (c) Spectra as a function of growth time during Ta2C deposition. (d) Detection spectra of 1.3601 RI before and after Ta2C growth.
Download figure:
Standard image High-resolution imageThe Au/Ta2C structure was characterized in various aspects for subsequent analysis. The transmission electron microscope (TEM) image in figure 3(a) demonstrates the favorable deposition of Ta2C on Au film. High-resolution transmission electron microscopy (HRTEM) images (figure 3(b)) presented the [1010] crystalline surfaces of the grown Ta2C and had a good crystalline state where the planar spacing of Ta-Ta and Ta-C were 2.8 Å and 2.5 Å, respectively [42, 43]. The inset displays the selected area electron diffraction (SAED) pattern in the Ta2C [0001] axial direction. The developed [ ], [
], [ ], and [
 ] planes suggested that the grown layer conformed to the MXene phase [44]. AFM was employed to analyze the thickness of the Ta2C nanosheets. The height profile in figure 3(c) indicates that the thickness of the nanosheets is approximately 3.3 nm. Subsequently, x-ray photoelectron spectroscopy (XPS) was adopted to qualitatively analyze the elemental composition and chemical state of the Au/Ta2C structure. A high-resolution spectrum of the Ta 4 f region is depicted in figure 3(d), which reveals a dominant oxidation state characteristic peak of Ta5+ at 26.1 eV, as well as a relatively pronounced oxidation state characteristic peak of Ta4+ present at 23.4 eV. In addition to the 4f eigenpeak present at 22.4 eV, two eigenpeaks at 24.6 eV and 28.1 eV arising from the TaCx 4f5/2 and TaCxOy 4f5/2orbitals were also present [45]. These peaks verified that a unique MXene phase was obtained. Then, energy dispersive spectrometer (EDS) and Raman spectroscopy were employed to characterize the coverage of the Ta2C. EDS was utilized to demonstrate favorable deposition of Au and ideal growth of Ta2C in terms of elemental content. The energy dispersive spectrum of figure 3(e) determines the simultaneous presence of Au and Ta elements. Besides, the Raman spectrum in figure 3(f) exhibits representative characteristic peaks at around 237, 651,853,1342, and 1577 cm−1. The peak located at 237 cm−1 can be attributed to the in-plane and out-of-plane vibrations of Ta atoms in the outer layer as well as C and surface groups. The other peaks are attributed to C vibrations. The uniform presence of Ta2C is demonstrated by the Raman mapping image of the 1577 cm−1 peak [45, 46]. These ideal structures guarantee the enhancement of the sensor performance, as analyzed below.

Figure 3. (a) TEM image of Au/Ta2C. (b) HRTEM image of Au/Ta2C and SAED image of Ta2C. (c) AFM mapping and height profile of Ta2C nanosheet. (d) XPS spectrum of Ta2C in Ta 4f region. (e) EDS spectrum of Au/Ta2C. The inset shows the content of each element. (f) Raman spectrum of Ta2C and mapping image of 1577 cm−1 signal peak in a 20 × 20 μm2 area.
Download figure:
Standard image High-resolution image3.3. Plasmonic enhancement mechanism of Au/Ta2C structure
The enhancement mechanism of Ta2C was analyzed by the energy band theory. Figure 4(a) illustrates the charge exchange and energy levels in the sensor. The introduction of Ta2C leads to the blocking of the interband transition, manifesting as a decrease in the energy required for electron transfer at the Fermi energy level. Thus, the free electrons were more easily transferred from the Fermi energy level of Au to the hole in the affinity energy level of the Ta2C when a specific wavelength incidence excited the surface plasmon of Au. Subsequently, the relaxation instant electrons returned to the holes of Au. This process was accompanied by excited radiation, which enlarged the real part of the effective RI and amplified the polarizability response of the system [47]. The energy band map of the 5-layer stacked Ta2C bulk phase was calculated by Vienna Ab-initio Simulation Package (VASP). Figure 4(b) exhibits the high symmetry points in the Brillouin zone of the Ta2C film. The multiple intersections at the Fermi energy level of the plot under this path (Γ-M-K-Γ-A-L-H-A) corroborated the metallicity of Ta2C. Conventional 2D materials represented by graphene are semi-metallic in nature and have a low carrier concentration. Relative to other 2D materials, Ta2C implied stronger carrier migration efficiency, wider plasmonic frequency, and high electric field confinement properties, and enhanced sensing capability [31, 48]. Afterward, the magnitude of the electric field enhancement of the structure was simulated in response to the SPR intensity. Figures 4(c), (d) demonstrates the electric field intensity distribution of the Au-coated and Au/Ta2C-coated TFBG. The symmetrical stripe-like pattern produced in the fiber axial direction indicated the propagation of the SP wave. The Au/Ta2C sensor possessed an enhanced electric field intensity and distribution range, verifying the SPR enhancement effect [49]. Additionally, the plasmonic absorption resonance spectra (figures 4(e), (f)) of Au and Au/Ta2C systems were simulated to evaluate the RI sensing capability. The Au sensor exhibited a wide absorption peak at 1544 nm. The wavelength was redshifted by 0.84 nm as the RI changed from 1.3360 to 1.3365. The sensitivity was calculated to be 168 nm/RIU. The absorption spectrum of the Au/Ta2C sensor was shifted by about 0.6 nm relative to the Au sensor. However, Ta2C contributed to an enhancement of the resonance peak intensity, as well as a narrow signal peak, which corresponded to an enhancement of the FOM. Furthermore, the resonance peak redshift and sensitivity for the same RI change interval were 0.95 nm and 190 nm/RIU, respectively. Theoretically, Ta2C provides an improvement in RI sensing capability.
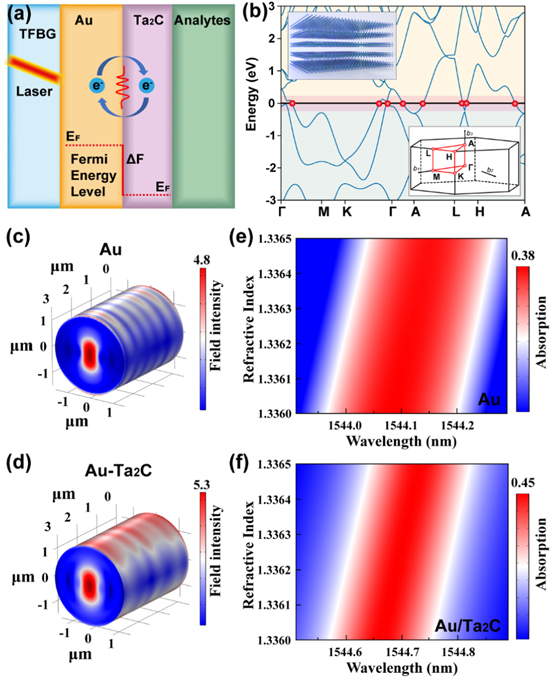
Figure 4. (a) Enhancement mechanism of Ta2C in TFBG/Au/Ta2C sensors. (b) Energy band structure of Ta2C. The insets show the schematic structure and the form of momentum space of Ta2C. (c), (d) The intensity and distribution of electric field enhancement of Au-coated and Au/Ta2C-coated TFBG. (e), (f) The absorption response of the TFBG/Au sensor and FBG/Au/Ta2C sensor to the change of external RI from 1.3360 to 1.3365.
Download figure:
Standard image High-resolution image3.4. Measurement of RI detection capabilities
Melamine, a carcinogenic substance, was once illegally added to dairy products because of its extremely high nitrogen content. Besides, analytes were formulated with different melamine concentrations in milk. Thus, melamine was selected as the molecule for the comprehensive analysis of the RI sensing performance. The optical path shown in figure 5(a) was used for the actual detection. The broad spectrum generated by the broadband light source (BBS) was transformed into polarized light by a polarizer and polarization controller (PC). The sensing region of the fiber was subsequently encapsulated by a sensing cell for sensing in liquid environments. The signal was finally collected by an optical spectrum analyzer (OSA). The operation process of the sensing area is illustrated in figure 5(b). The Raman spectra of the melamine in milk and water are provided in figure 5(c). The most significant peaks involve the in-plane deformation of the triazine ring. It shifted from 674 cm−1 to 700 cm−1 due to the change in the solution environment, which is consistent with previous studies [50]. Figure 5(d) exhibits the spectra of melamine with concentrations from 10−2 to 10−11 M. The decrease in melamine concentration led to a change in RI. Hence, the wavelength and amplitude of the resonance peak decreased in the spectra. However, the change in RI due to the decrease in the concentration of melamine to 10−9 M was minimal. This phenomenon made the spectral changes indistinguishable, indicating that the limit resolution of the sensor was approached. For such a small refractive index variation (less than 10−5 RIU), interrogating the amplitude is an effective sensing approach. Figure 5(e) specifies the variation with concentration on the amplitude. There is a favorable linear response between the amplitude and the concentration of the analyte. As suggested in the standard curve, the sensor possesses excellent linearity over the 10−3 to 10−8 M concentration range with an R2 value of 0.990. The limit of detection (LOD) can be calculated by the equation LOD = 3 SD/S−1, where SD represents the standard deviation of the response and S refers to the slope of the calibration curve. The SD of the response at 10−8 M is 0.0281, thus the LOD was calculated to be 7.9 × 10⁻⁹ M, which was in accordance with the internationally established of 1.5 × 10⁻⁴ M.

Figure 5. (a) Schematic illustration of the detection optical path. (b) Schematic diagram of the molecular detection of the sensing area. (c) Raman spectra of melamine in water and milk. (d) Sensing spectra of melamine in milk at different concentrations. (e) The calibration curve of resonance peak amplitude versus concentration.
Download figure:
Standard image High-resolution image
4. Conclusion
In this study, a TFBG/Au/Ta2C sensor was developed with the advantages of the high resolution of TFBG, high SPR sensitivity of Au, and bioaffinity of Ta2C. A large area of few-layer Ta2C was obtained using a photo-deposition method. Subsequently, the detection performance of the sensor was tested using ethanol solution with different RIs. The results implied an improvement in sensitivity relative to the TFBG/Au sensor. Then, VASP and FEM were employed to analyze the enhancement mechanism of Ta2C. Firstly, the homogeneous wrapping of the Ta2C enlarged the surface area of the sensor and extended the interaction range with the analyte. Secondly, the metallic nature of the Ta2C enhanced the plasmonic behavior of the sensor and advanced the highly confined electric field. Thirdly, the stronger absorption characteristics of Ta2C optimized the SPR response. Therefore, the sensor exhibited excellent quantitative detection of melamine in milk with a LOD of 7.9 × 10⁻⁹ M.
Acknowledgments
This work was supported by the National Natural Science Foundation of China (NSFC) (Grant Nos. 12074226, 11674199, 62073193).
Data availability statement
The data that support the findings of this study are available upon reasonable request from the authors.
Notes
The authors declare no competing financial interest.