

Abstract
In this work, the efficient extraction of uranium in solution using Al2O3–SiO2-T was reported. Kinetics and isotherm models indicated that the removal process of uranium on Al2O3–SiO2-T accorded with pseudo-second-order kinetic model and Langmuir isotherm model, which showed that the adsorption process was a uniform mono-layer chemical behavior. The maximum adsorption capacity of Al2O3–SiO2-T reached 738.7 mg g−1, which was higher than AlNaO6Si2 (349.8 mg g−1) and Al2O3–SiO2-NT (453.1 mg g−1), indicating that the addition of template could effectively improve the adsorption performance of Al2O3–SiO2 to uranium. Even after five cycles of adsorption–desorption, the removal percentage of uranium on Al2O3–SiO2-T remained 96%. Besides, the extraction efficiency of uranium on Al2O3–SiO2-T was 72.5% in simulated seawater, which suggested that the Al2O3–SiO2-T was expected to be used for uranium extraction from seawater. Further, the interaction mechanism between Al2O3–SiO2-T and uranium species was studied. The results showed that the electrostatic interaction and complexation played key roles in the adsorption process of Al2O3–SiO2-T to uranium.
Export citation and abstract BibTeX RIS
1. Introduction
With the shortage of energy sources and the reinforcement of green protection awareness, nuclear energy is considered as an effective strategy to solve the energy problem [1–3]. Uranium (U(VI)), one of the most important nuclear energy sources, is widely used in nuclear industry. In the past few decades, the usage of U(VI) had increased significantly, which ineluctably led to the wanton emission of radioactive metal into the water environment [4–6]. Eventually, the accumulation of U(VI) species in the food chain would cause a significant danger to human health due to its persistence and non-biodegradability [7, 8]. Therefore, the efficient removal or extract of U(VI) is important for satisfying the demand of energy security and decreasing environmental pollution [9–11].
Currently, some methods for removing U(VI) from wastewater have been investigated, such as flotation [12], biological/electrochemical reduction [13, 14], chemical precipitation [15] and adsorption techniques [16, 17]. In these methods, adsorption is regarded as the most convenient and effective method to remove U(VI) species from solution due to its convenient operation, high efficiency, cost effectiveness and possible large-scale applications [18–21]. It is great significance to seek a new adsorbent with strong environmental adaptability and high removal efficiency. Recently, a series of adsorbents including carbon materials [22–24], polymers [25], silicon dioxide [26] and metal oxides [27] have been researched to remove U(VI) from water. For instance, Wang et al [28] prepared a zero-valent iron/activated carbon to remove U(VI) from solution, which possessed a high adsorption capacity (196.1 mg g−1) and an excellent reusability. Deng et al [29] prepared a polyacrylonitrile fiber by microwave-assisted method and the maximum adsorption capacity was 241.4 mg g−1. Huynh et al reported an amino-functionalized silica packed column, which could be used as a prospective adsorbent to track and capture U(VI) in aqueous solution [30]. A facile strategy for preparing the aluminium oxide microsphere was reported by Huang et al [31], which was applied to immobilize radionuclides from wastewater. Among these adsorbents, metal oxides played an important role in removing U(VI) due to their stable mechanical structure and reusability [32]. Especially, porous Al2O3 was widely applied in adsorption due to the unique advantages of easy availability of raw materials, large specific surface area and abundant active sites on the surface. For instance, Ben et al [33] prepared the porous Al2O3 nanofibers by electrospinning process, which possessed high capacities for U(VI) from wastewater. Mei et al [34] researched the effect of water-soluble silicate on the adsorption of U (VI) by γ-Al2O3. The results indicated that the existence of silicate could promote the adsorption behavior of γ-Al2O3 to U(VI) and the adsorption behavior was inner-sphere surface complexation. In other word, SiO2 particles could be used as a bridge between U(VI) and Al2O3 to improve the adsorption performance of Al2O3 materials. In addition, the porosity was an important factor to affect the adsorption behavior of Al2O3 materials. It had been proved that the adsorption performance of the porous γ-Al2O3 was much better than that of the dense α-Al2O3. Therefore, it was necessary to develop a novel porous Al2O3–SiO2 nanocomposite material. Currently, some porous materials were fabricated by solution-freeze-drying-calcination method, which could effectively control over the pore shapes, pore arrangements and pore size distribution [35].
It was reported that xanthan gum was a polysaccharide consisting of a cellulosic backbone with two mannose and one glucuronic acid side chains on every second glucose residue, which was considered as a good template material to prepare metal oxide with excellent adsorption ability [36, 37]. Therefore, in this work, the novel porous Al2O3–SiO2 nanocomposite (Al2O3–SiO2-T) was obtained by using sodium aluminosilicate as silicon source and aluminum source and xanthan gum as template via solution-freeze-drying-calcination method. Furthermore, the adsorption properties of Al2O3–SiO2-T to U(VI) were investigated under controlled conditions. The results indicated that Al2O3–SiO2-T might be expected as a competitive candidate material for the extraction of U(VI) from water.
2. Experimental section
2.1. Reagents and chemicals
Xanthan gum, hydrochloric acid, sodium hydroxide, sodium aluminium silicate (AlNaO6Si2, 98%), uranium nitrate (UO2(NO3)2 · 6H2O, 98%) and arsenazo III (C22H18As2N4O14S2, 99.9%) were gained from Shanghai Reagent (Shanghai, China).
2.2. Preparation of Al2O3–SiO2-NT and Al2O3–SiO2-T
AlNaO6Si2 was calcined in air for 300 min at 650 °C with a heating rate of 10 °C min−1 to obtain Al2O3–SiO2 nanocomposite without using template, which was called Al2O3–SiO2-NT. The novel porous Al2O3–SiO2 nanocomposite (Al2O3–SiO2-T) was obtained using xanthan gum as the template and AlNaO6Si2 as the precursor material via solution-freeze-drying-calcination process. The process was as follows: 0.5 g of AlNaO6Si2 and 1.5 g of xanthan gum were put into 0.1 l of distilled water with stirring at 25 °C for 48 h to gain a uniform and transparent mixture. The mixture was transferred into molds and freeze-dried at −55 °C for 48 h to obtain the composite material (AlNaO6Si2-XG). At last, Al2O3–SiO2-T was obtained by calcining AlNaO6Si2-XG at 650 °C in air for 300 min with a heating rate of 10 °C min−1.
2.3. Characterization
X-ray photoelectron spectroscopy (XPS, K-ALPHA+) and Fourier transform infrared spectroscopy (FT-IR, mIRage) were used for the structural characterization of AlNaO6Si2, AlNaO6Si2-XG, Al2O3–SiO2-NT and Al2O3–SiO2-T. X-ray diffraction (XRD, X Pert pro) was carried out to confirm the crystal structures of AlNaO6Si2, AlNaO6Si2-XG, Al2O3–SiO2-NT and Al2O3–SiO2-T. Thermogravimetric analyzer (TG, STA 449 F5) was applied to study the stability of AlNaO6Si2, AlNaO6Si2-XG, Al2O3–SiO2-NT and Al2O3–SiO2-T under air atmosphere. The microstructures of AlNaO6Si2, AlNaO6Si2-XG, Al2O3–SiO2-NT and Al2O3–SiO2-T were observed using scanning electron microscope (SEM, Aztec X-Max20). Transmission electron microscopy (TEM, RES101) was used to determine the particle size of Al2O3–SiO2-T. The UV–vis-NIR diffuse reflectance spectra of AlNaO6Si2, Al2O3–SiO2-NT and Al2O3–SiO2-T were recorded using a spectrophotometer. (DRS, Avantes AvaSpec 3648). The specific surface area of Al2O3–SiO2-T before and after the adsorption of uranium were characterized by N2 adsorption–desorption analyser (AR-JW-BK112) and the corresponding data analysis was estimated by using Brunauer–Emmett–Teller (BET) model.
2.4. Uranium adsorption in aqueous solution
UV–vis spectrophotometer was used to determine the concentration of U(VI) in U(VI)-containing solutions. In adsorption experiments, about 1 mg of adsorbent (AlNaO6Si2, Al2O3–SiO2-NT and Al2O3–SiO2-T) was added into U(VI)-containing solutions (10 ml) with a desired concentration. To study the effect of pH values on adsorption behavior, the adsorption experiments were tested at different pH from 3 to 11. To research the effect of different coexisting anions and cations on U(VI) adsorption, some coexisting ions were selected for the experiment. The adsorption isotherms and adsorption capacities were investigated at various U(VI) concentrations (5, 10, 20, 40, 60, 80 and 100 mg l−1). The adsorption kinetics was investigated at contact times in the range of 5 ∼ 1440 min. To estimate the cycle performance of Al2O3–SiO2-T, the experiments were tested at pH = 5 with a U(VI)-containing solution of 10 mg l−1. Further, the adsorption performance of Al2O3–SiO2-T to U(VI) in simulated seawater was evaluated with different dosage of Al2O3–SiO2-T. The detailed calculation equations were described in equations (S1) and (S2).
3. Results and discussion
3.1. Characterization
3.1.1. FT-IR
The FT-IR spectra of AlNaO6Si2, Al2O3–SiO2-NT, AlNaO6Si2-XG and Al2O3–SiO2-T were shown in figure 1(a). The peaks at about 1635 cm−1 and 3440 cm−1 belonged to bending vibration and stretching vibration of −OH, respectively [33], which indicated that abundant −OH groups were formed on the surface of AlNaO6Si2, AlNaO6Si2-XG, Al2O3–SiO2-T and Al2O3–SiO2-NT. The peak at 1078 cm−1 was owed to the Si–O stretching vibration, which indicated Al2O3–SiO2-T, Al2O3–SiO2-NT, AlNaO6Si2-XG and AlNaO6Si2 were rich in Si–O bond [37]. For AlNaO6Si2-XG, the peak at 1052 cm−1 was ascribed to the C–O stretching vibration in the molecular chain of xanthan gum [38]. The peaks at 2971 and 2925 cm−1 were attributed to the stretching vibration of C–H, which belonged to methylene in xanthan gum [39]. After calcination, the peaks at 2971, 2925 and 1052 cm−1 vanished, indicating that the xanthan gum was completely decomposed after calcining at 650 °C. Meanwhile, a new peak was observed at about 788 cm−1 in the FT-IR spectra of Al2O3–SiO2-T and Al2O3–SiO2-NT, which was attributed to the Al–O tensile vibration in Al2O3–SiO2-NT and Al2O3–SiO2-T [40]. All of these results showed that the Al3+ in AlNaO6Si2-XG was transformed into Al2O3 particles and xanthan gum was completely removed after heat treatment.
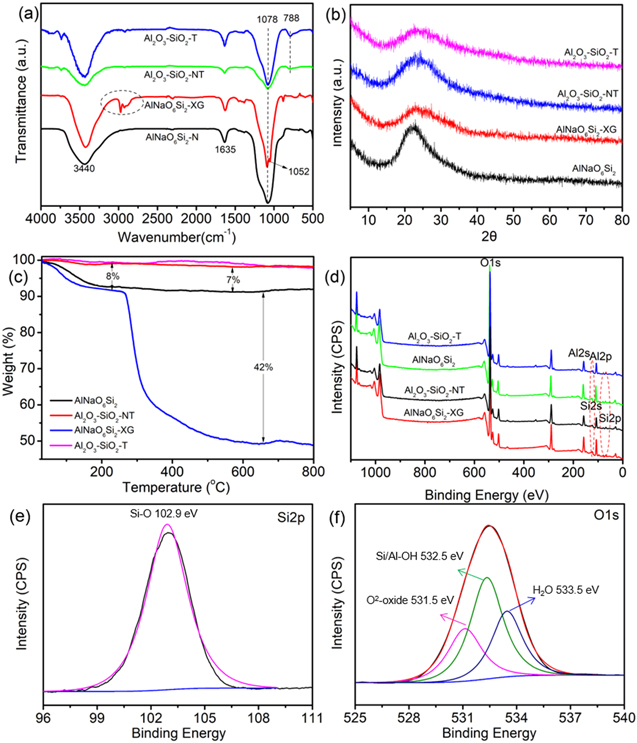
Figure 1. (a) FT-IR spectra, (b) XRD patterns, (c) TG curves and (d) XPS spectra of AlNaO6Si2, AlNaO6Si2-XG, Al2O3–SiO2-NT and Al2O3–SiO2-T. High-resolution of (e) Si2p and (f) O1s in Al2O3–SiO2-T.
Download figure:
Standard image High-resolution image3.1.2. XRD
Figure 1(b) displayed the XRD patterns of AlNaO6Si2, Al2O3–SiO2-NT, AlNaO6Si2-XG and Al2O3–SiO2-T. For AlNaO6Si2-XG and AlNaO6Si2, a broad band at 23° could be clearly observed, which was ascribed to the typical amorphous structure of sodium aluminosilicate. For Al2O3–SiO2-T and Al2O3–SiO2-NT, a broad peak appeared at 24°, corresponding to the typical amorphous SiO2 [41], which implied that Al2O3–SiO2-NT and Al2O3–SiO2-T maintained the amorphous structure of sodium aluminosilicate after calcination. Meanwhile, the presence of SiO2 limited the crystal transformation of Al2O3 particles from γ-Al2O3 to θ-Al2O3. It was reported that γ-Al2O3 would partially dissociate into AlO–OH, which was beneficial to capture the heavy metal ions in the solution. Therefore, it could be inferred that Al2O3–SiO2-T would be a potential material for U(VI) removal from solution.
3.1.3. TG
Thermogravimetric analysis (TG) was applied to analyze the thermal stability of AlNaO6Si2, Al2O3–SiO2-NT, AlNaO6Si2-XG and Al2O3–SiO2-T from 30 °C to 800 °C, as shown in figure 1(c). In terms of the degree of weight loss, the curve of AlNaO6Si2-XG could be probably divided into two stages. The first stage exhibited the mass of AlNaO6Si2-XG was reduced by 8% due to the loss of moisture when temperature was below 200 °C. During the second stage, the mass of AlNaO6Si2-XG decreased by 42%, which was owed to the decomposition of xanthan gum at 300 °C to 800 °C. For the curve of AlNaO6Si2, the weight loss was 7% below 200 °C and almost no weight loss was observed at 300 to 800 °C. It was worth noting that Al2O3–SiO2-T and Al2O3–SiO2-NT had almost no weight loss, which indicated that the xanthan gum of Al2O3–SiO2-T was completely removed during the calcination process.
3.1.4. XPS
The chemical composition of AlNaO6Si2, Al2O3–SiO2-NT, AlNaO6Si2-XG and Al2O3–SiO2-T were studied by XPS. As showed in figure 1(d), the peaks of O1s, Si2s, Si2p, Al2s and Al2p were obviously observed, which indicated that the four samples were rich in Al, Si and O elements. In order to further analyze the group composition of Al2O3–SiO2-T, the high-resolution XPS spectra of Al2p, Si2p and O1s were deconvolved. As shown in figure S1 (available online at stacks.iop.org/NANO/33/095705/mmedia), the peaks of Al2p located at the binding energy of 74.5 eV, which were assigned to Al–O bonds in γ-Al2O3, indicating that Al2O3–SiO2-T was rich in γ-Al2O3 after calcination. For Si2p (figure 1(e)), Si–O bonds were created at 103.0 eV, corresponding to Si–O–Si/Si–O–Al in Al2O3–SiO2-T. These results showed that SiO3 2− and Al3+ were converted to SiO2 and Al2O3 after calcination, respectively. The O1s of Al2O3–SiO2-T was deconvoluted into three peaks around at 531.5, 532.5 and 533.5 eV (figure 1(f)), which were attributed to the O2− oxides, hydroxyl oxygen and bound water, respectively [42]. The result further proved that there were abundant −OH on the surface of Al2O3–SiO2-T and Si–O/Al–O bonds were formed in Al2O3–SiO2-T, which was in good agreement with FT-IR.
3.1.5. DRS
Figure S2 showed the diffuse reflectance spectra of AlNaO6Si2, Al2O3–SiO2-NT and Al2O3–SiO2-T. It was found that the samples possessed a high reflectance in the visible region of the spectrum. Moreover, the optical band gap of the samples was calculated using the Tauc equation (equation (S1) and (S2)). The results showed that the band gap of AlNaO6Si2, Al2O3–SiO2-NT and Al2O3–SiO2-T were 3.35, 3.62 and 3.82 eV, respectively, which indicated that the particle size of Al2O3–SiO2-T was relatively small comparing with Al2O3–SiO2-NT [43, 44], resulting in the exposure of many active sites. In other words, Al2O3–SiO2 material prepared by template method might have an excellent adsorption property.
3.1.6. SEM and TEM
Figure 2 showed the SEM images of AlNaO6Si2, Al2O3–SiO2-NT, AlNaO6Si2-XG and Al2O3–SiO2-T. For AlNaO6Si2 (figure 2(a)), the typical porous structure of AlNaO6Si2 was clearly observed. After calcination, it was found that Al2O3–SiO2-NT possessed poor porous structure due to the agglomeration of Al2O3 and SiO2 nanoparticles (figure 2(b)) after high temperature treatment. As shown in figure 2(c), it was obviously observed that AlNaO6Si2-XG had a typical layered structure of xanthan gum, which might be attributed to the fact that the AlNaO6Si2 particles only attached to the surface of xanthan gum and it did not destroy the initial structure and chemical construction of xanthan gum. As shown in figure 2(d), the layered structure of AlNaO6Si2-XG completely disappeared after calcining at 650 °C, which was attributed to the complete removal of xanthan gum during calcination. Meanwhile, it was found that the interconnected porous structures were formed in Al2O3–SiO2-T due to the release of gas during the heat treatment process. Besides, SiO3 2− and Al3+ were slowly transformed into SiO2 and Al2O3 particles, which grew along the molecular chain of xanthan gum and gradually formed a fluffy and uniform porous structure, causing that a large number of active sites on the surface of Al2O3–SiO2-T might be exposed for capturing the heavy metal ions in solution. In other word, Al2O3–SiO2-T maintained the typical porous structure of AlNaO6Si2 and formed big cavities with the growth of Al2O3 and SiO2 particles [45], which could be responsible for the adsorption of the metal ions. Figures 2(e) and (f) showed the TEM images of Al2O3–SiO2-T to determine its particle size. It was found that SiO3 2− and Al3+ were transformed into SiO2 and Al2O3 particles with uniform particle size of 20 nm, further proving that the prepared Al2O3–SiO2-T were in nano sized.

Figure 2. SEM images of (a) AlNaO6Si2, (b) Al2O3–SiO2-NT, (c) AlNaO6Si2-XG and (d) Al2O3–SiO2-T. TEM images of ((e) and (f)) Al2O3–SiO2-T.
Download figure:
Standard image High-resolution image3.2. U(VI) adsorption studies
3.2.1. Effect of pH
The concentration of H+ in solution has an important effect both on the surface charge of adsorbent and the existence forms of U(VI) species. Figure 3(b) presented the adsorption efficiency of U(VI) on AlNaO6Si2, Al2O3–SiO2-NT and Al2O3–SiO2-T at pH 3.0 ∼ 9.0. The removal efficiency of AlNaO6Si2 and Al2O3–SiO2-NT increased to 46.3% and 59.2% as the pH increased in the range from 3.0 to 5.0, respectively, while the increment tendency of the removal efficiency of Al2O3–SiO2-T was observed from 5.4% to 98.0% at pH 3.0 ∼ 5.0. When the pH value was in the range from 6.0 to 11.0, the removal efficiency of AlNaO6Si2, Al2O3–SiO2-NT and Al2O3–SiO2-T reduced to 10.0%, 14.4% and 12.1%, respectively. It was reported that the existing forms of U(VI) and the change of surface charge of adsorbent would affect the adsorption behavior of adsorbent for U(VI) at different pH [46, 47]. As shown in figure 3(a), the pH at zero-point charge (pHzpc) of AlNaO6Si2, Al2O3–SiO2-NT and Al2O3–SiO2-T were 7.3, 7.4 and 8.2, respectively, which were consistent with the results of zeta potential measurements (figure S3). At pH < pHzpc, the surface of adsorbent was negatively charged and it was positively charged at pH > pHzpc [48, 49]. Besides, the predominant species were UO2 2+ and (UO2)3(OH)5+ at pH 2.0 ∼ 7.0, while the major U(VI) species in the solution became UO2(OH)3 2− and (UO2)3(OH)7− at pH > 7 (figure 3(c)). At pH < 5, the removal efficiency of U(VI) on AlNaO6Si2, Al2O3–SiO2-NT and Al2O3–SiO2-T increased due to the increase of adsorption affinity, which was caused by the strong electrostatic interaction between U(VI) species and adsorbent. As pH > 5, the removal efficiency decreased owing to the reduction of response of adsorbent to U(VI) species. It was interesting to notice that the removal efficiency of Al2O3–SiO2-T (98.0%) was obviously higher than that of Al2O3–SiO2-NT (59.2%) due to the existence of porous structure in the Al2O3–SiO2-T, which could provide enough active sites and effective adsorption space.
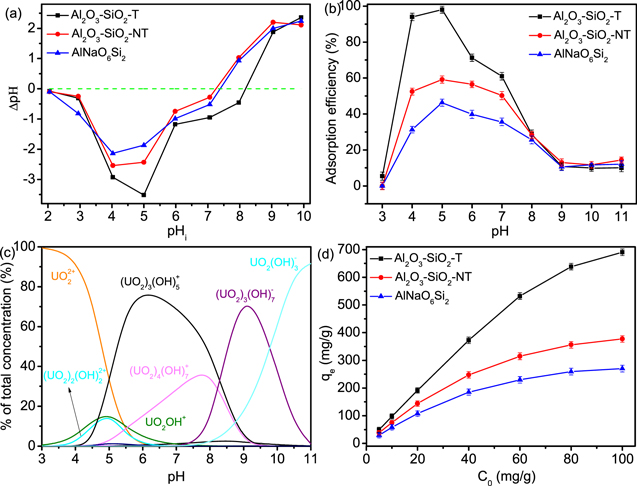
Figure 3. (a) Zeta potential analysis of AlNaO6Si2, Al2O3–SiO2-NT and Al2O3–SiO2-T (T = 298 K, m/V = 0.1 g l−1, CNaCl = 0.1 mol l−1 and t = 24 h), (b) effect of pH on the adsorption of uranium(VI) by AlNaO6Si2, Al2O3–SiO2-NT and Al2O3–SiO2-T (C0 = 10 mg l−1, m/V = 0.1 g l−1, t = 12 h and T = 298 K), (c) the existence of uranium(VI) species in the pH range of 3∼11 and (d) effect of C0 on adsorption capacity (m/V = 0.1 g l−1, t = 12 h, T = 298 K and pH = 5).
Download figure:
Standard image High-resolution image3.2.2. Isotherms
The adsorption efficiency and capacity of U(VI) on AlNaO6Si2, Al2O3–SiO2-NT and Al2O3–SiO2-T were strongly influenced by the initial concentration of U(VI) [50]. As shown in figure 3(d), the removal efficiency of U(VI) quickly decreased and the adsorption capacity significantly increased with the rising of C0. For instance, when C0 was 10 mg l−1, the adsorption capacity and efficiency of U(VI) on Al2O3–SiO2-T were 98 mg g−1 and 98%, respectively, while C0 was 100 mg l−1, the removal efficiency was 69% and the adsorption capacity reached 690 mg g−1. Specifically, at low initial U(VI) concentrations, there were many unoccupied and available active sites on the surface of Al2O3–SiO2-T, which led to the higher adsorption efficiency of Al2O3–SiO2-T. The increase of C0 would promote the increase of the driving force of mass transfer at the solid-liquid interface, which led to the increase of the adsorption capacity of U(VI) on Al2O3–SiO2-T [51]. To predict the maximum adsorption capacity, the adsorption isotherms were used to describe the adsorption behavior of AlNaO6Si2, Al2O3–SiO2-NT and Al2O3–SiO2-T to U(VI), including Langmuir, Freundlich and Sips isotherm models [52, 53]. As shown in figures 4, S4 and table 1, the R2 (0.999) of Langmuir model was superior than that of Sips (0.997) and Freundlich (0.963) models, which suggested that the adsorption of U(VI) on AlNaO6Si2, Al2O3–SiO2-NT and Al2O3–SiO2-T was more consistent with the Langmuir model, indicating that the adsorption behavior of AlNaO6Si2, Al2O3–SiO2-NT and Al2O3–SiO2-T to U(VI) was the single molecular level [54, 55]. It was interesting to note that the maximum adsorption capacity of Al2O3–SiO2-T reached 738.7 mg g−1, which was much higher than most of the reported metal oxide materials (table S1). The result proved that Al2O3–SiO2-T could be used as a promising material for the treatment of U(VI).
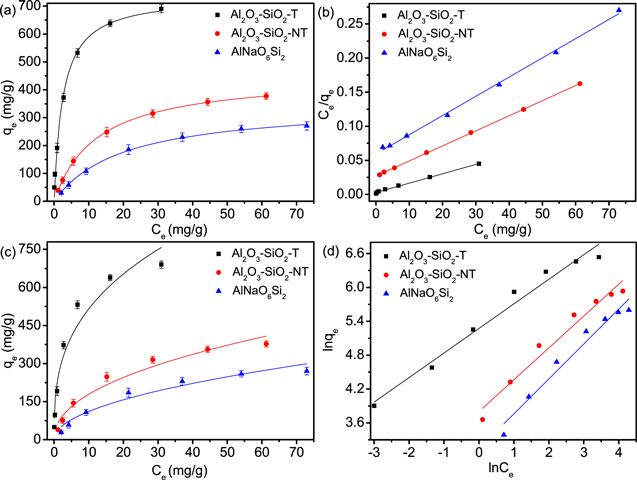
Figure 4. Adsorption isotherms of AlNaO6Si2, Al2O3–SiO2-NT and Al2O3–SiO2-T to U(VI) fitted by (a) nonlinear Langmuir model, (b) linear Langmuir model, (c) nonlinear Freundlich model and (d) linear Freundlich model (T = 298 K, pH = 5.0, m/V = 0.1 g l−1 and t = 12 h).
Download figure:
Standard image High-resolution imageTable 1. Isotherm parameters of uranium adsorption on AlNaO6Si2, Al2O3–SiO2-NT and Al2O3–SiO2-T.
| Adsorbents | Langmuir | Freundlich | ||||
|---|---|---|---|---|---|---|
| KL (l mg−1) | qm (mg g−1) | R2 | nF | KF ((mg g−1)(l mg−1)) | R2 | |
| Al2O3–SiO2-T | 0.3963 | 738.7 | 0.993 | 2.932 | 235.04 | 0.951 |
| Al2O3–SiO2-NT | 0.0812 | 453.1 | 0.999 | 2.196 | 62.66 | 0.963 |
| AlNaO6Si2 | 0.0504 | 349.8 | 0.998 | 2.009 | 35.36 | 0.956 |
3.2.3. Kinetics
The removal kinetics of U(VI) on AlNaO6Si2, Al2O3–SiO2-NT and Al2O3–SiO2-T were investigated. As displayed in figure 5, the adsorption efficiency of U(VI) on Al2O3–SiO2-T increased rapidly and achieved equilibrium within a contact time of 200 min, which displayed a rapid adsorption process of Al2O3–SiO2-T to U(VI). Further, the pseudo-first-order (PFO), pseudo-second-order (PSO), intraparticle diffusion model and Elovich model were used to simulate the adsorption process of U(VI). The PSO and PFO models were usually used to describe the chemisorption process and physisorption behavior between adsorbate and adsorbent, respectively [56, 57]. The intraparticle diffusion model often considered that diffusion direction of molecules was random and the internal diffusion was a adsorption rate-determining step [56]. The Elovich kinetic model assumed that the rate-determining step was the diffusion of the adsorbate [58]. The fitting curves of kinetic models were depicted in figures 5 and S5 and the kinetic parameters were summarized in table 2. Compared with PFO (R2 = 0.941), Elovich models (R2 = 0.902) and intraparticle diffusion (R2 = 0.936), the R2 of PSO model was closer to 1 (R2 = 0.993). These results proved that the removal process of Al2O3–SiO2-T to U(VI) could be exactly described by PSO model, which showed that the covalent forces through electron sharing between U(VI) species and active sites on the surface of Al2O3–SiO2-T was was the driving force in the adsorption process and the removal process was mainly controlled by chemisorption behavior [59].
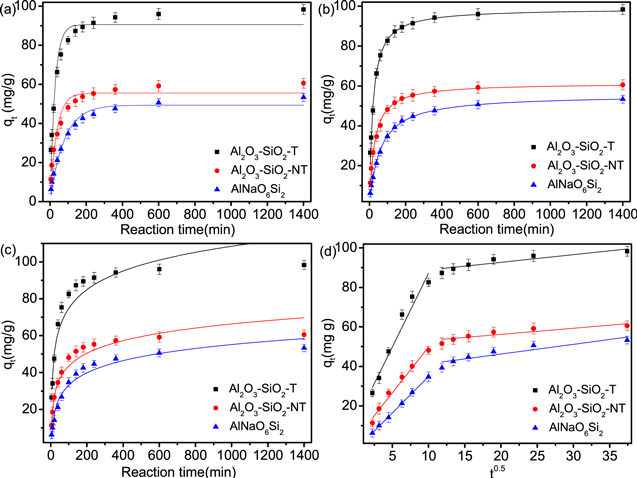
Figure 5. Adsorption kinetics models of AlNaO6Si2, Al2O3–SiO2-NT and Al2O3–SiO2-T to U(VI) fitted by (a) pseudo-first-order model, (b) pseudo-second-order model, (c) Elovich model and (d) intraparticle diffusion model. (C0 = 10 mg l−1, m/V = 0.1 g l−1, pH = 5.0 and T = 298 K).
Download figure:
Standard image High-resolution imageTable 2. Kinetic parameters of U(VI) adsorption on AlNaO6Si2, Al2O3–SiO2-NT and Al2O3–SiO2-T.
| Adsorbents | Pseudo-first-order model | Pseudo-second-order model | ||||
|---|---|---|---|---|---|---|
| k1 (l mg−1) | qe (mg g−1) | R2 | k2 (g min−1 mg−1) | qe (mg g−1) | R2 | |
| Al2O3–SiO2-T | 0.0381 | 90.56 | 0.941 | 0.00533 | 98.87 | 0.993 |
| Al2O3–SiO2-NT | 0.0274 | 55.54 | 0.950 | 0.00595 | 61.43 | 0.994 |
| AlNaO6Si2 | 0.0129 | 49.35 | 0.974 | 0.00303 | 55.61 | 0.996 |
3.2.4. The effect of coexisting ions
The coexisting ions, including Na+, Mg2+, K+, Ca2+, CO3 2−, PO4 3− SO4 2−, ClO4 − and NO3 −, were widespread in the water [60, 61]. These coexisting ions could influence the migration and existence form of U(VI), which was attributed to the different affinity of cations for forming complexes/precipitates between anions and U(VI) species [62]. Figures 6(a) and (b) showed the removal percentage of U(VI) on AlNaO6Si2, Al2O3–SiO2-NT and Al2O3–SiO2-T in different cation/anions-containing solutions. It was found that Na+, K+, Ca2+ and Mg2+ would negligible effect on the adsorption performance of adsorbent to U(VI). For the coexisting anions, the SO4 2−, ClO4 − and NO3 − had little effect on the adsorption of U(VI), while the CO3 2− and PO4 2− significantly decreased the adsorption percentage of U(VI) on adsorbents, which was ascribed to the formation of UO2(CO3)3 4−, UO2(CO3)2 2− and UO2(PO4 −)n 2−3n species [63]. These results indicated that the adsorption of U(VI) on Al2O3–SiO2-T was independent on most of ions, which proved that Al2O3–SiO2-T might be applied as a potential adsorbent for treating U(VI) in wastewater.
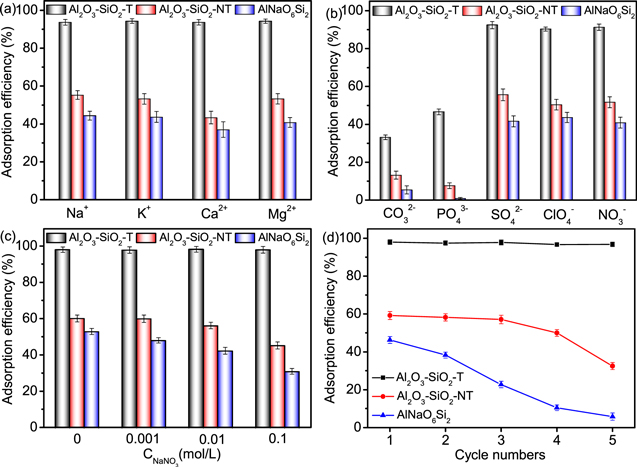
Figure 6. (a) Effect of cations on adsorption efficiency (C0 = 10 mg l−1, t = 12 h, T = 298 K, m/V = 0.1 g l−1, Ccation = 0.1 mol l−1 and pH = 5.0), (b) effect of anions on adsorption efficiency (C0 = 10 mg l−1, t = 12 h, T = 298 K, m/V = 0.1 g l−1, Canion = 0.1 mol l−1 and pH = 5.0), (c) effect of ionic strength on adsorption efficiency (C0 = 10 mg l−1, t = 12 h, T = 298 K, m/V = 0.1 g l−1, pH = 5.0 and CNaNO3 = 0, 0.001, 0.01 and 0.1 mol l−1) and (d) recycling of AlNaO6Si2, Al2O3–SiO2-NT and Al2O3–SiO2-T (Cinitial =10 mg l−1, t = 12 h, T = 298 K, m/V = 0.1 g l−1 and pH = 5.0).
Download figure:
Standard image High-resolution imageThe influence of ionic strength on U(VI) removal was important to the adsorbent for treating the actual wastewater [64]. In this work, NaNO3 was applied as a background electrolyte to study the influence of ionic strength on adsorption of AlNaO6Si2, Al2O3–SiO2-NT and Al2O3–SiO2-T to U(VI). As shown in figure 6(c), the adsorption efficiency of AlNaO6Si2, Al2O3–SiO2-NT and Al2O3–SiO2-T to U(VI) was no significant reduction and the adsorption efficiency of Al2O3–SiO2-T to U(VI) exceeded 90% with the increase of ionic strength (0, 0.001, 0.01 and 0.1 mol l−1). These results displayed that the removal of U(VI) on Al2O3–SiO2-T was independent on the ionic strength. It was well known that the outer-sphere complexes were more sensitive comparing with inner-sphere complexes in response to any change in the ionic strength [65]. These facts showed that the U(VI) adsorption process on Al2O3–SiO2-T was an inner-sphere complexation process.
3.2.5. Adsorption in simulated seawater
Enrichment of U(VI) from seawater using a suitable adsorbent was great for sustainable development and environmental safety. For further understanding the practical applicability of Al2O3–SiO2-T, the extraction of U(VI) in simulated seawater with different dose of Al2O3–SiO2-T was investigated. As shown in figure S6, the extraction efficiency of U(VI) on Al2O3–SiO2-T was 72.5% when the dose of adsorbent was 0.5 mg ml− 1. This result indicated that Al2O3–SiO2-T might be expected to be used as an effective adsorbent for extracting U(VI) from seawater.
3.2.6. Reusability and leaching studies
It was very important to investigate the adsorption recyclability of adsorbent for evaluating its practical applicability [66]. As shown in figure 6(d), the reusability of AlNaO6Si2, Al2O3–SiO2-NT and Al2O3–SiO2-T were investigated via performing five consecutive cycles. The results showed that the adsorption efficiency of AlNaO6Si2 and Al2O3–SiO2-NT decreased from 46.3% and 59.2% to 5.5% and 32.0% after five cycles, respectively, which was owed to the reduction or disappearance of the active site during the adsorption–desorption process. However, it was worth noting that the removal efficiency of U(VI) on Al2O3–SiO2-T remained 96% even after five cycles, which further signified its applicability to apply as a superior adsorbent for the removal of U(VI).
The elements in the adsorbent might leach into the solution during the adsorption process, which would cause the secondary pollution to the water system and reduce the usability of the adsorbent [67, 68]. Therefore, for studying the leaching behavior of Al3+ in Al2O3–SiO2-T, the solution after U(VI) removal were characterized by an inductively coupled plasma spectrometer. The results showed that there was no Al3+ in the solution, which showed that no Al3+ in Al2O3–SiO2-T leached into the solution during the sorption experiments, indicating that Al2O3–SiO2-T could be used for the remediation of practical wastewater and it would not cause secondary pollution to the environment.
3.3. Adsorption mechanism
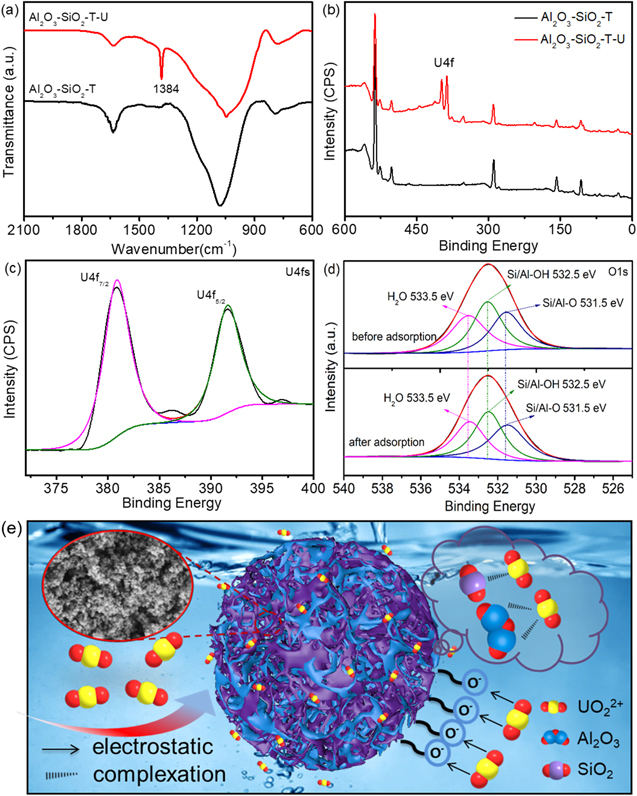
According to the adsorption isotherms and kinetics, it has been proven that the chemisorption on the single molecular level was the main mechanism for the adsorption of U(VI) on Al2O3–SiO2-T. The elemental mapping images of Al2O3–SiO2-T after U(VI) removal were shown in figure S7. Clearly, the U(VI) species were evenly distributed on the surface of Al2O3–SiO2-T, indicating that U(VI) species were captured by surface active sites to form the complexes, which might result in the decrease of specific surface area. The specific surface area of Al2O3–SiO2-T before and after adsorption was calculated by BET model (figure S8). It could be found that the specific surface area of Al2O3–SiO2-T had decreased from 321.2 to 193.6 m2 g−1 after adsorption, which was attributed to the formation of the complexes on Al2O3–SiO2-T. In order to further understand the interaction between U(VI) and Al2O3–SiO2-T, the FT-IR, XRD and XPS were used to study the surface chemical compositions on the surfaces of Al2O3–SiO2-T before and after U(VI) removal. As shown in figure 7(a), the peak at 1384 cm−1 was attributed to the stretching vibration of U-O-U, which demonstrated that U(VI) was successfully captured by the hydroxyl group on Al2O3–SiO2-T [69]. Figure S9 showed the XRD patterns of Al2O3–SiO2-T before and after U(VI) adsorption. The peak at 24° shifted slightly to the large peak position, which might indicate that the formation of stable complexes between Al2O3–SiO2-T and U(VI) species [70]. As shown in figures 7(b) and (c), a new and strong peak of U4f with the binding energies at about 390 eV was observed in XPS spectra, which showed that the U(VI) species were in the oxidation state (Eb > 382 eV), rather than the reduced state of U(IV) (Eb < 380 eV). The results indicated that no oxidation-reduction reaction was occurred to convert U(VI) to U(IV) during the removal process. As shown in figure 7(d), three peaks of O1s in Al2O3–SiO2-T located at about 532 eV were observed before and after adsorption, which were ascribed to H2O (533.5 eV), –O–H (532.5 eV) and Si/Al–O (531.5 eV) groups [71], respectively. These peaks almost had no shift after adsorption, further indicating that no oxidation-reduction reaction was occurred in the adsorption process. In addition, the content of the –O–H groups decreased from 42.36% to 36.82% after adsorption, which indicated that the −OH played an important role in the interaction process of U(VI) adsorption and the stable complexes were formed through complexation between U(VI) species and Al2O3–SiO2-T after adsorption [1].
Figure 7. (a) FT-IR spectra of Al2O3–SiO2-T before and after adsorption, (b) XPS spectra of Al2O3–SiO2-T before and after adsorption, (c) high-resolution XPS spectra of U4f after adsorption, (d) high-resolution XPS spectra of O1s before and after adsorption and (e) adsorption mechanism for U(VI) on Al2O3–SiO2-T.
Download figure:
Standard image High-resolution image
The adsorption mechanism of Al2O3–SiO2-T to U(VI) was described in figure 7(e). First, the surface of Al2O3–SiO2-T was negatively charged due to the presence of −OH groups at pH = 5, which would effectively capture UO2 2+ and (UO2)3(OH)5+ with positively charged in solution. Then, the −OH on the surface of Al2O3–SiO2-T in aqueous solution could coordinate with U(VI) species to form the complexes. Based on the above discussion, compared with Al2O3–SiO2-NT, Al2O3–SiO2-T exhibited much higher adsorption efficiency for U(VI), which was caused by the porous structure, providing enough loading sites for U(VI). These results evidenced that the −OH groups on the surface and the porous structure of Al2O3–SiO2-T played the crucial role in the U(VI) adsorption process.
4. Conclusion
Al2O3–SiO2-T was gained by solution-freeze-drying-calcination method to extract U(VI) from water. The adsorption capacity and efficiency of the Al2O3–SiO2-T to U(VI) was 738.7 mg g−1 and 98.0% at pH = 5. The adsorption behavior of Al2O3–SiO2-T to U(VI) was independent on most of ion species and the ionic strength had no effect on its adsorption behavior. After five cycles, the adsorption efficiency remained at 96%. It was worth noting that the removal efficiency of U(VI) on Al2O3–SiO2-T was 72.5% in simulated seawater. The results hinted that the adsorption capacity of U(VI) on Al2O3–SiO2-T could be improved, which might be related to the porous structure of the materials caused by the addition of template. The electrostatic interaction and surface complexation were the main adsorption mechanism for U(VI) on Al2O3–SiO2-T. In a word, Al2O3–SiO2-T was expected to be a highly efficient adsorbent for U(VI) removal.
Acknowledgments
We are grateful to China Academy of Engineering Physics. This work was financially supported by the National Natural Science Foundation of China (No. 21902130), Research Fund of SWUST for PhD (No.17zx7135), Sichuan's Training Program of Innovation and Entrepreneurship for Undergraduate (No. S202110619061 and S202110619086).
Data availability statement
All data that support the findings of this study are included within the article (and any supplementary files).
Conflicts of interest
The authors declare no conflict of interest.