

Abstract
In the past few years, lead chalcogenide quantum dots (QDs) have attracted attention as a new system with a strong quantum confinement effect. In this paper, the hot-excitons cooling and Auger recombination of multiexcitons in PbS QDs are investigated by the femtosecond time-resolved transient absorption spectroscopy. The results show that the excitons dynamics in PbS QDs are closely related to the pump-photon energy and pump-pulse energy. Multiexcitons generate when the excess energy of the absorbed photons is larger than the bandgap energy in PbS QDs. The hot-excitons cooling lifetime increases but the Auger recombination lifetime decreases as the pump-photon energy and the pump-pulse energy increase. Besides, there is a competitive relation between multiple-excitons generation and hot-excitons cooling. The dynamics results of the formation and relaxation of multiexcitons in PbS QDs would shed light on the further understanding of the interaction between excitons and photons in the optoelectronic application based on PbS QDs.
Export citation and abstract BibTeX RIS
1. Introduction
Semiconductor quantum dots (QDs) have attracted increasing attention due to the unique properties, including the large extinction coefficient caused by the quantum confinement effect [1]. They have the potential to absorb single photons to generate multiexcitons [2, 3], leading to the efficiency of the incident photon to current over 100%. Lead chalcogenide (PbS, PbSe, PbTe) QDs with narrow bandgap and large exciton Bohr radius are attractive for light-harvesting and light-emitting devices [4, 5].
Multiple-excitons generation (MEG) is one of the most prominent features of semiconductor QDs and nanomaterials [6–8]. MEG is studied in various QDs of different sizes, not only to understand the physical characteristics of this high-order phenomenon but also to improve the photovoltaic conversion efficiency through optimal utilization of photon energy [9–12]. In the absence of MEG, the energy difference between the absorbed high-energy photon and the bandgap energy (Eg) i.e. the excess energy, is lost by thermalization through phonon emission, and the hot electrons in semiconductors generated by the high-energy photons, relax rapidly to the conduction band edges in about 1 picosecond (ps). In the MEG process, the excess energy from the high-energy photons is transferred to valence band electrons through Coulomb interaction when the energy is larger than Eg, generating additional electron–hole pairs or excitons. The kinetic energy of the excitons is larger than the transition energy from the lowest unoccupied molecular orbital to the highest occupied molecular orbital [13]. Theoretically, the high efficiency of the MEG process is caused by the coherent superposition of single excitons states and multiexcitons states. The multiexcitons are generated quickly after absorbing the high-energy photons [14, 15]. The single excitons states and multiexcitons states reveal diverse relaxation rates, and the ratios of these rates determine whether the QDs can generate multiexcitons after absorbing a single photon [16, 17].
There are two possible approaches to extract excitons before ultrafast annihilation in the high efficiency and low MEG threshold materials. One method is to transfer the interface charges to the electron- or hole- acceptors in the process of the Auger recombination. The photocurrent of solar cells is improved by multiple excitons dissociation [13], but this requires the Auger recombination time as long as possible. Another one is to extract the hot-excitons to increase the open-circuit voltage of the solar cell before the hot-excitons are cooled [18], which requires the hot-excitons to be cooled as long as possible. Therefore, it is very important to study the influencing factors of the hot-excitons cooling rate and the Auger recombination rate. In common, the factors affecting excitons dynamics include the photon energy absorbed by per QD as well as the size and shape of the QDs [19–21]. Mohammed et al studied the effects of QDs size and pump-photon energy changes on the hot-excitons cooling and Auger recombination process in PbS QDs using transient absorption (TA) spectroscopy with 120 fs temporal resolution [17]. They found that the hot-excitons cooling rate decreases as the pump-photon energy increases. Also, the hot-excitons cooling rate increases as the decrease of the QDs size, indicating the crucial role of spatial confinement in the intraband relaxation process. Gesuele et al investigated the influence of pump-photon energy and pump-pulse energy on the generation and recombination of multiple excitons of PbS QDs using spectrally resolved ultrafast supercontinuum TA measurements [21]. The hot-excitons cooling time is a few ps, and the Auger recombination occurs on the time scale of tens of ps, but the precise lifetimes are not provided [21, 22].
In this article, the pump-photon energy and pump-pulse energy dependence of hot-excitons cooling and multiexcitons Auger recombination dynamics in PbS QDs have been studied for different excitation wavelengths and pump-pulse energy. Clear variation characteristics of hot-excitons cooling and multiexcitons Auger recombination rate are illustrated with the diversification of pump-photon energy and pump-pulse energy in PbS QDs. These trends are confirmed by the lifetimes fitted by the multi-exponential function of the kinetic curves.
2. Experimental
2.1. Synthesis of PbS QDs
PbS QDs were synthesized following a modified procedure reported by Paul and Tang [23, 24]. Briefly, Pb(QAC)2H2O (379.33 mg, 1 mmol), oleic acid (1.2 ml), and octadecene (ODE, 10 ml) were combined in a 50 ml three-neck flask and heated for an hour at 110 °C under a vacuum of 10−2 mbar to form lead oleate. Subsequently, the reaction flask was heated to 120 °C, and the atmosphere was switched to nitrogen. Meanwhile, (TMS)2S (210 μl) was mixed with anhydrous ODE (10 ml) in a nitrogen glove box to prepare the sulfur precursor. The sulfur precursor was rapidly injected into the reaction flask and the heater was removed. After injection for 20 s, the flask was placed in an ice-water bath for quenching the reaction, and cold hexane (10 ml) was injected. Then, the crude was quickly transferred into a nitrogen glove box. Finally, the 1:1 volume of hexane/acetone mixture was added and washed three times to separate the PbS nanocrystals. After centrifugation at 7000 rounds per minute for 5 min, the purified nanocrystals were dispersed in chloroform and stored in a nitrogen glove box in the dark for future using.
2.2. Experimental methods
The steady-state (SS) absorption spectra and photoluminescence (PL) spectra were measured with a dual-beam spectrophotometer (Cary-5000, Agilent) and SS/transient fluorescence spectrometer (FLS980, Edinburgh Instruments), respectively. The femtosecond (fs) time-resolved TA spectrum was measured by using a combination of Helios Pump-Probe System (Ultrafast Systems LLC) and laser system (Coherent). The pump laser pulse was provided by the optical parametric amplifiers (TOPAS, 800 fs). The probe light (860–1200 nm) was generated by focusing an 800 nm beam (a small part of the beam separated from the laser, about 400 nJ/pulse) onto a sapphire crystal (10 mm). A motorized optical delay line was used to change the time delay between the excitation and probe beams, and the instrument response function (IRF) was about 100 fs. The excitation beam passed through a chopper in a way that every pump pulse was blocked before reaching the sample. The sample was being excited and not excited alternately. The detector alternately measured the intensity I(λ)pumped and I(λ)unpumped of the probe beam for the 'pumped' and 'unpumped' sample. Then, the absorbance difference spectrum ΔA(λ) was constructed according to ΔA(λ) = −log(I(λ)pumped/I(λ)unpumped) from the averaged values of I(λ)pumped and I(λ)unpumped. This procedure was repeated after the delay line changed to another time delay between pump and probe. Thus, the dataset of the absorbance difference spectra ΔA(λ, τ) between 0 and 8 ns was collected, along with the data before time zero to determine the baseline. The method of Evolution-associated difference spectra (EADS) was used to extract valuable information from the dataset, where the signals were plotted at different wavelengths for a successive given delay time. Also, the approach of the kinetic trace visualizing the spectra signal's evolution in time at a given probe wavelength was employed.
The excitation wavelengths were 650 nm, 415 nm, and 325 nm, and the pump-pulse energy was 10 nJ, 20 nJ, 50 nJ, 100 nJ, and 200 nJ, respectively. During the experiments, the samples were vigorously stirred in the chloroform solution to circulate the QDs solution in the cuvette. The circulation of QDs effectively reduced sample modification induced by pump excitation, such as photoionization, which may lead to the existence of additional fast decay channels and complicates the analysis of multiexcitons dynamics [21].
3. Results and discussion
Figure 1 shows the SS absorption spectrum and PL spectrum of PbS QDs. There is a distinct peak around 917 nm in the SS absorption spectrum, corresponding to the Eg of 1.35 eV for PbS QDs. The well-defined absorption peak agrees well with the first exciton absorption peak (the 1Sh−1Se transition) [17]. The PL peak is around 1020 nm and the peak width is below 300 nm. Also, the Stokes shift is 136 meV, which is comparable to that in the report of Tang et al [24].
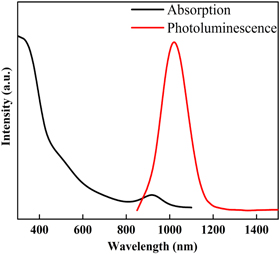
Figure 1. SS absorption spectrum (black line) and PL spectrum (red line) of PbS QDs.
Download figure:
Standard image High-resolution imageTo study the ultrafast excitons generation and decay kinetics of the PbS QDs, the TA measurements are performed. Figure 2 shows the contour plot and the EADS at different pump energies with the pump wavelength of 415 nm. The negative ground state bleaching (GSB) band in 870–960 nm and the positive hot-excitons cooling band in 970–1100 nm with pulse energy 10 nJ and 200 nJ are displayed in figures 2(a) and (b), respectively. The signal in the GSB band is not completely attenuated within 5 ns, which indicates that the excitons decay time is longer than 5 ns.
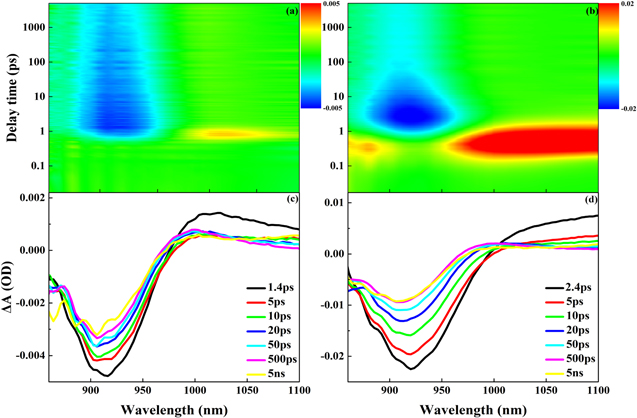
Figure 2. Contour plot at 415 nm pump with pulse energy (a) 10 nJ and (b) 200 nJ, respectively. EADS at 415 nm pump with pulse energy (c) 10 nJ and (d) 200 nJ, respectively.
Download figure:
Standard image High-resolution imageHowever, the signal in the hot-excitons cooling band decays quickly and disappears completely within 5 ps. It indicates that the electrons at a high energy level in the conduction band are relaxed to the band edge in 5 ps. The positions of these two bands did not change when the pump-pulse intensity increased from 10 to 200 nJ. This result implies that the energy level transition of excitons does not change with the increase of the excitation intensity.
Figures 2(c) and (d) show the EADS at the excitation wavelength of 415 nm with pump-pulse energy 10 nJ and 200 nJ, respectively. The amplitude of the GSB signal increase with the increase of pulse energy, because of the increase in the number of the generated excitons.
The late-time decay spectrum has a slight blueshift compared with the early-time decay spectrum, which is caused by the mutual exclusion or attraction among excitons. The larger the pulse energy, the larger the blueshift, because the interaction extent increases as the number of excitons increases [21]. The GSB signal decays smoothly with 10 nJ pulse energy, indicating that no MEG process. However, the GSB signal decays quickly within 50 ps with the pulse energy of 200 nJ, indicating that there is a rapid exciton–exciton annihilation process under this condition (Auger recombination process).
Figure 3 displays the kinetics curves for hot-excitons cooling at 1030 nm and the GSB kinetics curves at 920 nm for the excitation wavelength of 415 nm with pump-pulse energy of 10 nJ and 200 nJ, respectively. The hot-excitons cooling kinetics curves rise rapidly during the early 400 fs delay time, which represents the process of electrons transfer to a higher energy level in the conduction band. The hot-excitons cooling curves drop rapidly within a delay time of 400–2000 fs, and the GSB signal is increasing in the early 2 ps delay time. This implies that the electrons are relaxed to the edge of the conduction band [17]. Thus, the dynamic curve at any wavelength does not only represent the change of a certain energy level state.
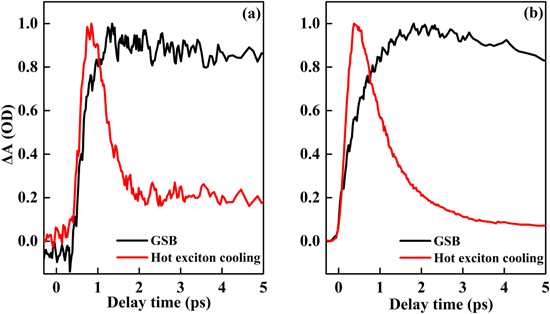
Figure 3. Hot-excitons cooling kinetics curves at 1030 nm (red line) and GSB kinetics curves at 920 nm (black line) at the excitation wavelength of 415 nm with pump-pulse energy (a) 10 nJ and (b) 200 nJ, respectively.
Download figure:
Standard image High-resolution imageFigure 4 exhibits the GSB signal of PbS QDs as a function of delay time for different pump-pulse energy with the pump wavelengths of 650 nm, 415 nm, and 325 nm, respectively. When the pump-photon energy is less than 1.9 eV, only a slow decay component with a lifetime longer than 5 ns is observed with the pulse energy of 10 nJ and 20 nJ, which is caused by the slow recombination of the single excitons. Only one electron–hole pair will be generated by absorbing a photon, and it recombines slowly when the absorbed photon energy is small. A new fast decay component with a lifetime shorter than 50 ps appears when the pump-pulse energy is 50 nJ. However, the fast decay component appears when the pump-photon energy is between 1.9 and 2.98 eV with the pulse energy of 20 nJ. The fast decay is caused by the Auger recombination of multiexcitons. Since two or more electron–hole pairs are generated by absorbing one high-energy photon. The energy or momentum released by the recombination of the electron–hole pairs is transferred to other electrons through collision, promoting this electron into a higher energy state [3, 25]. When the pump-photon energy is larger than 2.98 eV, the rapid relaxation components can be directly observed with the pulse energy of 10 nJ. With the increase of pump-pulse energy, the time for the GSB signal reaching the minimum value increases, implying the hot-excitons cooling time increases. But the Auger recombination time decreases which is caused by the increase of the density of the exciton [26].
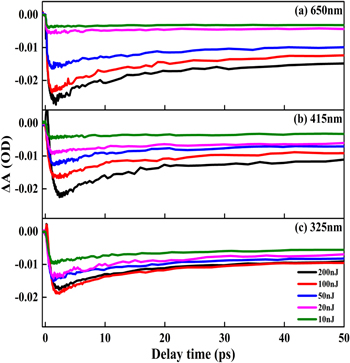
Figure 4. Dependence of the GSB kinetics curves of PbS QDs on the pump-pulse energy with the pump wavelengths of (a) 650 nm, (b) 415 nm, and (c) 325 nm, respectively.
Download figure:
Standard image High-resolution imageFigure 5 shows the hot-excitons cooling kinetics curves of PbS QDs as a function of delay time for different pump-pulse energy with the pump-pulse wavelengths of 415 nm. As the pump-pulse energy increases from 10 to 200 nJ, the amplitude of the hot-excitons cooling signal increases more than ten times, and the time required to reach the maximum value increases. It means that the number of electrons in the higher energy level of the conduction band increases. Besides, the decay time in the hot-excitons cooling kinetic curves increases when the pump-pulse energy increases, which is caused by the 'phonon bottleneck' [27]. Concurrently, the relaxation rate of electrons is reduced, leading to the accumulation of electrons [28, 29].
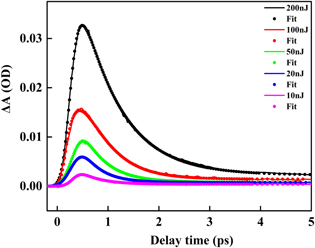
Figure 5. Pump intensity dependence for hot-excitons cooling kinetics curves of PbS QDs for 415 nm excitation.
Download figure:
Standard image High-resolution imageTo further analyze the multiexcitons formation and recombination kinetics and their relation with pump-photon energy and pump-pulse energy for PbS QDs, the GSB kinetics curves are excited by different pump wavelengths and pump-pulse energies were extracted and fitted. The fitting formula is ΔA(t) = a1exp(–t/τ1) + a2exp(−t/τ2) –c1exp(−t/τet) [30, 31], where a1, a2, and c1 are amplitudes. τ1 is the decay time constant in the range of tens of ps that corresponds to the nonradiative Auger recombination process. τ2 corresponds to the single excitons relaxation in the time scale of nanoseconds (ns). And τet is the formation time constant with a time scale of hundreds of fs, corresponding to the relaxation from the higher energy level to the edge of the conduction band. The fitting parameters of the GSB kinetic curves are illustrated in table 1. The proportion of the Auger recombination process increases gradually from 38.4% for 415 nm with 20 nJ to 66.7% for 325 nm with 100 nJ in the exciton decay process. It indicates that the number of excitons increased with the increase of pump-photon energy and pump-pulse energy. The hot-exciton cooling time increases from 377 to 609 fs, and Auger recombination time decreases from 16.7 to 11.2 ps, when the pump-pulse energy increases from 10 to 200 nJ with the pump-photon energy of 3.8 eV. It is consistent with the results of figure 4. Consequently, the hot-exciton cooling time is positively correlated with the pump-pulse energy, but the Auger recombination lifetime is negatively correlated with the pump-pulse energy. The relation between the exciton dynamics and the pump-pulse energy in PbS QDs is consistent with the results of previous studies [17, 21].
Table 1. Fitting parameters of the GSB kinetic curves of PbS QDs.
| Pump energy | 650 nm | 415 nm | 325 nm | |||
|---|---|---|---|---|---|---|
| τet/ps (Weights/%) | τ1/ps (Weights/%) | τet/ps (Weights/%) | τ1/ps (Weights/%) | τet/ps (Weights/%) | τ1/ps (Weights/%) | |
| 10 nJ | 0.084 (100) | — | 0.216 (100) | — | 0.377 (100) | 16.7 (51.0) |
| 20 nJ | 0.169 (100) | — | 0.263 (100) | 15.6 (38.4) | 0.387 (100) | 14.8 (54.7) |
| 50 nJ | 0.226 (100) | 16.9 (41.4) | 0.289 (100) | 14.5 (39.8) | 0.399 (100) | 14.1 (56.5) |
| 100 nJ | 0.263 (100) | 15.5 (52.6) | 0.503 (100) | 14.4 (55.3) | 0.507 (100) | 12.4 (66.7) |
| 200 nJ | 0.322 (100) | 14.5 (47.4) | 0.589 (100) | 14.1 (65.0) | 0.609 (100) | 11.2 (53.3) |
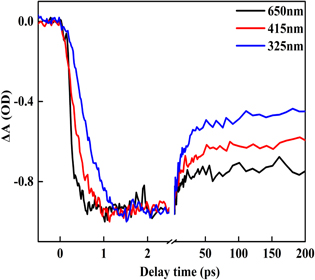
Figure 6 demonstrates the GSB kinetics curves of 920 nm for different pump-photon energy at the pump-pulse energy of 50 nJ for PbS QDs. The hot-excitons cooling time increases, while the rapid Auger recombination time of the multiexcitons decreases when the pump-photon energy increases from 1.9 to 3.8 eV. This is consistent with the kinetic fitting results where the hot-excitons cooling time increases from 226 fs to 399 fs, and the Auger recombination life reduces from 16.9 to 14.1 ps. Therefore, the hot-excitons cooling time is positively correlated with the pump-photon energy, however, the Auger recombination time is negatively correlated with the pump-photon energy, which agrees well with the results reported by Mohammed et al [17, 22]. Thus, there is a competitive relation between hot-excitons cooling and MEG. Besides, there exists a competitive relation between the nonradiative Auger recombination and radiative single-excitons recombination [32–34].
Figure 6. Normalized GSB kinetics curves with the pump wavelength of 650 nm, 415 nm, and 325 nm with the pump-pulse energy of 50 nJ for PbS QDs.
Download figure:
Standard image High-resolution image
4. Conclusion
In summary, ultrafast excitons dynamics including hot-excitons cooling and multiexcitons relaxation in PbS QDs are studied by using the TA technique. The generation and relaxation of multiexcitons in PbS QDs have been confirmed. The hot-excitons cooling time in 1 ps and multiexcitons Auger recombination time in 20 ps is obtained. As the pump-photon energy increased from 1.9 to 3.8 eV, the hot-excitons cooling time increased 500 fs, and the Auger recombination time decreased 5.5 ps. But the proportion of the Auger recombination process in the exciton decay process gradually increased by about 25%. Besides, there is a blueshift in the EADS at the late-time decay spectrum compared to the decay spectrum in early-time due to the interaction of excitons. Also, the process of exciton relaxation is obtained by analyzing the TA spectroscopy, and the relation between hot-excitons cooling and MEG is acquired in PbS QDs. The MEG dynamics results in PbS QDs would shed light on the further understanding of the optoelectronic application based on PbS QDs.
Acknowledgments
This work is supported by the National Natural Science Foundation of China (Grant No. 12074104 and 11804084), the Foundation for Key Program of Education Department of Henan Province (Grant No. 19A140011), and the Young Backbone Teacher Training Program in Higher Education of Henan Province (Grant No. 2019GGJS065).
Data availability statement
The data that support the findings of this study are available upon reasonable request from the authors.
Disclosures
The authors declare no conflicts of interest.