
Abstract
In this work, a feasible one-pot approach to synthesize manganese oxide/graphene composites, the so-called plasma-enhanced electrochemical exfoliation process (PE3P), has been developed. Herein, a composite of graphene decorated with manganese oxide nanoparticles was prepared via PE3P from a KMnO4 solution and graphite electrode under a voltage of 70 V in an ambient environment. By controlling the initial KMnO4 concentration, we obtained distinct MnO2/graphene samples. The prepared samples were characterized by scanning electron microscopy, transmission electron microscopy, x-ray diffraction, x-ray photoelectron spectroscopy, and Raman spectroscopy. The electrochemical measurements of the MnO2/graphene composites revealed that the specific capacitance of the samples is approximately 320 F g–1 at a scan rate of 10 mV s–1, which is comparably very high for manganese oxide/carbon-based supercapacitor electrode materials. Considering the simple, low-cost, one-step and environmentally friendly preparation, our approach has the potential to be used for the fabrication of MnO2/graphene composites as the electrode materials of supercapacitors.
Export citation and abstract BibTeX RIS

Original content from this work may be used under the terms of the Creative Commons Attribution 4.0 license. Any further distribution of this work must maintain attribution to the author(s) and the title of the work, journal citation and DOI.
1. Introduction
Since its discovery, graphene has been a state-of-the art material [1]. With adjacent sp2-hybridized carbon atoms uniformly arranged in six-membered rings in a honeycomb crystal structure, graphene inherits various superior properties such as exceptional charge carrier mobility (200.000 cm2 V–1 s–1) [2], good mechanical strength (130 GPa) [3], high thermo-conductivity (5300 W m–1 K–1) [4], and an ultrahigh specific surface area (2630 m2 g–1) [5]. Graphene, thus, has potential diverse applications such as in sensors, catalysts, medicine, electronics, and energy storage devices [6–8]. Among those practical uses, graphene applied in supercapacitors has been researched extensively, for example, for enabling ultrafast charge/discharge and prolonging the performance of electrical double-layer capacitors [9].
Manganese oxides (MnOx) are other good candidates for application in supercapacitors due to their rich polymorphism, structural flexibility, and low thermodynamic equilibrium voltage versus Li/Li+ [10]. With the most stable structure among them, manganese dioxide (MnO2) is also cost-effective, environmentally friendly, and has a high calculated capacitance of up to 1370 F g–1 [11]. However, many works have revealed that besides the large change in volume and gradual agglomeration of metal grains, there are two main drawbacks hindering the utilization of manganese oxide for pseudocapacitors: the thickness of the surface layer and the intrinsically low electro-conductivity [12, 13]. The first challenge lies in the crystalline structures of MnO2 with the basic unit [MnO6]: Mn atoms located in the center and six O atoms at each corner of the octahedron [14]. Different internal bonding arrangements lead to different crystalline structures ordered from α, β to λ, which result in a distinct electrochemical performance and the broad distribution of MnO2 nanoclusters [10, 15]. The second challenge, the low electrical conductivity of MnO2, can be improved by incorporating high electrical conductive substrate materials, such as conducting polymers and graphene [16–18]. Tremendous interest has been paid to MnOx/graphene composites as electrode materials for supercapacitors with the expectation of gaining superior properties of the individual components [19–21].
Thus far, to the best of our knowledge, these MnO2/graphene composites are usually synthesized under extreme conditions with a high cost, a multi-step process, and harmful byproducts. Li and his colleagues, for instance, dipped hydrothermally reduced graphene from treated graphite at 1050 °C with 98% sulfuric acid into a mixed KMnO4/K2SO4 solution for 10 and 200 min to obtain the final MnO2/graphene composite [22]. In an approach via a calcination process, Sun et al used the Hummer method to make a GO solution mixed with Mn(CH3COO)2 with the addition of hydrazine hydrate, which was then annealed at 500 °C in a 5% H2/Ar atmosphere for 5 h to form a MnO/graphene composite [23]. In contrast to traditional methods, a new method, the so-called plasma-enhanced electrochemical exfoliation process, is able to synthesize these composites in an ambient environment without further special requirements. PE3P can be simply described as the combination of electrolysis and arc discharge, where the cathode is negative, and the anode is positive. Because the current distribution tends to concentrate at edges and points, under the high electrical field generated by a high DC voltage, the plasma-like electrical surge occurs at the cathodic graphite electrode. As a result, graphene sheets are exfoliated instantaneously with the formation of nanoparticles from the electrolyte solution. In fact, PE3P was introduced in the synthesis of MoS2/graphene composites in our previous work and showed promising potential to be applied in making other transition metal dichalcogenides/graphene composites [24]. Apparently, due to the electrochemical reduction of the [MoS4](NH4)2 precursor, small MoS2 nanoparticles, sized 2–10 nm, were generated simultaneously with the graphene nanoplatelets to form MoS2/graphene composites at the vicinity of the graphite cathode tip. Herein, our work aims to prepare MnOx/graphene composites via PE3P, and characterize their properties by scanning electron microscopy (SEM), transmission electron microscopy (TEM), Raman spectroscopy, x-ray diffraction spectroscopy (XRD), and x-ray photoelectron spectroscopy (XPS). Besides, a brief look into the supercapacitor behavior of the material is also a part of our objective.
2. Experimental section
2.1. Materials and methods
Highly ordered pyrolytic graphite 99.99%, potassium permanganate (KMnO4), and potassium hydroxide (KOH) were purchased from Sigma-Aldrich. Deionized (DI) water was used as the solvent for all experiments. All chemicals and reagents were used directly as received without further purification.
Our experimental setup is schematically illustrated in figure 1. 150 ml of KOH (3 %) and 0.0237 g of KMnO4 (1 mM) at a pH of approximately 12 were used as the electrolyte solution. The electrolyte solution was ultra-sonicated for 10 min to gain a homogeneous solution. A highly oriented pyrolytic graphite rod with a diameter of 6 mm and a length of 150 mm was used as the cathode calibrated above the solution and a 25 × 10 mm Pt plate used as the anode electrode was submerged deeply into the solution. The cathode tail was sharpened to 1 mm in diameter. Two electrodes were coupled under the maximum voltage of 70 V from a DC bias (110 V-3 A, Kikusui Electronics Corporation, Japan). The current density was stabilized in the range of 0.4–0.6 A by adjusting the distance of the cathode and the solution interface with a mechanical scissor lift. The reaction beaker placed in an ultrasonic cleaner operating at the frequency of 50/60 kHz and a power of 280 W. The ultrasonic bath was assisted by a cooling water-flow system to avoid any sudden rise in the surrounding temperature due to a long period of plasma activation.
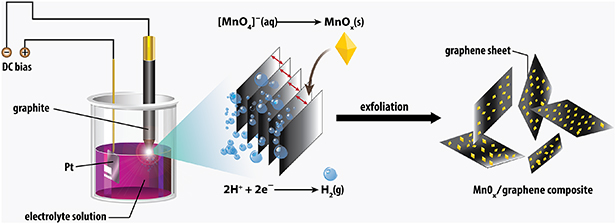
Figure 1. Schematic of the synthesis of the MnOx/graphene composites.
Download figure:
Standard image High-resolution imageAfter 60 min, the product was collected by vacuum filtration through a polyvinylidene fluoride (PVDF) membrane with a pore size of 0.2 µm after being washed with DI water and ethanol to reach a neutral pH of 7. The final material was then dried at 80 °C for 24 h and stored in a drying box at room temperature with a weight of about 40 mg. The samples were denoted as G, GM1, GM5, and GM10 for the initial KMnO4 precursor solution concentrations of 0, 1, 5, and 10 mM, respectively. A similar preparation process was conducted with two Pt electrodes in 5 mM of KMnO4 solution to synthesize manganese oxide individually, and is denoted as sample M.
2.2. Characterization preparation
SEM images were recorded on a Hitachi S-4800 field emission SEM. SEM samples were prepared by drop-drying from a water/ethanol suspension of the composite material on a Si wafer. TEM (Hitachi 9500, 300 kV) was conducted using specimens dispersed in ethanol and then dropped onto a copper microgrid coated with a holey carbon film, followed by the evaporation of the ethanol.
The crystallographic structure of the samples was determined by a D2 XRD system (Equinox 5000) equipped with a Cu Kα radiation and a Ni filter (λ = 0.1542 nm).
Raman spectra were recorded by a LabRam HR Evolution with a laser wavelength of 532 nm. XPS measurements were performed on an S-Probe TM2803 spectrometer and fitted with OriginLab Pro 9.0 software. Quantitative analysis of the XPS spectra was carried out using Shirley background subtraction before performing a least-square-error fit with a mixture of Gaussian and Lorentzian line shapes.
2.3. Electrochemical measurements
Electrochemical measurements of the prepared samples were recorded via cyclic voltammetry (CV), galvanostatic charge-discharge (GCD), and electrochemical impedance spectroscopy (EIS) on a Metrohm Autolab PGSTAT 302 N with a standard three-electrode cell system composed of a working electrode, a Ag/AgCl reference electrode (in 3 M of KCl solution), and a Pt counter electrode utilizing 1 M of Na2SO4 aqueous solution as the electrolyte. A homogeneous slurry was prepared by mixing the active material sample, acetylene black, and PVDF at the weight ratio of 80:10:10 in a small amount of N-methyl-2-pyrrolidone solvent as a viscous paste. The working electrode was prepared by coating 20 µl of as-prepared slurry onto a Ni foam (0.25 × 0.25 cm), followed by drying in a vacuum heater at 60 °C for 2 h. The loading mass of the active materials was about 0.64 mg cm–2. CV tests were carried out in the range of –0.6 to 0.4 V (vs. Ag/AgCl) at different scan rates of 10, 20, 40, 60, 80, and 100 m V–1. GCD measurements were performed at different current densities (1.0, 2.0, 3.0, 4.0, and 5.0 A g−1) in the potential range of −0.6–0.4 V. EIS measurements were implemented in the frequency range from 100–0.1 Hz at an open circuit potential with an AC perturbation of 10 mV. The specific capacitance Cs (F g–1) of the active materials were calculated from CV and GCD curves using Cs = (∫I.dt)/(mΔV) and Cs = (IΔt)/(mΔV), respectively where I is the discharge current (A), Δt is the discharge time (s), ΔV is the potential window (V), and m is the weight of the electroactive materials in the working electrodes (g).
3. Results and discussion
3.1. The reduction of KMnO4 and the PE3P mechanism
In a previous work, we synthesized molybdenum disulfide nanoparticles from a redox process of [MoS4]2−anions, which contains both molybdenum and sulfur elements, with KOH and (NH4)2SO4 as the electrolyte solution [24]. Thus, at first, a similar hypothesis was proposed to synthesize manganese oxide because potassium permanganate precursor also carries two vital elements in the desired products. After the first-step reduction, permanganate anion is reduced into manganate, which theoretically will continue to be reduced into manganese oxides. However, unlike the MoS2 with high chemical resistivity, the MnOx is unstable in the basic environment of KOH as an electrolyte solution. The manganese oxides tentatively recombine with oxygen gas from either the reaction's product or the surrounding atmosphere to reform manganate ions. This equilibrium prevents the formation of MnOx nanoparticles.
The case here is much different from thiomolybdate salt since there was no chemical loop in the formation of the MoS2 nanoparticles. Acidic solvents such as H2SO4, HCl, or HNO3 cannot be used here as they could react with manganese oxide to form the respective dissolvable salts in the final solution. Our only option, therefore, is to dilute the strong basic electrolyte into a weaker one. However, if the electrolyte is diluted too much, the electrical conductivity of the solution becomes too low, which weakens the electrical field, and then deters the discharge plasma process. Ultraviolet-visible spectroscopy was utilized in order to keep track of the manganate anions. Unless there is a decline in the concentration of K2MnO4 after PE3P, a smaller amount of MnOx particles is formed. Based on the observed results, the optimized concentration of KOH was 3% after many attempts from 10%, as in previous work, down to 1%, the point when no plasma occurs.
At the cathode, not just MnOx particles are formed, but graphene is peeled off from the graphite electrode as well. The mechanism of the graphite exfoliation is due to two key factors: the formation of intercalated hydrogen bubbles and the electromagnetic force of negatively co-charged graphitic layers at the tip head (figure 1).
Being simultaneously co-synthesized, MnOx particles tend to attach to graphene surface simply by a van der Waals force. There is no chemical bonding between these two components.
3.2. Characterization data
The compounds synthesized from the redox PE3P were found to contain graphene and a type of manganese oxide. MnOx, as we assumed it while the variable x could be any number in the range of 0–3 is found to be MnO2 based on the XRD, Raman and XPS results. Based on the data in JCPDS 18–0802, manganese oxide has the characteristic peaks of δ-MnO2 with (001), (002), (110), and (119) planes indexed at 12.3°, 24.8°, 37.1°, and 65.1° respectively with the average size of 12.4 nm calculated by a Scherrer equation (figures 2(a) and (b)). These peaks are identical to the inter-atomic distance of the edge-sharing MnO6 octahedron unit in the crystal structure with a basal spacing of 0.72 nm. The XRD patterns also reveals an intensive narrow peak at 26.6° corresponding to the (002) basal reflection of graphite with aninterlayer spacing of 0.34 nm (figures 2(c) and (d)) [25]. In term of Raman spectra, graphene has three characteristic peaks at 1352, 1578, and 2695 cm–1 for the D, G, and 2D bands, respectively. The D band represents the disordered structure of graphene, and the G band corresponds to the stretching sp2 bonds of the carbon atoms. Thus, the low intensity of the D band and high one of the G band suggests that the prepared sample has a low defect and the large in-plane sp2 domains of C–C bonding. The ratio of ID/IG remained unchanged in both samples suggesting that the addition of the MnO2 precursor was insignificant in the formation of the graphene itself.
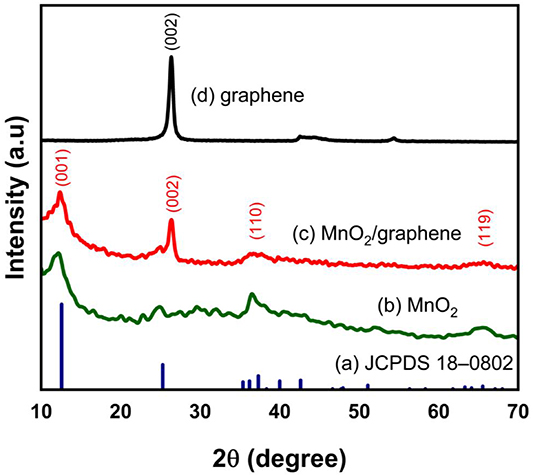
Figure 2. XRD patterns of (a) manganese oxide from JCPDS 18–0802, (b) MnO2, (c) MnO2/graphene composite, and (d) graphene.
Download figure:
Standard image High-resolution imageThe chemical configuration of MnO2 was confirmed by the analysis of Raman spectra with three identical peaks located at 490, 579, and 635 cm–1 (figure 3). In comparison to Zhang et al work [26], manganese oxide peaks shifting to the higher values is expected due to the presence of graphene as the dominant material in the composite. The 490 cm–1 peak is considered a characteristic feature of δ-MnO2. The 579 cm–1 band is attributed to the Mn—O lattice vibrations while the appearance of the 635 cm–1 band represents an intermediate formation of manganese oxide during the decomposition of permanganate [27, 28].
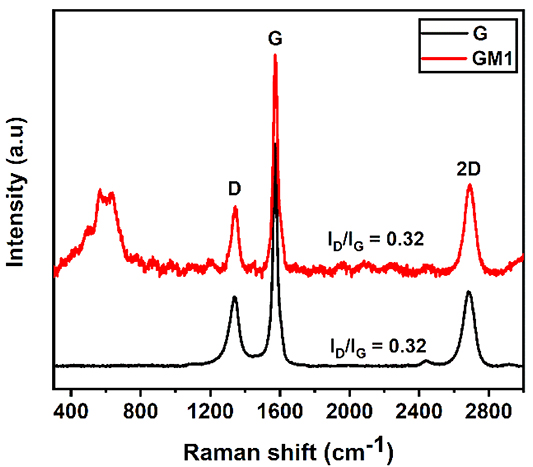
Figure 3. Raman spectra of graphene (black) and MnO2/graphene composites (red).
Download figure:
Standard image High-resolution imageThe analysis of the XPS data showed the presence of carbon, manganese, and oxygen elements in the composite sample. The peaks at around 642.5 and 653.5 eV are attributed to the doublet MnIV 2p3/2 and 2p1/2, respectively (figure 4(b)). Compared to Yang et al work, these peaks are slightly shifted positively [29]. The chemical shift in the XPS spectra is possibly due to the change in the binding energy of the core electrons corresponding to the local oxidation state of the main element. Therefore, we suggest that besides the strong interaction of MnO2 with the graphene substrate, the high electronegativity of oxygen doped continuously to MnI, MnII, and MnIII in the manganate equilibrium resulted in the slip in electron density, leading to a small rise in the binding energy of manganese as in MnIVO2. Figure 4(c) illustrates the deconvolution of C 1 s spectrum consisting of C = C (284.5 eV) and C–C (285.3 eV) as characteristics of sp2 and sp3 carbon hybridization in graphitic materials [25]. Some oxygen defects were detected in C–O/C = O at 286.3 eV, which belongs to the oxygenated groups such as hydroxyl, carbonyl, and epoxy in a graphene oxide structure [30]. In spite of the insignificant amount of GO that could not be determined from the XRD data, we hypothesize that edged carbon atoms in a few graphene sheets were likely burnt up to the closest oxidative stages due to the abundance of activated oxygen generated in the reduction of permanganate and the surrounding air under the ultra-high temporary temperature at the plasma point.
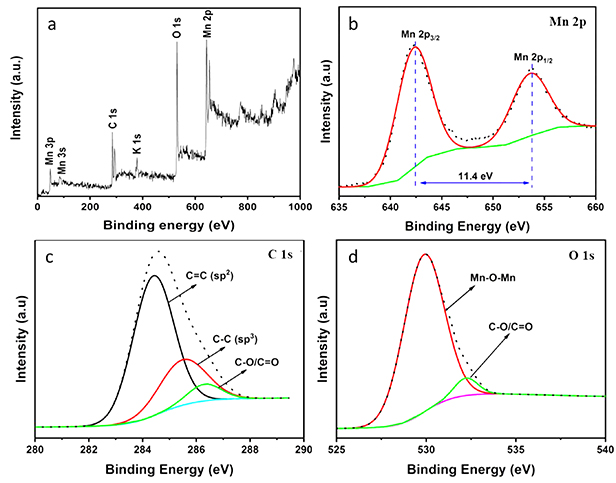
Figure 4. XPS spectra of MnO2/graphene composite.
Download figure:
Standard image High-resolution imageGraphene nanoplatelets denoted as the G sample, with no manganese oxide, attained a wide lateral size with about ten layers observed as shown in figures 5(b) and (f). Not only the size of the MnO2 particles increases but also thedistribution of its density thickens on the graphene sheets when the initial concentration of KMnO4 increases from 1.5%–10% respectively in the GM1, GM5, and GM10 samples (figures 5(c)–(e)). This behavior is similar to that in our previous work on the synthesis of a MoS2/graphene composite. The higher concentration of the precursor causes a higher amount of nanoparticles created at the same time, which then results in bulk aggregation due to the similarity in their chemistry. In TEM images of sample GM1, MnO2 is observed with an average size of 10–20 nm decorated on the surface of multi-layer graphene nanoplatelets (figures 5(f)–(i)).
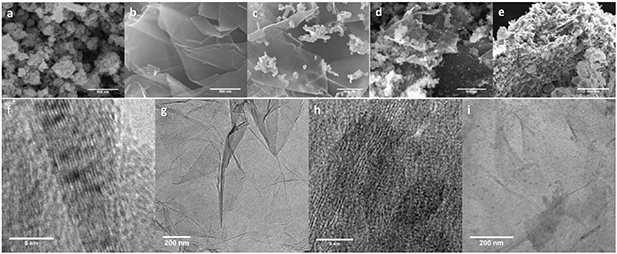
Figure 5. SEM images of MnO2/graphene in (a) MnO2, (b) graphene, (c) GM1, (d) GM5, (e) GM10 and TEM images of (f), (g) graphene, (h), (i) graphene and MnO2 nanoparticles in GM1.
Download figure:
Standard image High-resolution image3.3. Electrochemical characteristics
Figure 6 shows the CV curves for the G, GM1, GM5, GM10, and M samples at varied scan rates within a similar potential range of −0.6 to 0.4 V. The CV curve of G (figure 6(a)) is approximately rectangular and symmetric in shape, even at a high scan rate, implying an excellent capacitive behavior and fast charge-discharge process. This could be attributed to the great access of the electrolyte to the electroactive surface of the electrode materials. The combination of graphene with MnO2 in the composite samples resulted in the deviation of their CV curves from the rectangular shape (figures 6(b)–(d)). However, no redox peaks are observed, as in the case of the MnO2 sample (figure 6(e)), indicating pseudocapacitive characteristics. At the same scan rate, all composite samples have a much higher internal area than the neat G (graphene) and M (MnO2) samples, indicating a considerable enhancement of the capacitance of the composite electrodes. The possible origins of this synergistic effect can be attributed to (i) an increase in the electrical conductivity due to the presence of graphene; (ii) the larger surface area of MnO2 nanoparticles anchored on graphene; and (iii) the promotion of electron transport between the electrode and electrolyte solution. This phenomenon has also been observed previously in MnO2-carbon composites as well as other hybrid materials [31–33]. As shown in figure 6(f), the specific capacitance calculated at any scan rate is strongly dependent on the composition of the composite samples, and decreases in the order of GM1 > GM5 ≈ GM10 > M > G. At the scan rate of 10 mV s–1, the Cs of GM1 is 320 F g−1, while that of the G, GM5, GM10, and M samples are 34, 193, 198, and 120 F g−1, respectively.
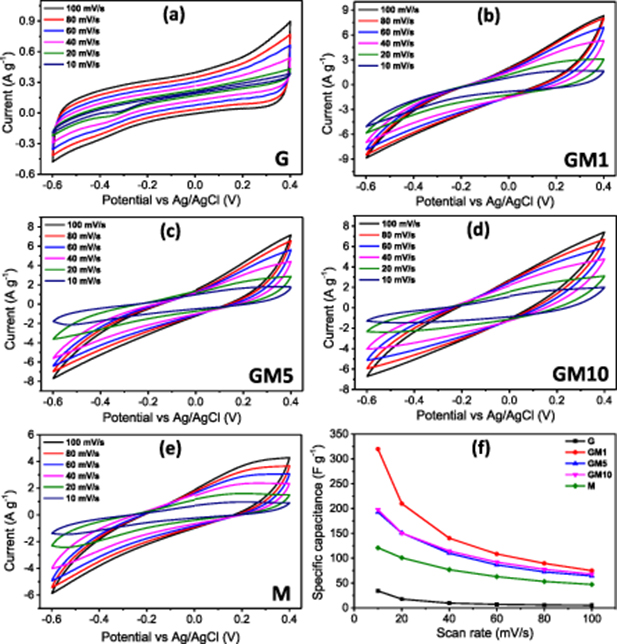
Figure 6. (a)–(e) CV curves of the G, GM1, GM5, GM10, and M samples, correspondingly. (f) Cs versus scan rate for all samples.
Download figure:
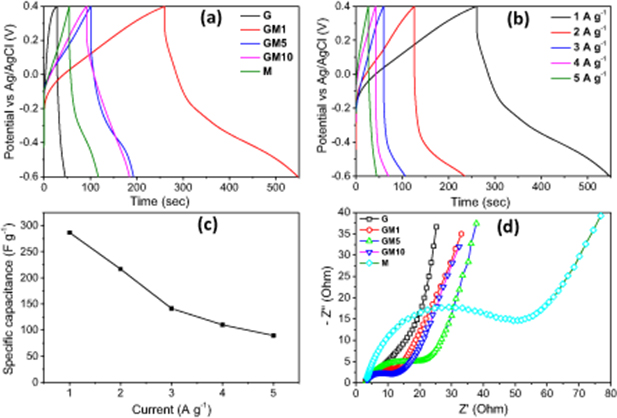
Standard image High-resolution imageFigure 7(a) shows the galvanostatic charge-discharge profiles of all samples at the same current density of 1 A g−1. The discharge time of the samples follows the order of G < M < GM10 < GM5 < GM1, indicating that the Cs values of all the composite electrodes are higher than those of the neat graphene and MnO2 ones. The GM1 sample exhibits the highest Cs value, harmonizing with the results of the CV tests. Here, the composite materials obtained using a higher concentration of KMnO4 exhibit lower capacitance, probably due to the larger size of MnO2 particles formed on the graphene support.
Figure 7. (a) GCD profiles of all electrode materials at a current density of 1 A g−1; GCD profiles (b) and Cs (c) of GM1 at different current densities. (d) Nyquist plots of all electrode materials.
Download figure:
Standard image High-resolution image
The GCD profiles of the GM1 sample at different current densities are presented in figure 7(b), which demonstrates the pseudocapacitance nature of the composite materials. Also, the IR drop in the discharge curves considerably increases with current density, suggesting a relatively large internal impedance of the composite electrodes. Therefore, to reduce the internal impedance and enhance the capacitive performance, a higher content of conductive additives should be used. Figure 7(c) shows the Cs values of the GM1 sample calculated from its discharge process and plotted versus the current density. The Cs values of the GM1 sample are 286.5 and 89.5 F g−1 at current densities of 1 and 5 A g−1, respectively. The outstanding electrochemical performance of GM1 as compared to the other composite materials is possibly attributed to its high electrical conductivity and optimal coverage of MnO2 particles on the graphene support. The Cs value of GM1 is reasonably high compared to various MnO2-carbon composite systems prepared by different methods, as shown in table 1.
Table 1. The methods of synthesis and electrochemical performance of MnO2—carbonaceous composites in recent works.
| Material | Synthesis method | Electrolyte | Maximum Cs | Reference |
|---|---|---|---|---|
| MnO2/CNT | Modified reflux | 1 M Na2SO4 | 201 F g−1 at 1 A g−1 | [34] |
| MnO2/CNT-graphene | CVD/wet reduction | 1 M Li2SO4 | 251 F g−1 at 1 A g–1 | [35] |
| MnO2/graphene | Microwave irradiation | 1 M Na2SO4 | 310 F g–1 at 2 mV s–1 | [36] |
| MnO2/rGO | Hydrothermal | 6 M KOH | 342.8 F g–1 at 0.5 A g–1 | [37] |
| MnO2/nitrogen-doped graphene | Hydrothermal | 5 M LiCl | 305 F g–1 at 5 mV s–1 | [38] |
| MnO2/carbon QDs/graphene aerogel | Hydrothermal | 1 M Na2SO4 | 721 F g–1 at 1 A g–1 | [39] |
| MnO2/graphene hydrogel | Hydrothermal | 1 M KOH | 445.7 F g–1 at 0.5 A g–1 | [40] |
| MnO2/graphene nanoparticles | Mechanical mixing | 1 M Na2SO4 | 422 F g–1 at 0.1 A g–1 | [41] |
| MnO2/rGO | Electrodeposition | 1 M Na2SO4 | 300 F g–1 at 10 mV s–1 | [42] |
| MnO2/graphene | PE3P | 1 M Na2SO4 | 320 F g–1 at 10 mV s–1 | This work |
As presented in figure 7(d), the Nyquist plots of all the electrode materials exhibit a linear form in the low-frequency region, indicating typical capacitive behavior. The slope of those linear parts of all the composite electrodes is higher than that of the bare MnO2, indicating faster kinetics and that a more reversible Faradic reaction occurred on their surface. The equivalent series resistance (Rs) of the electrode material is determined by the intercept of its Nyquist plot with the real axis in the high-frequency region. This is the combination of the ionic resistance of the electrolyte, the internal resistance of the electrode material, and the contact resistance of the electrode material with the current collectors. It was found that the Rs values of all the composites slightly rose with the increase of MnO2 content. In other words, the Rs values of all the composites are lower than that of the pristine MnO2, indicating the decisive role of graphene in enhancing the electrical conductivity of the composite. Whereas, the diameter of the semicircle increases with MnO2 content, indicating a rise in the charge transfer resistance (Rct) in composite electrodes. It is likely because of the presence of more MnO2 particles which inhibit the access and exit of electrolytes during the intercalation/deintercalation process. The Nyquist plots were fitted with an equivalent electrical circuit using Nova software, and the details of the circuit parameters are given in table 2.
Table 2. Circuit parameters of the samples.
| Sample | Rs (Ohm) | Rct (Ohm) | C (µF) | W (mMhO) |
|---|---|---|---|---|
| G | 2.98 | 0 | 900 fF | 15.4 |
| GM1 | 3.2 | 5.63 | 178 | 37.6 |
| GM5 | 3.48 | 18.4 | 51 | 22.4 |
| GM10 | 3.53 | 6.46 | 136 | 106 |
| M | 3.62 | 40.9 | 48.2 | 9.97 |
4. Conclusion
In summary, a straightforward approach for the synthesis of MnO2/graphene nanocomposites was presented via directly applying high-voltage electricity on two precursor materials in an ambient environment. PE3P is a new, simple, and green methodology which does not necessitate any special requirements. Manganese oxide nanoparticles sized from 10–20 nm were decorated on multilayer graphene nanoplatelets in the composite structure. Owing to the synergistic effect, the prepared samples exhibited a relatively large specific capacitance of up to 320 F g−1 in comparison to each component. In addition, two critical deductions have been made from this one-pot synthesis. Firstly, the more massive the amount of starting precursor is, the thicker the distribution and the larger the size of the manganese oxide particles will be. Secondly, the morphology of the exfoliated graphene sheets seemingly was not affected by the change in the concentration by adding hybridized components. By adjusting the proportion of the electrolyte, the DC power, and the reaction time, it is possible to improve the quality and quantity of ideal products. With its economic affordability and environmental friendliness, PE3P has the promising capability to be scaled up at an industrial level, for example, by multiplying the number of cathode tips, enlarging the reaction vessel, or surging the stable DC power. Based on these concepts, PE3P can be useful in the preparation of other compounds such as oxides, sulfides, and even metals on graphene substrates for various purposes.
Acknowledgments
The authors acknowledge the financial support of the National Foundation for Science and Technology Development (NAFOSTED) (Grant No. 103.99-2017.360).