

Abstract
We report extensive calculations, based on the modified hypernetted chain (MHNC) theory, on the hierarchical reference theory (HRT), and on Monte Carlo simulations, of thermodynamical, structural and phase coexistence properties of symmetric binary hard-core Yukawa mixtures (HCYM) with attractive interactions at equal species concentration. The obtained results are throughout compared with those available in the literature for the same systems. It turns out that the MHNC predictions for thermodynamic and structural quantities are quite accurate in comparison with the MC data. The HRT is equally accurate for thermodynamics, and slightly less accurate for structure. Liquid-vapor (LV) and liquid–liquid (LL) consolute coexistence conditions as emerging from simulations, are also highly satisfactorily reproduced by both the MHNC and HRT for relatively long ranged potentials. When the potential range reduces, the MHNC faces problems in determining the LV binodal line; however, the LL consolute line and the critical end point (CEP) temperature and density turn out to be still satisfactorily predicted within this theory. The HRT also predicts with good accuracy the CEP position.
The possibility of employing liquid state theories HCYM for the purpose of reliably determining phase equilibria in multicomponent colloidal fluids of current technological interest, is discussed.
Export citation and abstract BibTeX RIS
1. Introduction
Hard-core Yukawa mixtures (HCYM) have been investigated by a number of authors over the last three decades (see [1–13] in a non exhaustive list). Since these systems are considered as a reasonable albeit rough modelization of simple molecular fluid mixtures, colloidal suspensions or globular protein solutions [14, 15], most of the studies available in literature have been devoted to the determination of their phase diagram, and to the interplay between liquid–vapor (LV) and liquid–liquid (LL) consolute equilibria occurring therein. Such knowledge is considered in fact of primary relevance for most practical applications involving those real systems.
In this paper we too investigate phase coexistence conditions of HCYM both by liquid state theories and computer simulation. On the top of that, we here also show a contextual comparison against simulation of the predicted thermodynamic and structural properties. Such a comprehensive investigation of the model is usually not reported in the pertinent literature (see [5, 13] and references therein). In [13], in particular, we have reported about thermodynamic and structural properties of asymmetric HCYMs, without exploring phase equilibria conditions. The highly satisfactory performance of the theory adopted in that paper prompts us to reconsider the mostly studied case of symmetric HCYMs with the aim to perform an extensive study of those systems through the joint employment of liquid state theories and computer simulation. We also examine the influence of the inverse Yukawa potential range parameter on the overall phase portrait of the system, and in particular on the interplay between LV and LL equilibrium. Calculations are performed by employing the modified hypernetted chain (MHNC) integral equation [16–18] and the hierarchical reference theory (HRT) (see [8] and references quoted therein). We compare the theoretical internal energies, pressure and radial distribution functions (RDFs) against the respective Monte Carlo (MC) quantities, either available from the literature or produced by us. Phase coexistence lines are also determined through theories and computer simulation and compared with previous results obtained by us [5], and by other authors through simulation [11, 12], the same HRT [8] and the self-consistent Ornstein–Zernike approximation (SCOZA [19]), another integral equation theory that has been employed for the description of HCY fluids [9–11].
As we shall show, the MHNC and the HRT reproduce either semi-quantitatively or quantitatively the computer simulation thermodynamic and structural results of HCYM, while phase coexistence conditions turn out to be predicted at a qualitative or semi-quantitative level. Such an accomplishment appears remarkable, since physical predictions from liquid state theories are much less computationally demanding than computer simulations, especially as far as the determination of phase equilibria is concerned.
An issue specific to HRT which was left open in previous investigations of symmetric mixtures [8] and is relevant to this study, is the possibility that this theory would not predict all the classes of phase diagrams generally expected for these systems. Here we settle this point by showing that the supposedly missing class is indeed there, and give some reasons why it has formerly proved elusive to detect.
The paper is structured as follows: in section 2 we introduce the model and summarize the theoretical frameworks adopted. Results and discussion are reported in section 3: specifically, in section 3.1 we present our results for the thermodynamics, the correlations, and the phase diagram, and compare them with former theoretical and simulation predictions, while the discussion of the phase behavior of HRT is dealt with in section 3.2. The conclusions follow in section 4.
2. Model and methods
We consider a binary system of particles interacting through the pair potentials
where r is the center-to-center distance between two interacting HCY particles, σ is the collision diameter, equal for any  pair (in absence of Yukawa interactions this model is equivalent to a hard-sphere mixture [20]),
  is the energy parameter between two particles, belonging to species i and j respectively, with
  , a condition stating the symmetry of the mixture also with respect to like interactions, and z is the inverse length decay parameter. The relevant thermodynamic parameters of the model mixture are the partial and total number density of particles
  and ρ, respectively, and the mole fraction of species i, defined as
  . We also shall employ reduced temperature and densities,
  , and
, and  , respectively.
We then briefly introduce the theories we shall employ by referring the reader to previous papers for a more detailed description.
We first recall the basic MHNC theory [16]. One starts from the Ornstein–Zernike (OZ) equation [17] for the homogeneous mixture which reads
where  and
and  are the pair and the direct correlation functions, respectively, and
  are the radial distribution functions. The OZ equations are then solved under the integral-equation closure based on the exact cluster expansion relationship [17]

in which  , T is the temperature, kB is the Boltzmann constant, and the unknown bridge function
  is usually approximated with that of hard spheres, that is by assuming
  where
where  is an effective diameter for which the hard sphere bridge function has to be calculated [16]. The choice of such adjustable parameter is done so as to enforce the thermodynamic consistency of the theory, that is the equality between the equations of state, or between the compressibilities, as calculated through the virial and compressibility route from structure to thermodynamics (see [13, 16, 18] for details).
In what follows, besides the calculation of thermodynamic and structural quantities, we shall employ the MHNC also for the determination of the residual multi-particle entropy

where sex is the excess entropy per particle of the system and
is the two-particle contribution to the multiparticle expansion of Nettelton and Green [21] of the excess entropy. As earlier shown in [22],  acts in several fluids as an indicator of phase transitions both in one and two component fluids [5, 23, 24]. Indeed, as it has been shown in detail in [25], for the case of non additive hard-core Yukawa mixtures, the vanishing of
  signals with good accuracy the onset of demixing transitions; in general, as also discussed in [26], the
  condition appears suitable to disentagle the onset of different types of ordering in a number of systems examined, thereby significantly expanding the initial applications of such 'entropic criterion' beyond the liquid-solid freezing transition. In this paper, in particular, we shall determine the consolute point line of HCYM as the locus of thermodynamic points for which the condition
  is satisfied.
As in [13] the numerical solutions of the MHNC is obtained through the Gillan [27] algorithm on a space-grid of 8192 points spanning over  . Solutions at high densities and low temperatures, that is for thermodynamic conditions which might correspond to subcritical conditions in the liquid pocket of the phase diagram, are obtained through a mixed isothermal-isochoric path (circumventing the two-phase coexistence region) along which a sequential (in density or temperature) solution of the MHNC is implemented (see [13, 18]).
As far as the HRT is concerned, its application to binary fluids, and in particular to symmetric HCYM has been performed in [8], which paper we refer the reader to for a detailed illustration of this theory. Here we just recall that in this approach one makes use of a renormalization-group (RG)-like procedure, where the long-wavelength Fourier components of the microscopic interaction are gradually introduced into the hamiltonian of the mixture. To this end, the interaction  is split into its singular, hard-core part and its smooth attractive tail
  , namely, the Yukawa potential for the system considered here, and the latter is switched on by gradually introducing its Fourier components
  . Any intermediate stage of this process, such that only Fourier components with wavevectors exceeding a certain cutoff Q have been taken into account, physically corresponds to suppressing fluctuations on a length scale
  . Long-range fluctuations are recovered in the limit
  , when the free energy of the fully interacting system is obtained, while the mean-field free energy enters as the initial condition at
  .
.
The evolution of the Helmholtz free energy  from the mean-field to the fully interacting value is described by an exact equation which, however, is not closed, since it contains the direct correlation functions in Fourier space
 ![$[\widetilde{c}_{Q}(k)]_{ij}$](https://content.cld.iop.org/journals/0953-8984/29/36/365102/revision2/cmaa7c8bieqn027.gif) . In order to obtain a closed theory, these quantities must then be expressed by resorting to some approximation. As in all former applications of HRT, including the study of [8], the closure adopted is similar to the random-phase approximation (RPA) inasmuch as the direct correlation function is assumed to be linear in
. In order to obtain a closed theory, these quantities must then be expressed by resorting to some approximation. As in all former applications of HRT, including the study of [8], the closure adopted is similar to the random-phase approximation (RPA) inasmuch as the direct correlation function is assumed to be linear in  . However, unlike in RPA, the amplitude of
  is regarded as an unknown function of the thermodynamic state, to be determined in such a way that
 ![$[\widetilde{c}_{Q}(k)]_{ij}$](https://content.cld.iop.org/journals/0953-8984/29/36/365102/revision2/cmaa7c8bieqn030.gif) satisfy, for every Q, the compressibility rule which relates
satisfy, for every Q, the compressibility rule which relates ![$[\widetilde{c}_{Q}(k = 0)]_{ij}$](https://content.cld.iop.org/journals/0953-8984/29/36/365102/revision2/cmaa7c8bieqn031.gif) to the second density derivatives of
to the second density derivatives of  . By enforcing this rule, one obtains a closed, non-linear partial differential equation (PDE) for
  as a function of Q,
  ,
,  , or, equivalentely, Q, ρ,
  .
.
The HRT PDE has been solved numerically starting from  in the rectangular domain
  ,
,  . The results reported here have been obtained mostly on a density-concentration grid of
  mesh points, except for those pertaining to figures 12 and 13 to be illustrated at the end of section 3.2, for which larger grids have been used, as specified there. We remark that a single HRT run gives an isotherm on the whole density-concentration plane, even though in this paper results at
  will be shown only in section 3.2.
The main advantage of HRT over other liquid-state theories is that it embodies several features of the RG description of critical phenomena in a treatment based on the microscopic hamiltonian of the fluid. These include scaling, non-trivial critical exponents, and the correspondence between universality classes and different fixed points of the RG flow [28]. Moreover, the feature of HRT undoubtedly most relevant to this study is that the coexistence region is correctly recovered as the domain where the chemical potential of each species is constant along the lines at constant temperature and pressure. In other words, the condition of thermodynamic equilibrium are implemented directly by the theory, without any need to enforce them a posteriori.
3. Discussion
3.1. Results
In all our calculations, we used σ as unit length. We also define  , and
, and  as the depth of the like and unlike interaction, respectively, and introduce the ratio
  to characterize the relative strength of interaction in the mixture.
Results for the excess internal energy per particle  (with N total number of particles), the pressure P, and the chemical potential μ are reported in table 1 for
  ,
,  and different temperatures, densities and z values. By first looking at the MC data at fixed z, it appears that
  decreases (i.e. increases in absolute value) with the increasing density. For given z and
  , such a decrease is nearly linear in ρ. This is not surprising, given that one has
Table 1. Internal energy per particle  , pressure P and chemical potential μ for a symmetric equimolar HCYM with
  at various z values and temperatures. Here
  . Values in parentheses refer to error bars in the simulation data.
| z |  |
 |
 |
 |
 |
||||||
|---|---|---|---|---|---|---|---|---|---|---|---|
| MC | HRT | MHNC | MC | HRT | MHNC | MC | HRT | MHNC | |||
| 1.8 | 1.08 | 0.45 |  |
 |
 |
0.146(0.0030) | 0.140 | 0.133 |  |
 |
 |
| 1.8 | 1.08 | 0.55 |  |
 |
 |
0.249(0.0003) | 0.233 | 0.218 |  |
 |
 |
| 1.8 | 1.04 | 0.55 |  |
 |
 |
0.103(0.0045) | 0.154 | 0.140 |  |
 |
 |
| 2.4 | 0.85 | 0.40 |  |
 |
 |
0.139(0.0004) | 0.141 | 0.135 |  |
 |
 |
| 2.4 | 0.85 | 0.50 |  |
 |
 |
0.191(0.0012) | 0.181 | 0.177 |  |
 |
 |
| 3.0 | 0.75 | 0.40 |  |
 |
 |
0.170(0.0010) | 0.168 | 0.166 |  |
 |
 |
| 3.0 | 0.75 | 0.50 |  |
 |
 |
0.234(0.0019) | 0.222 | 0.223 |  |
 |
 |
For the states reported in the table, the change in density is rather small and will therefore have a minor effect on the integral. Indeed, a semi-quantitative estimate of  for these states can already be obtained by mean-field theory, in which correlations are disregarded altogether.
Inspection of entries at equal densities in the lower part of table 1 shows that  increases (i.e. decreases in absolute value) on increasing z, despite the decrease in
  . Such a behavior is also accounted for by (6), since as z increases, the off-core part of the interaction decreases in absolute value, and this effect dominates over the decrease in
  , given the small amount of the latter. Again, mean-field theory provides a semi-quantitative estimate of the change of
  .
.
As for theoretical predictions, it emerges from table 1 that the MHNC energies are almost quantitative in comparison to the MC data for the different set of parameters explored, namely in the ranges  ,
,  , and
, and  . The MHNC pressures also appear in overall quite good agreement with MC. The overall performances of the MHNC for energy and pressure appear thus comparable to those for asymmetric mixtures, as can be verified by looking at figure 2 of [13]. As for the MHNC chemical potentials, these appear moderately overestimated (less negative) at
  (slowly decaying potential) irrespective of the density and temperature, and underestimated (more negative) for higher z values (short-ranged potential) at relatively low temperatures.

Figure 1. RDF for a HCYM of concentration  with
with  ,
,  at
at  and
and  . Left:
  ; right:
  .
.
Download figure:
Standard image High-resolution image
Figure 2. Same as figure 1 for  .
.
Download figure:
Standard image High-resolution image
Figure 3. RDFs for  and z as in figure 1, and at
  ,
,  .
.
Download figure:
Standard image High-resolution imageHRT results for pressure and chemical potential are rather close to those of MHNC, and overall at least equally accurate. The internal energies, while still remaining accurate, show deviations from the MC data slightly larger than those of MHNC. As a side remark, we may observe that the HRT results for the internal energy reported in the table, which have been obtained by numerical differentiation of the excess Helmholtz free energy  with respect to β, agree very closely with the values determined via (6) according to the internal energy route, the deviations ranging from a fraction of a percent for
  to ∼
to ∼ for
for  . Hence, consistency with the internal energy route is very satisfactory, even though it has not been explicitly imposed.
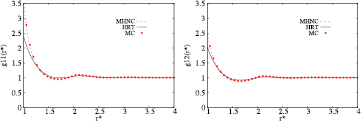
Figure 4. RDFs for  ,
,  ,
,  at
at  and
and  .
.
Download figure:
Standard image High-resolution image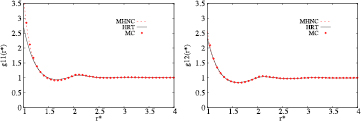
Figure 5. Same as figure 4 for  .
.
Download figure:
Standard image High-resolution imageWe turn now to structural results by examining the RDFs of the system. These are shown in figures 1–7. We first focus on MC results: the like RDFs  do not display relevant variations for the
  combinations and intervals considered: indeed, contact values of the RDFs are almost uniformly ≃
 and oscillations appear comparable in all the various panels displayed. A similar remark holds for unlike correlations described by
  , with contact values ≃
 for all the cases considered.

Figure 6. RDFs for  ,
,  ,
,  at
at  and
and  .
.
Download figure:
Standard image High-resolution image
Figure 7. Same as figure 6 for  .
.
Download figure:
Standard image High-resolution imageTurning to the theoretical  it clearly appears that the MHNC patterns agree quantitatively, almost everywhere, with the simulation curves. Compared to MHNC, the HRT shows some deviations from the MC results, especially at contact, where it underestimates
  . Elsewhere, the agreement with simulation is good. The underestimation of the contact value does not come as a surprise since, as recalled in section 2, the form of the correlations adopted to close the HRT equation is similar to that of the RPA, which is also known to underestimate the RDFs at contact, especially for short-range interactions.
Another feature implied by the RPA-like form of the correlations assumed in HRT is that they do not fulfill the exact condition  for
for  , which stems from the hard-core interaction in (1). Even though this has not been pursued here, it is worth observing that, for the HCY potential, the above condition could be implemented analytically by turning to the smooth cut-off formulation of HRT, which differs from the sharp cut-off version used here in the prescription by which long-wavelength Fourier components of the interaction are built into the system as Q evolves from
  to 0. This formulation has been applied so far to one-component HCY fluids [30] and screened Coulomb mixtures [31]. The latter are still an instance of symmetric, equimolar HCYM, but correspond to the rather special case
  , so that the interaction is attractive only for particles of different species.
Phase diagrams are finally shown in figures 8–10. Before presenting them, let us recall that symmetric equimolar mixtures display both LV and LL phase equilibrium. The topology of the phase diagram depends on the relative location of the LV coexistence curve and the line of consolute points, usually referred to as λ-line, and has been thoroughly investigated by mean-field theory [6], numerical simulation [6, 32], and by the SCOZA that we mentioned in section 1 [7, 9–11], all of which predict the same qualitative scenario.

Figure 8. Phase diagram for a HCYM with  and
and  . Asterisks: MHNC; dotted line(black): HRT; dash-dotted line(red) and filled triangles (blue): SCOZA and MC data, respectively, from [11]; diamonds (orange): MC (this work).
Download figure:
Standard image High-resolution image

Download figure:
Standard image High-resolution image
Figure 10. Phase diagram for  . Symbols as in figure 9.
Download figure:
Standard image High-resolution imageWhen α is relatively large, while still being smaller than 1, the λ-line meets the liquid side of the LV binodal at a point of first-order coexistence, thereby terminating into a critical endpoint (CEP). At temperatures lower than Tcep, the fluid coexisting with the vapor actually consists of an equal amount of two demixed fluids with concentrations symmetric with respect to  , say
, say  and
and  . The resulting phase diagram will be hereafter denoted as type I.
At small and positive α, instead, the phase diagram changes to type III. In this case, the λ-line meets the binodal at its critical point, which is then replaced by a tricritical point. At the tricritical point, one has the simultaneous coalescence of three phases, namely, the mixed vapor and the two demixed fluids.
Moreover, in a narrow interval of α intermediate between those corresponding to type III and type I, the phase diagram displays both a LV critical point and a tricritical point at higher density. In this situation, which we shall refer to as type II, the phase coalescing with the two demixed fluids at the tricritical point is the mixed liquid instead of the mixed vapor as in type III. The three cases described above correspond, respectively, to figures 1(a), (c) and (b) of [6].
The results discussed below show that, according to both theory and simulation, the phase diagram belongs to type I for all the interaction parameters considered here. We shall further comment about the occurrence of type I topology within HRT in section 3.2.
We first examine the case  ,
,  of figure 8 and primarily focus our attention on simulation results therein shown.
Our MC results for LV coexistence can be compared with grand canonical MC (GCMC) results obtained by other authors [11] for the same z and α: as visible, the two lines are fairly coincident with each other over their liquid side portions, while on the vapor side we estimate relatively lower coexisting densities. We thus predict a somewhat wider LV binodal; however, the overall curvatures of the two phase portraits seem consistent with almost equal critical temperatures which, upon visual inspection, appear to fall in the range  . A similar agreement emerges also with the binodal curve (not shown here) obtained by other authors in [12] via grand canonical transition matrix Monte Carlo (GCTMMC) simulation. In relation to the above estimates of the LV coexistence locus, we can confirm that at
  ,
,  and
and  are (slightly) super-critical and sub-critical temperatures, respectively.
We then consider theoretical binodal curves: the MHNC compares satisfactorily well with our MC data and with those of [11], although some deviation from simulation tends to manifest in the very low density region. The HRT binodal is in good agreement with both MHNC and simulation for relatively high densities. Along the vapor branch, the agreement between HRT and our MC results is good at low temperature, while at higher temperature the HRT curve is shifted towards higher densities, most likely because its critical temperature is lower than that predicted by the present simulation and, a fortiori, by that of [11]. The SCOZA binodal, which we reproduce from [11] for a direct comparison, is in overall agreement with our theoretical results, especially those of MHNC, for which the agreement is nearly quantitative.
As far as LL coexistence is concerned, we report in figure 8 GCMC results of [11] for the  -line and compare it with our theoretical derivation. We recall that the MHNC λ-line is based on the vanishing of
  , as discussed in section 2 and illustrated in figure 11; for the HRT derivation see [8] and section 3.2 for details. It appears that the MHNC and the HRT λ-lines, in rather close agreement with each other, are also in good agreement with the λ-line of [11], by only moderately overestimating the consolution densities at each temperature. The SCOZA λ-line, which is displaced to lower densities with respect to the MC one, as already known from [11], turns out to be in qualitative agreement with our theories.
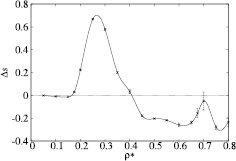
Figure 11. Residual multiparticle excess entropy  (per particle in units of the Boltzmann constant kB) versus
  at
at  , illustrating the density at which
  (see text).
Download figure:
Standard image High-resolution imageThe intersection of the λ-line with the binodal determines the CEP at which a crossover occurs from LV to LL coexistence. As visible in figure 8, CEP parameters can thereby be estimated from the intersection of the MC and MHNC binodals with the respective λ-lines. In particular, for the MHNC our prediction is 
 in quite good agreement with the simulation values of [11], namely
 (see table 2). As far as the HRT performance is concerned, we found that, for the present
  case, the numerical algorithm failed to converge in the interval
  , the latter temperature being still slightly higher than that at which the LV binodal intersects the λ-line. As a consequence, even though the phase behavior down to
  is fully consistent with the presence of a CEP, the latter had to be obtained via extrapolation. We estimate in this manner that, within two significant figures, a CEP should occur at
  and
and  (see table 2).
Table 2. CEP parameters  ,
,  for various α and z: MC simulation data and theoretical predictions according to various bibliographic sources.
 |
z |  |
 |
Source |
|---|---|---|---|---|
| 0.75 | 1.8 | 0.617 | 0.965 | GCMC [11] |
| — | 0.97 | GCTMMC [12] | ||
| 0.59 | 0.97 | SCOZA [11] | ||
| 0.63 |
0.94 |
HRT this work | ||
| 0.62 | 0.96 | MHNC this work | ||
| 0.75 | 2.4 | — | 0.73 | GCTMMC [12] |
| 0.67 | 0.72 | HRT this work | ||
≃ |
≃ |
MHNC this work | ||
| 0.75 | 3.0 | — | 0.61 | GCTMMC [12] |
| 0.71 | 0.61 | HRT this work | ||
≃ |
≃ |
MHNC this work | ||
aHRT estimates obtained through extrapolation (see text).
bobtained through the extrapolated intersection of the MHNC  locus with the GCTMMC binodal of [12].
We turn now to the  case. Our HRT results for the binodal line, together with those obtained via GCTMMC [12], are shown in figure 9. It appears that the HRT prediction is in fairly good agreement with simulation up to rather high densities. As for the MHNC, we did not determine the related binodal line. We have experienced in fact similar problems as those encountered in the already cited work by two of us [5]: we performed in that case MHNC and Gibbs Ensemble MC investigations of HCYM characterized by
  and
and  , parameters only slightly different form the present ones. Although we showed in [5] a LV coexistence line, the related calculations turned out to be affected by instabilities of the solution algorithm, a circumstance which prompted us to conjecture that the pattern we exhibited was actually corresponding to a metastable equilibrium. We have experienced here even greater difficulties of the same type, and for this reason we do not report MHNC results for LV coexistence.
A comparison of figures 8 and 9 allows us then to appreciate the effect of varying z on the binodal line. It appears that the MC LV coexistence lines shifts to lower temperatures as z increases. In fact, one goes from  at
at  , to
, to  at
at  . This effect is described qualitatively (although not quantitatively) already at the mean-field level, because of the effect of z on the integrated intensity of the interaction. The curve also sensibly flattens with the increase of z. A similar shift of the LV binodal has been observed and discussed in GCTMMC calculations for z in the range
  –
– (see [12]), with critical temperatures which compare favorably with those here visible. It is worth mentioning that a similar downward shift in temperature, and flattening of the binodal curve, on increasing z (that is, under the reduction of the attractive potential range) is well known to occur in the one-component HCY fluid case (see [29, 33] and [18] for a review).
We now consider the HRT λ-line for  displayed in figure 9. With respect to the
  case, the HRT LL coexistence appears now shifted to significantly lower temperatures, similarly to what happens for the LV curve. It also emerges that, at variance from the
  case, the intersection point of the HRT λ and binodal lines can now clearly be determined without resorting to extrapolation: we find
  and
and  . The latter temperature value is in fairly close agreement with
  of [12], and also fairly similar to the SGCMC estimate for relatively close z and α parameters as reported in [5]. We also show in figure 9 a MHNC determination of the λ line according to the
  locus procedure. Since, as said before, a MHNC binodal is not available for the present z value, we resort to the intersection of the MHNC λ-line with either the GCTMMC or the HRT binodal: as appreciable from table 2, the crossing occurs at a temperature in good agreement with that of [12]. As for the CEP density, the MHNC
  is quite close to the SGCMC result of [5].
We have finally explored the case  . Results are shown in figure 10. As for
  , the HRT again reproduces fairly well the GCTMMC binodal line from [12]; the latter further shifts down in temperature with respect to figure 9. The HRT λ-line also shifts to lower temperatures with the increase of z, with respect to that shown in figure 9. HRT gives
  ,
,  . The MHNC estimate, similar to what discussed for the
  case, is also attainable and displayed in table 2.
The simulation evidences hitherto cumulated, for different z values and from various sources, about CEP parameters prompt us to conclude that the increase of z, that is the decrease of the attractive Yukawa potential range, moderately affects the crossover density from LV to LL equilibrium, but significantly reduces the crossover temperature. The latter trend appears in full agreement with what found by other authors [12] through the GCTMMC investigation. As for the capability of liquid state theories to correctly predict such a key behavior, the HRT appears with certainty able to reproduce the changes of the CEP temperature for z in the range  . The MHNC, which yields rather accurate predictions for the CEP parameters at
  , suffers of convergency problems at higher z values in relation to the LV binodal determination; nonetheless, its predictions for the λ line, when combined with knowledge of the LV binodal from other sources, lead to rather accurate estimates of the CEP temperature; As for the CEP density, both HRT and MHNC show a good agreement with simulation for
  . At higher z values a sharp assessment is made difficult by the paucity of simulation data for
  . A related issue worth being ascertained is the influence of z on the CEP density at fixed α: as shown in table 2, on increasing z, HRT predicts an increase of
  , even though this effect is less marked than the corresponding decrease of
  . Conversely, MHNC supplemented by the
  criterion predicts a decrease of
  . At this stage more simulation estimates of the CEP density at different z values would be helpful in order to establish which trend does actually take place; in this respect, a check of the entropic criterion accuracy for the determination of the λ-line at high z values might also be in order.
3.2. The HRT and the CEP
A HRT study of the phase diagram of symmetric HCY mixtures for  as a function of α has been carried out in [8]. As stated in section 2, the HRT PDE involves both density and concentration as independent variables, so that the phase diagram was investigated at all concentrations. In this way, it was possible to establish how the features of the three classes mentioned above were reflected in the overall phase portrait in the
  space. However, that study failed to give a clear evidence of the CEP scenario of type I expected for relatively large α, suggesting instead that type II might persist even for α approaching 1. Such a situation is at variance with the results reported here, according to which HRT agrees with both simulation and other theories in predicting type I in the regime of α where it is expected to appear. Therefore, the origin of this discrepancy must be explained.
To this end, we have considered the evolution of the HRT phase diagram on the  –
– plane as
  is decreased. Here we shall refrain from a detailed analysis of all the possibile scenarios as α is changed, for which we refer the reader to [8], and focus on one of the cases studied here, namely,
  ,
,  whose phase diagram at
  has been displayed in figure 9.
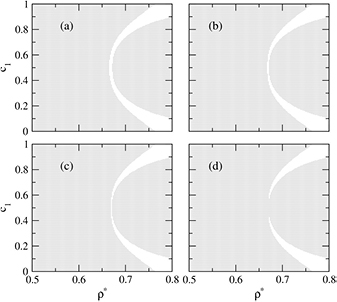
Figure 12 displays four isothermal sections of the phase diagram, each of which has been obtained by integrating the HRT PDE on a  grid. Panel (a) features two disconnected coexistence regions. The region at lower densities spanning the whole concentration axis, hereafter denoted as region A, results from two LV domains, which originate from the coexistence regions of the pure species, and get larger and larger as
  is decreased. At temperatures lower than
  , such as those of the figure, these domains merge at
  , at which LV equilibrium is azeotropic, thereby generating the LV coexistence curve of figure 9.
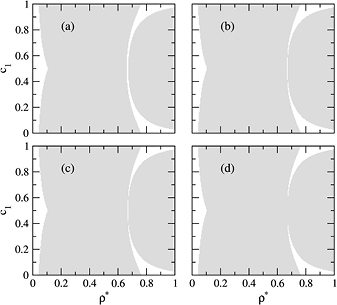
Figure 12. Isothermal sections of the HRT coexistence regions for  ,
,  in the ρ–
 plane with a mesh
  . Panel (a):
  . Panel (b):
  . Panel (c):
  . Panel (d):
  .
.
Download figure:
Standard image High-resolution imageThe λ-line is instead related to the domain at higher densities in panel (a), hereafter denoted as region B. At high  , that domain involves only one kind of phase equilibrium, namely, a demixing transition such that the coexisting phases have equal densities, and concentrations symmetric with respect to
  . As one moves to lower densities, the concentrations of the coexisting phases get closer and closer, until at
  they merge at a demixing critical point, which is located at the low-density boundary of B, and gives the position of the λ-line.
The situation at low  is displayed in panel (d). Here, A and B are no longer disconnected, but have merged into one single coexistence region. The vapor at
  is now in equilibrium with two fluids of equal densities and symmetric concentrations, so that the fluid at equimolar concentration coexisting with the vapor actually consists of an equal amount of two demixed fluids, as stated in section 3.1.
The scenario described so far is common to both type I and type II phase diagrams. The difference between the two classes is determined by how the two disconnected regions A and B of panel (a) merge into the single region of panel (d). In type I, the kind of phase equilibrium on B remains the same as that described above at all temperatures such that it has not yet met A. In particular, the low-density boundary of B at  remains a critical mixing-demixing point, until at
  it meets A at the CEP. In type II, instead, this point first changes into a tricritical point at a temperature
  higher than that at which A and B touch, and then bifurcates into two critical points at
  for
for  . These are the points which come first into touch with A as T is further lowered. Because contact initially occurs at non-equimolar concentration, there exists a narrow temperature interval in which the phase diagram shows an 'island' of homogeneous fluid enclosed in the coexistence region. This feature is characteristic of type II.
If we now consider panels (b) and (c) of figure 12, we find that they apparently conform to the scenario just described for type II, even though the homogeneous island is very narrow in density. This situation is similar to that represented in panels (c) and (d) of figure 13 of [8] for a HCY mixture with  ,
,  . As discussed there, it suggests that according to HRT, type II topology may survive at values of α significantly higher than those predicted by simulation, mean-field theory, or SCOZA, and in principle it could always prevail over type I even though, for α approaching 1, the size of the island would become so small, that telling one type from the other would become virtually impossible.
However, other features seem to conflict with such a behavior: first, the aforementioned appearance of two critical points below  should be detectable by plotting the phase diagram in the P–
 plane,
  being the difference of the chemical potentials of the species. On this plane, domain B collapses into a line at
  which below
  should bifurcate into two symmetric branches at
  , but we failed to observe such a bifurcation for the cases displayed in figure 12. This situation was already reported in [8], where it was attributed to the numerical difficulties in detecting a non-vanishing
  when the densities of coexisting phases are very close. Moreover, at temperatures just below Ttri, the equimolar fluid at the low-density boundary of B should coexist with a demixed equimolar fluid of slightly higher density, but again we were not able to observe this. Once more, one could blame the very small difference between the densities at coexistence. Nevertheless, the resolution allowed by the grid employed in figure 12 should be high enough to resolve this difference, even though it might amount to just a few gridpoints.
Prompted by this conflicting evidence, we have reinvestigated the phase diagram of the same  ,
,  mixture using an even larger
  grid in order to represent accurately the very flat shape of domains A and B near contact. The results in the interval
  are displayed in figure 13. Clearly, the alleged intersections of the domains at
  and
and  and the resulting island of mixed fluid have now disappeared, consistently with the scenario characteristic of type I. We are then led to conclude that HRT does predict a CEP for this mixture, and that the situation displayed in panels (b) and (c) of figure 12 does not correspond to a real contact between domains A and B. Rather, the two domains are actually still disconnected, but they run so close to each other, that their small distance cannot be resolved by the density grid used in the figure. Similar considerations hold for the aforementioned case
  ,
,  , which in [8] was investigated by means of a
  grid. Hence, in the light of the present investigation, HRT conforms to simulation, mean-field theory, and SCOZA in predicting that, for large enough α, the phase diagram will display a CEP at equimolar concentration.
Figure 13. Same as figure 12 with a mesh  ,
,  . Panel (a):
  . Panel (b):
  . Panel (c):
  . Panel (d):
  . Only the interval
  has been shown.
Download figure:
Standard image High-resolution image
4. Conclusions
We have investigated thermodynamic, structural properties, and liquid–vapor (LV) and liquid–liquid (LL) coexistence of two-component hard-core Yukawa mixtures (HCYM). Our attention has been restricted to the fully symmetric case, characterized by an equal size of particles of the two species, and by equal strengths of interactions between similar species. All results have been obtained for equimolar composition, and for a fixed unlike to like interaction strength ratio  . Several values of the Yukawa potential decay parameter z, and different total number densities of particles, have been explored.
Calculations have been performed by employing the thermodynamically self consistent modified hypernetted chain (MHNC) theory, the hierarchical reference theory (HRT), and Monte Carlo simulations. We performed a thorough comparison of the generated predictions with previous simulation and theoretical calculations by some of us for both symmetric [5, 8] and asymmetric [13] HCYM, and with results obtained by other authors via MC calculations and the self consistent Ornstein–Zernike approximation (SCOZA) [9–12]. We find that, similarly to what documented in [13] for the asymmetric case, the MHNC is able to predict almost always quantitatively the MC data for internal energy, pressure and chemical potential. The HRT thermodynamic predictions turn out to be, on the whole, comparable to those of the MHNC. The MHNC radial distribution functions  also turn out to be very accurate in comparison to simulations for all the different set of Yukawa parameters investigated, again to an accuracy quite similar to that already exhibited in [13] for asymmetric HCYM under different concentration and α ratio regimes. The HRT
  are in good overall agreement with simulations, although contact values are in general underestimated.
As for phase coexistence predictions, the MC evidence available from us and other authors [5, 11, 12] indicates that the binodal line shifts down in temperature and flattens as z increases, that is when the potential becomes shorter-ranged [18, 33]. This evidence for LV coexistence in symmetric HCYM is to be viewed in the more extensive scenario of similar studies of HCYM characterized by size and interaction asymmetries, unequal concentration of the mixture components, and α ratios different from the one here considered (see [5, 9–11, 13] and [18] for a review).
The MHNC predictions for the LV binodal, attainable for relatively small z, turn out to be on the whole fairly accurate. The HRT estimate of the same LV coexistence appears in good agreement with the simulation curves up to the higher z investigated. These results of the two theories compare quite favorably with the corresponding SCOZA determination of [11].
MC simulation evidence for the LL consolute point line (λ-line) at different z values (this work and [5, 11]), shows that the density range over which this equilibrium takes place is only moderately sensitive to variations in z, but that a definite downward shift in  of the λ-line occurs when z increases, that is when the potential becomes shorter-ranged. As a consequence of the joint downward shift in
  with increasing z of the LV binodal described before, the critical end point (CEP) of the mixture, located at the intersection of the binodal and λ line, also shifts to lower
  when z increases, while the crossover density is relatively less sensitive to variations in z. Conclusions similar to these were drawn by other authors in [12].
MHNC estimates of the CEP appear to be feasible and turn out rather accurate in comparison to simulations performed by us and other authors [11, 12]. For higher z values this theory experiences stability problems in its solution algorithm at high density and low temperatures, a circumstance which prevents the determination of the binodal line, but not of the λ line, which is obtained through the application of an entropic criterion described in the text. The HRT is able to predict the CEP temperature in good agreement with simulation in the investigated range  . In particular, the HRT CEP temperature drops significantly with the increase of z. Conversely, the HRT CEP density increases, although this effect is comparatively less important.
Finally, a comparison with the SCOZA λ-line of [11] shows that this theory is moderately less predictive than MHNC and HRT with respect to MC. A similar remark can be made for the prediction of the CEP parameters.
The construction of reliable microscopic theories for this basic model of a binary mixture is important for further application to more complex fluids of technological interest. For instance, mixtures of non-adsorbing polymers and colloidal nanoparticles are relevant for organic solar cell applications [34, 35], and a Yukawa tail is often envisioned as a coarse-grained way to describe the effective attraction between colloids due to the excluded volume effect of polymers.
One conclusion of this work which seems relevant for further applications is that liquid state theories (LST) appear able to reproduce from a qualitative to a semi-quantitative level the thermodynamic and structural properties of symmetric HCYM, as well as their overall phase behavior. This in particular seems true with respect to variations of the range of the attractive Yukawa potential. Since previous investigation have shown that a similar accuracy is displayed by LST also for asymmetric HCYM and for concentrations other than the equimolar one, it emerges that the above conclusion actually holds for quite an ample range of parameters characterizing those systems. Given the fact that knowledge of the phase portrait constitutes the most requested information for many real systems typically modeled in terms of HCYM (see section 1), and since simulations of phase equilibria are always rather demanding, the possibility to get reliable phase diagrams with relative easiness in terms of LST is of obvious relevance.
Simulations could also face problems in detecting the CEP for HCYM characterized by very short ranged potential ( say), for which the binodal line would presumably tend, as is known to happen for the one-component HCY fluid, to become extremely flat. Under these conditions, unravelling its intersection with the λ-line might reveal quite an elusive task. LST could be used in parallel to simulation to get an assessment of any CEP prediction for such short potential ranges.
Another instance in which LST might prove themselves useful is in the investigation of highly diluted regimes of one of the component species of HCYM. The corresponding microscopic configurations might pose in fact severe problems in terms of the statistical sampling necessary in computer simulations based on MD or MC alghorithms. In this case, an assessment of the simulation predictions against parallel theoretical approaches might be quite helpful.
In view of extensive possible application of the theoretical approaches we have examined, further checks of their accuracy are by all means in order, and will be undertaken by us fairly soon as a natural development of this work.
Acknowledgments
Two of the authors (GP and AM) acknowledge the National Research Foundation (NRF) of South Africa for financial support through Grants No. 76153, 91796, and 106020. DP wishes to thank Professor Alberto Parola for illuminating conversation.