

Abstract
A combination of special quasi-random structure (SQS) analysis, density functional theory (DFT) based simulations and experimental techniques are employed in determining the transformation pathway for the disordered γ-(U, Zr) phase (bcc structure) to transform into the chemically ordered δ-UZr2 phase (C32, AlB2 type structure). A novel Monte-Carlo based strategy is developed to generate SQS structures to study the β → ω displacive phase transformation in A1−xBx binary random alloy. Structures generated with this strategy and using DFT calculations, it is determined that (222)bcc plane collapse mechanism is energetically unfavorable in chemically disordered environment at UZr2 composition. A mechanically and dynamically stable 24 atom SQS structure is derived which serves as a structural model of chemically ordered δ-UZr2 structure. Finally, a thermodynamic basis for the mechanism of the γ to δ transformation has been established which ensures chemical ordering is a precursor to the subsequent displacive transformation to form chemically ordered δ-UZr2 structure.
Export citation and abstract BibTeX RIS
1. Introduction
Order–disorder transformations are ubiquitous in solid state phase transformations (PTs). A host of transformations can be described in terms of intimate coupling of replacive (ordering/disordering of atoms in a given lattice) and displacive (homogeneous distortions or periodic displacements of the lattice) [1]. Frequently, these transitions involve displacive-type subtle structural changes in the crystal lattice coupled with chemical ordering processes, designating fixed occupation probabilities of different atomic species at specific lattice sites, giving rise to ordered intermetallic phases in many alloy systems [1]. The β → ω transformation is a classic example of displacive transformation and is prevalent in 3d/4d-transition metal alloys. The evolution of chemically ordered intermetallic phases in Zr2Al, Zr5Al3, Ti2Al, Ni2Al, etc, involves cooperation of both chemical ordering and displacive transformation [1]. Present study attempts to quantify the degree of correlation between the chemical ordering and the accompanying displacive processes leading to the evolution of the chemically ordered δ-Zr2U alloy.
The U–Zr alloy system, which is of importance in the development of metallic fuels for fast reactors, has been studied extensively. However, an understanding of the phase evolution process, which is necessary for the thermo-mechanical processing of U–Zr or U–Pu–Zr fuels and for assessing their long-term performance in a nuclear reactor, has not been addressed adequately. The U–Zr alloy equilibrium phase diagram [2–10] shows that high temperature bcc U (γ-U) and bcc Zr (β-Zr) form a complete bcc solid-solution (γ-(U, Zr) phase). Below 995 K, this solid-solution becomes unstable and separate into a miscibility gap. Cooling of γ-(U, Zr) phase around UZr2 composition leads to the formation of the hexagonal δ-UZr2 phase. The U-rich U–Zr alloy at room temperature consists of a two-phase microstructure of orthorhombic U (α-U) with limited Zr solubility and Zr-rich δ-UZr2 phase [11]. The structure of δ-UZr2 has been considered to be closely related to the ω structure [6]. The high-temperature Zr/Ti-based bcc solid solutions transform to metastable ω phases at low temperatures [12–15]. The ω phase is one of the most extensively studied metastable phases, since its existence in the alloys has various implications for their physical and mechanical properties [1, 12–15]. Although the basic mechanism of formation of the ω phase from disordered bcc phases is displacive in nature, the formation of ordered derivatives of the ω phase certainly involves coupling of diffusional processes for accomplishing chemical ordering along with the displacive atom movements.
Recent studies on the stability and structure of the non-stoichiometric δ-phase (UZr2) were carried out by Akabori et al [2, 3] and Basak et al [4–6] using x-ray diffraction (XRD), high resolution neutron diffraction, high resolution electron diffraction and electron probe micro-analysis. According to these analyses it has been confirmed that, firstly, the composition range of the δ-phase, at 550 °C, is from 44.4 wt.% (66.5 at.%) to 62 wt.% (80.2 at.%) of Zr. Secondly, Zr atom occupies the 'Al' position (0, 0, 0) of the hexagonal cell in the modified C32 (AlB2-type) crystal structure and a random mixture of U and Zr atoms occupies the 'B' positions (2/3, 1/3, 1/2) and (1/3, 2/3, 1/2). However, the B-type site occupancy is grossly dictated by the overall composition of the alloy. At the Zr-lean end the B-type site occupancy is almost equal for both U and Zr atoms (i.e., 50% each) giving rise to the stoichiometric composition UZr2. At the Zr-rich end, Zr occupies almost 70% of B-type sites corresponding to a composition of U0.6Zr2.4. Clearly, the B-type site can accommodate Zr atoms in excess of the stoichiometric value and that in turn increases the lattice volume [2, 3]. Akabori et al [2, 3] further showed that the δ-UZr2 phase forms by a peritectoid reaction (α-U + γ-(U, Zr) → δ-UZr2) in the U-rich region at 890 K and an eutectoid reaction (γ-(U, Zr) → α-U + δ-UZr2) in the Zr-rich region at 880 K. Basak et al [4–6] examined the evolution of the as cast microstructure and formation of δ-UZr2 phase in U-rich γ-(U, Zr) alloys and concluded that formation of δ-UZr2 phase occurs through a peritectoid reaction (α-U + γ-(U, Zr) → δ-UZr2) after prolonged heat-treatment below the monotectoid (966 K) and eutectoid (935 K) isotherms. Their study also suggested that the γ-(U, Zr) → δ-UZr2 transformation is a diffusion assisted isothermal ω transformation where collapse of the {222} lattice planes [12–15] of the γ-(U, Zr) phase occurs during the ageing of the metastable γ-phase. McKeown et al [16] examined uranium-rich U-10 wt.% Zr alloy and their high resolution TEM analyses reveal that the orthorhombic α and the hexagonal δ phases coexist in the as-cast condition and TEM analysis is therefore crucial for properly characterizing the phase contents of nuclear fuels rich in U and Zr.
In these experimental studies, the composition and the temperature ranges for the formation of δ-UZr2 phase are identified and it is established that the δ-UZr2, which has remarkable similarity with the ω phase, forms in a process in which diffusion assisted displacive mechanism is operative. However, the occupation of U and Zr atoms in the AlB2 lattice is proposed without any thermodynamic basis. How the chemical ordering process influences the lattice collapse or the vice versa has not been investigated. Therefore, the unique pathway for this coupled displacive and replacive atomic movement in this transformation has not been explored. The present work is an attempt for establishing the pathway for the transformation from γ-(U, Zr) → δ-UZr2.
First-principles studies were performed for determining formation enthalpies of γ-(U, Zr) and δ-UZr2 phase using Korringa–Kohn–Rostoker exact muffin-tin orbital (EMTO) and full potential linear muffin-tin orbital methods [17–19], where atomic disorder were considered using coherent potential approximation (CPA) and/or special quasi-random structures (SQSs). Recently, Xiong et al [20] reviewed the phase stability of γ-(U, Zr) and δ-UZr2 phases using thermodynamic modelling and ab initio calculations. Thermodynamic properties, such as heat capacity, activities, and enthalpy of mixing, are well predicted using the improved thermodynamic description in this work. Xie et al [21] examined the effect of electron corrections in the standard framework of density functional theory (DFT + U) and spin–orbit (SO) coupling on the ground state properties of γ-(U, Zr) and δ-(U, Zr) phases. It has also been shown that DFT + U computed f-electron bands of α-U are in better agreement with the ultraviolet photoemission spectroscopy measured density of states (DOS) than standard DFT calculated DOS. However, no previous theoretical study illustrates the formation mechanism of δ-UZr2 phase.
Present study adopts a two-pronged DFT based simulations and experimental approach to (i) provide a thermodynamic basis to identify the necessity of chemical ordering in the formation of the δ-UZr2 phase and (ii) to reveal the interplay of chemical ordering and displacive atom movements in the formation of chemically ordered ω phase having composition close to UZr2.
2. Theoretical and experiment methodologies
2.1. Generation of A1−x Bx binary random alloy supercell to study β → ω displacive PT
The study of ground state energy landscape of a displacive PT in A1−x Bx type random binary alloy using standard frame work of first principles calculations is complex. Modelling of this problem has two primary steps. Firstly, incorporation of the statistics of the random alloy in a finite sized supercell which is computationally feasible within standard DFT framework. Secondly, mapping of parent lattice to a common sublattice by a suitable parameterization such that parent lattice continuously transforms into product. Implementation of these two steps separately is trivial but simultaneous implementation is complex. Implementation of second step has been attempted for pure elements and ordered binary alloys to study displacive PT pathway for bcc → hcp and hcp → ω PT in group IV transition metals [12–15], B2 → B19' [22] and B2 → B19 [23] PT in NiTi ordered alloys. The first step can be tackled in the standard framework of SQS approach as proposed by Zunger et al [24]. The SQSs are specially designed small-unit-cell periodic structures that closely mimic the most relevant near neighbour pair and multisite correlation functions of random substitutional alloys. The symmetry of the SQS generated finite supercell is usually monoclinic and/or triclinic as positional disorder changes the local atomic environments. Also, standard SQS approach usually generate a supercell with arbitrary shape and size keeping relation with the parent lattice vectors. Therefore, it is almost impossible to map SQS generated parent supercell into a common lattice that would transform into product lattice through simple atomic movements presented by easy parmeterizations. Moreover, the statistics of random alloy is very crucial where a displacive PT is coupled with a replacive one [1, 12, 13], as in the present study.
In this study, we aim to investigate displacive β → ω phase transition in U12Zr24 and U4Zr32 random alloys. The displacive type β → ω transformation can be best visualized by representing parent bcc lattice in the three-fold rotational symmetry around an ⟨111⟩ direction and this representation is restricted by the orientation relationships between parent bcc and product ω lattice: {111}bcc||(0001)ω ; ⟨110⟩bcc||⟨1120⟩ω (figure 1). In this representation, a bcc lattice consists of (222)bcc planes (ABCABC.. type atomic plane staking, 0-1-2-0-1-2—as shown in figure 1), with three-fold rotational axis along [111]bcc direction. The ω lattice (AB'AB'... type atomic plane staking, 0-1.5-0-1.5—as shown in figure 1) is formed by collapse of B and C atomic planes (by equal and opposite atomic movement along [111]) to an intermediate plane B'. In this PT the extent of displacement of atomic planes (B and C), represented by 1 and 2 in figure 1, towards B' is parameterized by a dimensionless parameter (Z). A continuous variation of this displacement parameter determines evolution of ω lattice form bcc.

Figure 1. Schematic diagram showing (a) stacking of the (222)bcc planes of the bcc (cubic symmetry), (b) ω' structure (partial collapse of the (222)bcc planes resulting in a trigonal symmetry), (c) the ω structure, hexagonal symmetry, by full collapse of two adjacent planes (marked as 1 and 2) into a single plane placed midway (marked as 1.5), leaving the third plane (marked as 0) undisturbed, (d) the AlB2 structure produced by a systematic collapse of the chemically ordered bcc structure, black and grey filled circles, representing B and (Al, B) atoms respectively. The parameter Z (related to displacement order parameter) is a measure of the displacement of the planes marked as 1 and 2. Z = 0 and Z = 1 corresponds to bcc and hexagonal ω structure, respectively.
Download figure:
Standard image High-resolution imagePresent study devises a systematic methodology of generating a supercell which mimic the randomness in A1−x Bx alloy in a best possible way and present the parent lattice in a desired supercell. As we intend to study displacive β → ω phase transition in U1−x Zrx alloy, the common sublattice is chosen to be a 2 × 2 × 3 supercell (36 atoms) of trigonal lattice with Z = 0 as shown in figure 1(a). The essential steps can be described as follows: (a) distribution of U and Zr atoms in a 36 atoms supercell using a Monte Carlo technique for randomly sampling configurational space of 3 × 10⁵ configurations, (b) construction of pair and multisite correlation functions (Πk,m ) for each configuration, f = (k, m), where k is the number of vertices in the figure, and m is the maximum distance spanned by the figure in units of nearest-neighbor shells. We considered all two-body figures spanning distances up to the sixth nearest neighbour (NN), all three-body figures spanning up to the fourth NN, and all four-body figures spanning up to the first NN. (c) Finally, search for structure which best match the correlation functions of random alloy over the specified set of pair and multisite interactions. In other words, we try to minimize an error function:

and pair and multisite correlation functions of most suitable supercell (compared with those of the corresponding true random alloy) presented in table 1 for U12Zr24 and U4Zr32 random alloy. Figure 2 shows distribution of the total absolute error (ε(f)) of the generated supercell for U12Zr24 random alloy. Although, we develop this methodology to study β → ω displacive PT in Zr1−x Ux type binary random alloy, but can easily be extended to study displacive PT in random binary and/or ternary alloys with any composition and symmetry of the common sublattices.
Table 1. Pair and multisite correlation functions of U12Zr24 and U4Zr32 random alloy supercells generated using novel Monte-Carlo based strategy are compared with those of ideal random structure. The number in the square brackets next to Πk,m gives degeneracy factor of the corresponding figure.
| Π2,1 | Π2,2 | Π2,3 | Π2,4 | Π2,5 | Π2,6 | Π3,1 | Π3,2 | Π3,3 | Π3,4 | Π4,1 | |
|---|---|---|---|---|---|---|---|---|---|---|---|
| [12] | [9] | [18] | [34] | [12] | [9] | [34] | [34] | [34] | [18] | ||
| U12Zr24 | 0.083 33 | 0.111 11 | 0.092 59 | 0.055 56 | 0.111 11 | 0.111 11 | −0.037 04 | −0.037 04 | −0.055 56 | −0.055 56 | 0.000 00 |
| Random | 0.111 11 | 0.111 11 | 0.111 11 | 0.111 11 | 0.111 11 | 0.111 11 | −0.037 04 | −0.037 04 | −0.037 04 | −0.037 04 | 0.012 35 |
| U4Zr32 | 0.611 11 | 0.592 59 | 0.592 59 | 0.601 85 | 0.583 33 | 0.555 56 | −0.462 96 | −0.481 48 | −0.444 44 | −0.444 44 | 0.333 33 |
| Random | 0.604 94 | 0.604 94 | 0.604 94 | 0.604 94 | 0.604 94 | 0.604 94 | −0.470 51 | −0.470 51 | −0.470 51 | −0.470 51 | 0.365 95 |
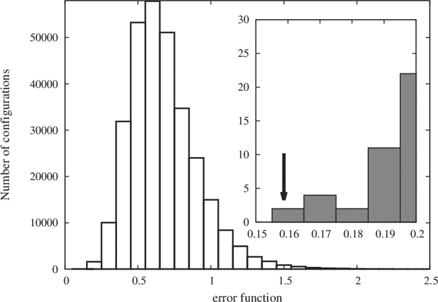
Figure 2. Variation of error function over the configurational space for generation of U12Zr24 random alloy supercell. The configurational space is sampled by 3 × 10⁵ randomly generated configurations and inset figure shows a configuration (marked by an arrow) with lowest error (<0.17).
Download figure:
Standard image High-resolution image2.2. SQS structures for partially ordered δ-UZr2
The δ-UZr2 phase is known to form in the AlB2-type hexagonal lattice (C32 structure, space group P6/mmm (no. 191), shown in figure 1(d)), where the 1a (0, 0, 0) sites are occupied by Zr atoms and the 2d (1/3, 2/3, 1/2) sites are occupied by U and Zr atoms randomly [2, 3]. To examine the ground state lattice stability of this partially ordered δ-UZr2, DFT based first-principles calculations are performed in three set of structures. Firstly, two completely ordered structures are created by occupying, in one case, the Al-sublattice (the 1a sites) with U atoms and B-sublattice (the 2d sites) with Zr atoms (C32-a, shown in figure 3(a)) and in other case, the Al-sublattice with Zr atoms and B-sublattice with one Zr and one U atoms (C32-b, shown in figure 3(b)). Secondly, six ordered structures which are 1 × 1 × 2 and 2 × 1 × 2 supercells of the structures shown in figures 3(a) and (b). The atomic arrangements of these structures are shown in supplementary information material (figure SI 1 (https://stacks.iop.org/JPCM/33/254003/mmedia)). In these ordered structures, the occupation of U and Zr atoms in the 2d sites are 1.0:1.0. Finally, four 24-atoms SQS are generated with different U/Zr occupation in the 2d sites (shown in figure 3(c)). These SQS are characterized by

where η = 1 corresponds to 1:1 occupation of U:Zr atoms in 2d sites. Similarly, η = 0.75, 0.50 and 0.25 corresponds to 0.75:1.25, 0.5:1.5 and 0.25:1.75 occupation of U:Zr atoms in 2d sites, respectively. Accordingly, U:Zr occupation in 1a sites is 0.25:0.75, 0.5:0.5 and 0.75:0.25 for η = 0.75, 0.50 and 0.25 (shown in figure 3(c)). It is important to note, in this description the structure shown in figure 3(a) (C32-a) can be represented as η = 0 structure. These SQS structures are generated using the Monte-Carlo generator of SQS as implemented in 'mcsqs' code [25]. The values of the pair and multisite correlation functions and structural information (ideal and Vienna ab-initio simulation package (VASP) optimized) of η = 1 structure is given in supplementary information material. The 'mcsqs' method is based on a Monte Carlo simulated annealing loop with an objective function that seeks to perfectly match the maximum number of correlation functions. Further, 'mcsqs' method optimizes the shape of the supercell jointly with the occupation of the atomic sites, thus ensuring that the configurational space searched is exhaustive and not biased by a pre-specified supercell shape [25].
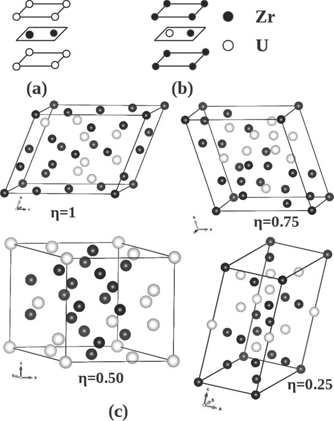
Figure 3. A schematic of the structures considered to study lattice stability of δ-UZr2. Unit cell (a) and (b) shows the ordered AlB2 (C32-a) and modified AlB2 (C32-b) structures, respectively. The mcsqs generated 24-atoms SQS cells with varying U/Zr atom occupation in 2d site characterized by parameter η.
Download figure:
Standard image High-resolution image2.3. First-principles calculations
All calculations of structural stabilities and thermodynamics properties in this study are based on DFT as implemented in the plane-wave based VASP [26]. The Perdew–Burke–Ernzerhof (PBE) parameterization of generalized gradient approximation (GGA) [27] is used as the exchange–correlation functional. The projector augmented wave (PAW) potentials [28] are used for the electron–ion interactions which include the valence states of U (5d, 4f—14 valence electrons) and Zr (4s, 4p, 5s, 4d—12 valence electrons). In our calculations, the Kohn–Sham single electron wave functions are expanded in a plane wave basis with kinetic energy cutoff 400 eV. The Brillouin-zone integrations are performed on an optimized Monkhorst–Pack [29] k-point grid of 10 × 10 × 8 for unit cells and 6 × 6 × 6 for supercells. For different structures of bcc and ω, optimization is carried out with respect to k-point meshes and plane wave cut-off energy to ensure convergence of cohesive energies are within 0.1 meV atom−1. The total energies of bcc and ω structures are optimized with respect to volume, lattice parameters and atomic positions using conjugate gradient algorithm until the residual forces and stress in the equilibrium geometry are of the order of 0.005 eV Å−1 and 0.01 GPa, respectively.
Further, screened hybrid functional parameterized by Heyd, Scuseria, and Ernzerhof (HSE06) functional [30] is used for accurate presentation of exchange–correlation function. The HSE06 takes into account the effects of nonlocal exchange with 25% Hartree–Fock contribution and a 0.2 Å−1 screening length. Due to the computational burden of hybrid functional calculations compared to standard DFT, the HSE06 calculations are restricted to the calculations of ground state structural stability of δ-UZr2 configurations.
To calculate vibrational free energies and to check dynamical stability of UZr2 configurations, the density functional perturbation theory (DFPT) as implemented in VASP code is used. To calculate phonon dispersion curve of UZr2 configurations (C32-b and η = 1) the PHONOPY [31] programme is used. Two supercells, 3 × 3 × 3 and 2 × 2 × 2, containing 81 and 192 atoms are used for the DFPT calculations for the C32-b and η = 1 structures, respectively.
The single crystal elastic constants are calculated for UZr2 structures (C32-a, C32-b and η = 1) using strain–stress method as implemented in VASP code. In this method, six finite distortions to the lattice are employed to determine the elastic tensor from the strain–stress relationship. In this study, the elastic constants have been evaluated at several strains, viz, 0.010, 0.015, 0.020 and 0.025 to the lattice to ensure the DFT calculated elastic constant values are converged within 0.5 GPa.
2.4. Sample preparation and heat treatment
Two alloys of U–Zr of compositions, U-50 wt.% (73 at.%) Zr and U-70 wt.% (85 at.%) Zr alloy were prepared by vacuum arc melting under Ar gas, details of the melting practice is given elsewhere [6]. While the composition of the former alloy is within the δ single phase field, that of the latter falls in the equilibrium two phase field of (α-Zr + δ). The rationale for selecting these two alloy compositions has been to examine the transformation process in both the stoichiometric composition and an off-stoichiometric composition where the high temperature γ (bcc) phase can be retained in a metastable condition. About 50 g of melted buttons were hot rolled using copper jacket and the samples were homogenised in single phase β phase field at 900 °C for about 6 h before quenching into water. Parts of the samples were β solutionised at 650 °C for in-situ ageing studies and the remaining parts were aged at 300 °C for 24 h for extended x-ray absorption fine structure (EXAFS) studies.
2.5. In-situ ageing studies by x-ray diffraction (XRD) using synchrotron radiation source
In-situ XRD studies at elevated temperatures have been performed with a view to examining the evolution of new phases during ageing of U-50 wt.% Zr (U-73 at.% Zr) and U-70 wt.% Zr (U-85 at.% Zr) samples at extreme conditions XRD beam line (BL-11) at INDUS-2 synchrotron source [32]. Each sample was first filed using a diamond file to produce fine powder which is loaded in quartz capillary of 300 μm diameter and sealed in argon environment. The samples were heated to 400 °C and then diffraction images were recorded at the intervals of 400 s. Diffraction images were also recorded at the intermediate temperatures, 100 °C, 200 °C and 300 °C; while the samples were heated to the isothermal ageing temperature of 400 °C. The measurements were performed on angle dispersive mode using monochromatic x-rays of wavelength 0.075 15 nm. The diffraction images were converted to 1D diffraction patterns. Ambient temperature patterns of both the samples, quenched from the equilibrium single γ-phase field, show bcc phase with lattice parameter a = 3.5667 Å as shown in figure 4. Large peak broadening in both the samples has been identified to be due to the presence of residual micro strains due to filing. Diffractograms shown in red colour are obtained from the bulk samples free from such micro-strains.
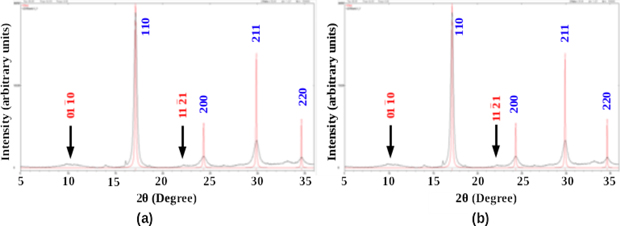
Figure 4. XRD patterns taken from the as quenched samples of (a) U-50 wt.% Zr (U-73 at.% Zr) and (b) U-70 wt.% Zr (U-85 at.% Zr) alloys. Diffuse intensity peaks and corresponding δ-indices (red) are marked by arrows.
Download figure:
Standard image High-resolution image2.6. EXAFS studies
The required thickness for U-50 wt.% Zr (U-73 at.% Zr) alloy sample was calculated to be around 50 μm for the EXAFS data recording in transmission mode. The alloy sample was ground from 1 mm to 0.3 mm using different grit size of SiC paper with water. Electropolishing was carried out using water-H3PO4 acid mixture (1:1 v/v) as electrolyte at 0 °C temperature with SS-304 cathode to reduce the thickness from 0.3 mm to 0.08 mm. Final polishing was carried out in 1200 grit size (eqv. to EPFA 4000) SiC paper to obtain the final thickness. The EXAFS data was recorded at continuous energy scanning type EXAFS beam line in INDUS-II synchrotron source of Raja Ramanna Centre for Advanced Technology (RRCAT), Indore, India [32]. EXAFS at U L-III edge (17.166 keV) and Zr K edge (17.998 keV) was performed to verify the site occupancies of Zr or U atoms around the U and Zr atoms respectively. One ionization chamber has been used for measuring the incident flux (I0) and the second one for measuring the transmitted flux (It) and absorption coefficient μ is obtained using the relationship μ(E) = log(I0/It). The repeatability of the experimental data was checked by comparing two recorded x-ray absorption spectra of the same sample. EXAFS analysis was carried out using Demeter software suite [32].
3. Results and discussions
3.1. The evolution of δ-UZr2 phase during in-situ ageing
XRD results, as shown in figures 4(a) and (b), revel that the high temperature γ phase (bcc) in samples of both the U-50 wt.% Zr (U-73 at.% Zr) and the U-70 wt.% Zr (U-85 at.% Zr) alloys could be almost fully retained on quenching from 650 °C, a temperature in the single γ-phase field (bcc), slightly above the γ/δ transus (617 °C). This observation is consistent with the observation by Basak et al [4] that the γ phase retention (significant volume% of γ) on quenching is possible only when the solutionising temperature is slightly above the γ/δ transus, but the volume% of γ significantly decreases with increase in the prior solutionising temperature in the equilibrium γ phase field. The lattice parameter of the retained γ phase, aγ has been found to be 3.567 Å. A few diffuse intensity 'peaks' close to those associated with UZr2 reflections were also noticed. These are marked by arrows and the corresponding δ phase indices in figure 4. The present observation demonstrates that the high temperature γ-phase (bcc) can be essentially retained in a metastable state on quenching in the composition range 50–70 wt.% Zr (73–85 at.% Zr), spanning across the single phase δ and a part of the (α-Zr + δ) phase fields. Uranium acts here as a stabilizer of the γ phase (bcc) of zirconium rich alloys, similar to many other alloys with addition of group V and group VI elements in the base metal, Zr.
The ageing response of the metastable γ phase in these two alloys has been found to be quite similar in the early stages of the transformation. Since the present study is focussed on the evolution of the δ phase from the metastable γ phase, the in-situ ageing studies on these two alloys were carried out in the hot stage of the angle dispersive diffraction set up of the Indus-2 synchrotron. In order to capture the process in the early stages of the transformation from the γ to the δ phase, an isothermal transformation temperature of 400 °C was chosen. However, as the sample was being heated to 400 °C, diffraction patterns were recorded at intermediate temperatures (100 °C, 200 °C and 300 °C). Diffraction patterns recorded in these in-situ heating experiments are presented in figures 5(a) and (b) for the U-73 at% Zr alloy and the U-85 at% Zr alloy respectively. Calculated structure factors for low index XRD peaks of the Zr2U (δ phase, C32-b structure) show that this structure can be distinguished from the ω structure by the presence of the  δ
peak, which is extinct for the ω structure. The progressive change of intensities of two peaks,
δ
peak, which is extinct for the ω structure. The progressive change of intensities of two peaks,  δ
, representing the chemical ordering and
δ
, representing the chemical ordering and  δ
, representing the displacement ordering, during heating up and isothermal holding at 400 °C is shown in figures 5(c) and (d) for the U-73 at% Zr alloy and the U-85 at% Zr alloy respectively. The evolution of the chemical ordering, superimposed on the ω-like displacement ordering, in a thermally activated process is thus established in both these alloys studied. However, due to the rapid ordering process for both chemical and displacement ordering, the sequence of their occurrence could not be captured in these experiments. The intensities of XRD peaks were found to saturate within 1200 s while ageing at 400 °C. The analyses of volume percentages of the δ phase after ageing at 400 °C for 1200 s have been found to be 77% and 55% respectively in U-50 wt.% Zr (U-73 at.% Zr) and U-70 wt.% Zr (U-85 wt.% Zr) alloys. In addition to the δ peaks, some weaker peaks corresponding to α-Zr appeared in U-70 wt.% Zr (U-85 at.% Zr) alloy. These observations point to the following:
δ
, representing the displacement ordering, during heating up and isothermal holding at 400 °C is shown in figures 5(c) and (d) for the U-73 at% Zr alloy and the U-85 at% Zr alloy respectively. The evolution of the chemical ordering, superimposed on the ω-like displacement ordering, in a thermally activated process is thus established in both these alloys studied. However, due to the rapid ordering process for both chemical and displacement ordering, the sequence of their occurrence could not be captured in these experiments. The intensities of XRD peaks were found to saturate within 1200 s while ageing at 400 °C. The analyses of volume percentages of the δ phase after ageing at 400 °C for 1200 s have been found to be 77% and 55% respectively in U-50 wt.% Zr (U-73 at.% Zr) and U-70 wt.% Zr (U-85 wt.% Zr) alloys. In addition to the δ peaks, some weaker peaks corresponding to α-Zr appeared in U-70 wt.% Zr (U-85 at.% Zr) alloy. These observations point to the following:
- (a)The metastable γ phase undergoes a thermally activated transformation into the δ phase on ageing at temperatures in the range of 300 °C–400 °C.
- (b)The kinetics of the γ–δ transformation appear to be fast, as the transformation reaches completion within about 1200 s at a temperature as low as 400 °C,
- (c)The close matching of the d-spacings between the parent and the product structures suggests a good lattice correspondence between the γ and the δ structure.
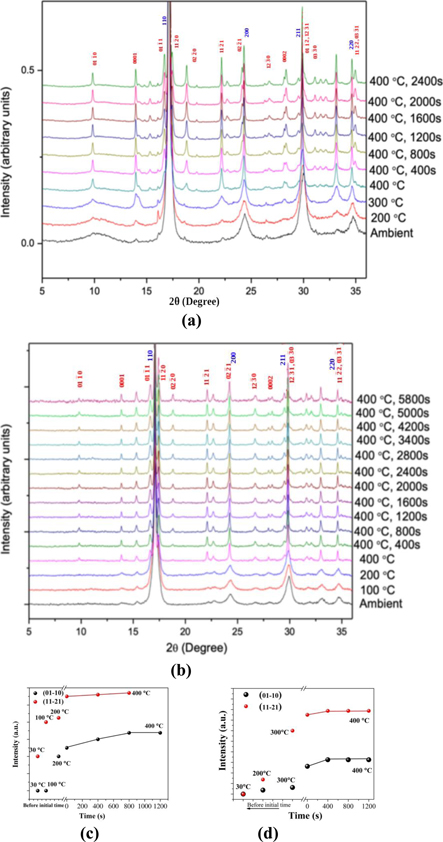
Figure 5. Stacked XRD patterns showing the evolution of the δ-phase (UZr2) during in-situ ageing of (a) the U-50 wt.% Zr (U-73 at.% Zr) alloy, (b) the U-70 wt.% Zr (U-85 at.% Zr) alloy samples at 400 °C in the synchrotron beam line. Intensification of {01–10}δ and {11–21}δ peaks during heating and isothermal ageing of (c) the U-50 wt.% Zr (U-73 at.% Zr) alloy and (d) the U-70 wt.% Zr (U-85 at.% Zr) alloy.
Download figure:
Standard image High-resolution imageThe presence of the  δ
reflections has been clearly observed in the selected area electron diffraction pattern (SAEDP), corresponding to the [111]γ
zone axis (figure 6(a)) in a sample aged at 300 °C for 24 h. It is to be noted that in the [111]γ
zone no additional reflections apart from bcc reflections appear due to the presence of chemically disordered ω phase. In order to examine the lattice correspondence between the γ and the δ structures, (SAEDP) were recorded from samples which have undergone transformation partially. Results are presented in figure 6.
δ
reflections has been clearly observed in the selected area electron diffraction pattern (SAEDP), corresponding to the [111]γ
zone axis (figure 6(a)) in a sample aged at 300 °C for 24 h. It is to be noted that in the [111]γ
zone no additional reflections apart from bcc reflections appear due to the presence of chemically disordered ω phase. In order to examine the lattice correspondence between the γ and the δ structures, (SAEDP) were recorded from samples which have undergone transformation partially. Results are presented in figure 6.
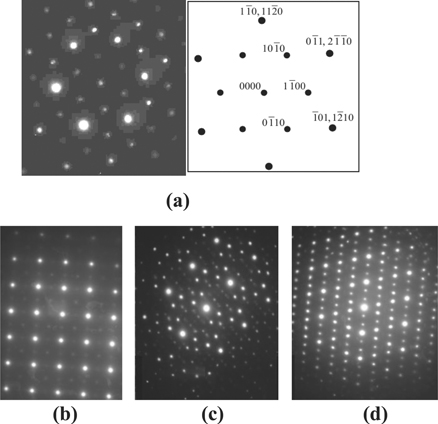
Figure 6. SAEDPs from samples containing the δ phase in the matrix of the γ phase, (a) [111}γ , (b) [100]γ , (c) [012]γ and (d) [113]γ zones, all of them contain superimposed δ reflections maintaining the orientation relation: ⟨111⟩γ //[0001]δ ; ⟨1–10⟩γ //[2-1-10]δ , which is consistent with the lattice correspondence between γ and δ structures schematically presented in real space in figure 1. The analyses of the superimposed SAEDPs (b)–(d) for the matrix γ and all crystallographic variants of δ phase, following the aforementioned orientation relation, are given in the supplementary information (figure SI 3).
Download figure:
Standard image High-resolution imageFigure 6(b) shows weak superlattice reflections superimposed on the [100]γ bcc pattern, suggesting the presence of an ordered arrangement of atoms on a bcc lattice. Figures 6(c) and (d) show super lattice reflections due to the δ phase appear at 1/3 (hkl)γ positions, where (hkl)γ refer to the bcc reciprocal lattice vectors. These observations clearly indicate that the structure of the δ phase has a remarkable similarity with that of the ω phase which are often encountered in Ti and Zr alloys, partially stabilized in the β (bcc) structure [1, 12]. The β–ω phase transition in a chemically disordered system is accomplished by a pure displacement ordering process; while in some instances, as in cases of the formation of Zr2Al (B82 structure) and Zr5Al3 (D88 structure), a chemical ordering process superimposes on the ω-like displacement ordering [33–36]. The diffraction patterns of chemically disordered ω phase in the [100]bcc and [111]bcc zones do not show any additional reflections apart from the bcc reflections. Therefore, the presence of diffuse superlattice reflections in figure 6(a) is indicative of the operation of chemical ordering as well. Figures 6(c) and (d) are exactly similar to the superimposed bcc/ω diffraction patterns corresponding to [012]bcc and [113]bcc zone axes.
Having obtained a unique correspondence between the parent γ and the product δ structures from experimental observations and demonstrating a gradual evolution of the δ phase from the γ phase during ageing at relatively low temperatures, the question of the energetics of the γ–δ transition in the Zr–U system needs to be addressed. First principles calculations, as introduced in sections 2.2 and 2.3 have been deployed for estimation of ground state energies for different transient configurations in the pathway of the structural transition from the γ to the δ phase. An attempt has been made in the following sections for estimating the changes in the ground state energies as the progressive collapse of the (222)γ planes occur in both chemically disordered and chemically ordered γ phase, the latter producing the right kind of atomic arrangements of the δ phase. It has been examined whether a prior chemical ordering in the parent bcc lattice of the γ phase is a necessary requirement for making lattice collapse energetically feasible.
3.2. The β → ω displacive transition in U1−x Zrx random alloy
Previous experimental analysis confirms that (U, Zr) complete solid-solution (γ-(U, Zr) phase) becomes unstable and separates into a miscibility gap below 995 K. The U-rich U–Zr alloy at room temperature consists of a two-phase microstructure of orthorhombic U (α-U) with limited Zr solubility and Zr-rich δ-UZr2 phase [11]. In order to shed more light on the operative displacive mechanism in the chemically disordered environment, energetics of β → ω transition in U1−x Zrx alloy is calculated using GGA–PBE. For this study, three chemical compositions namely x = 1.0, 0.8889 and 0.6667 is considered. In this study, a 36 atom supercell with chemical composition U4Zr32 (Zr-11.11 at.% U) and U12Zr24 (Zr-33.33 at.% U) is generated using a novel Monte-Carlo based strategy as described in section 2.1.
Figure 7 shows the variation of energy as a function of the degree of (222)bcc plane collapse parameterized as a function of normalized displacement parameter (Z, as shown in figure 1). The U12Zr24 and U4Zr32 random alloy supercell volumes are optimized keeping atomic positions fixed. Then the optimized supercells are used to determine energetics of β → ω displacive PT. At this point it is worth mentioning that x = 1.0 corresponds to pure Zr. Figure 7 shows that ω structure is energetically more favorable compared to β structure by 75 meV atom−1 for pure Zr and a small energy barrier of 1 meV atom−1 exists around the β structure (as shown in inset of figure 7). For x = 0.8889 (U4Zr32), ω structure is energetically more favorable compared to β structure by 26 meV atom−1 and the energy difference between β and ω has reduced. On the contrary, β structure is energetically more favorable compared to ω by 63 meV atom−1 for x = 0.6667 (U12Zr24). Previously, it is mentioned that the composition range of the δ-UZr2 phase, at 550 °C, is from 44.4 wt.% (66.5 at.%) to 62 wt.% (80.2 at.%) of Zr [2–6]. Hence, figure 7 clearly indicates even though U12Zr24 has 'right kind of chemical composition', the formation of ω structure is not possible in chemically disordered environment. The chemical ordering plays an intriguing role in the formation of δ-UZr2 phase.
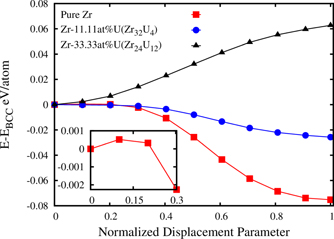
Figure 7. DFT calculated energy variation as a function of normalized displacement parameter (Z) of pure Zr, U4Zr32 (Zr-11.11 at.% U) and U12Zr24 (Zr-33.33 at.% U) random alloys, Z = 0 and 1 correspond to β and ω structures, respectively. 1 > Z > 0 defines non-ideal ω structure with trigonal symmetry.
Download figure:
Standard image High-resolution image3.3. Lattice stability of chemically ordered UZr2 alloy
In order to quantify the effect of chemical ordering on the lattice stability of UZr2 alloy, three sets of chemically ordered structures with different quantification are considered. First set of structures are based on AlB2 type structures (C32-a and C32-b) containing three atoms in the unitcell as shown in figure 2 ((a) and (b)) and section 2.2. Second set of structures can be presented as 1 × 1 × 2 and 2 × 1 × 2 supercell of C32-a and C32-b structures (shown in supplementary information material, figure SI 1). The structure C32-a and C32-b can also be designated as η = 0 and η = 1, respectively. Similarly, second set of structures are ordered derivatives of η = 1. Third set of structures are generated to present η = 0.25, 0.50, 0.75 and 1.0 as shown in figure 2(c). All these structures are fully relaxed (volume, cell shape and atomic positions) and lattice parameters, bulk modulus, cohesive energies and formation energies are reported in table 2. Table 2 also contains optimized values of pure Zr (hcp) and U (bco) structures. The formation energies (Eform) per atom of U1−x Zrx alloys are calculated as follows:

where Ecohesive(U1−x Zrx ), Ecohesive(U) and Ecohesive(Zr) are the VASP calculated cohesive energies per atom of U1−x Zrx alloy, pure U (in base centred orthorhombic ground state structure) and Zr (in hcp ground state structure), respectively.
Table 2. Ground-state properties of chemically ordered UZr2 structures along with pure Zr (hcp) and U (bco) phases are compared with experimental and other DFT calculated values. Bulk moduli are obtained by fitting cohesive energy vs volume data to the Murnaghan equation of state [52].
| Structures | V0 (a (Å), b/a, c/a) Å3 atom−1 | B0 (GPa) | Ecoh (eV atom−1) | Eform (eV atom−1) |
|---|---|---|---|---|
| HCP α-Zr | ||||
| P63 /mmc (194) | ||||
| PBE | 23.993 (3.265, 1.592) | 93.6 | −8.535 | — |
| PBE + SO | 23.396 (3.219, 1.620) | −8.532 | ||
| HSE06 | −9.803 | |||
| Experiment | 23.219 (3.2294, 1.592) | 97.2 | ||
| Previous DFT | 22.870 (3.2084, 1.600) | 95.9 | ||
| BCO α-U | ||||
| Cmcm (63) | ||||
| PBE | 20.085 (2.802, 2.084, 1.753) | 138.8 | −11.252 | — |
| PBE + SO | 20.015 (2.805, 2.076, 1.747) | 128.4 | −11.280 | |
| HSE06 | 18.82 (2.732, 2.087, 1.770) | — | −13.030 | |
| Experiment | 20.77 | 125 | ||
| Previous DFT | 20.67 | 133 | ||
| C32-a (UZr2 ) | ||||
| PBE | 23.00 | −9.096 | 0.3447 | |
| PBE + SO | 23.55 | −9.143 | 0.3047 | |
| C32-b (UZr2 ) | ||||
| PBE | 22.32 | 85.8 | −9.228 | 0.2127 |
| PBE + SO | 21.89 | −9.194 | 0.2537 | |
| UZr2 (SQS-24, η = 1) | ||||
| PBE | 22.55 | −9.386 | 0.0551 | |
| PBE + SO | 22.54 | −9.395 | 0.0525 | |
| HSE06 | −10.879 | −0.0023 | ||
| Experiment | 22.49 | −0.013 | ||
| ±0.035 |
aReference [37]. bReference [38]. cReference [39]. dReference [40]. eReference [41]. fReference [42]. gReference [43]. hReference [44]. iReference [45]. jReference [46]. kReference [47]. lReference [48]. mReference [49]. nReference [50]. oReference [2]. pReference [51].
Figure 8 shows the GGA–PBE calculated formation energies (Eform) of C32-b, 2nd set of structures (shown in supplementary information material) and η = 0.25, 0.50, 0.75 and 1.0 structures as shown in figure 2(c). The Eform and unit cell volumes of η = 0.25, 0.50, 0.75 and 1.0 structures are connected by dotted lines. The occupation of U atoms is always favorable (by ∼0.20–0.25 eV atom−1) in 2d site (i.e., η = 1) compared to sole occupation of U atoms in 1a site (i.e., η = 0). Moreover, the occupation of U:Zr by 1:1 in 2d site (i.e., η = 1) is energetically favorable by ∼0.1–0.05 eV atom−1 range compared to other fractional occupation (i.e., η = 0.25, 0.50 and 0.75). It is also evident that the structure with occupation of U:Zr by 1:1 in 2d site (i.e., η = 1) represented by 24-atom SQS cell is the most energetically favorable among the ordered structures. As UZr2 alloy contains heavy element U, the SO coupling effect is also considered for η = 0.25, 0.50 and 0.75 SQS structures. The overall trend in the Eform and equilibrium volumes remains unaltered with the incorporation of SO coupling effect.
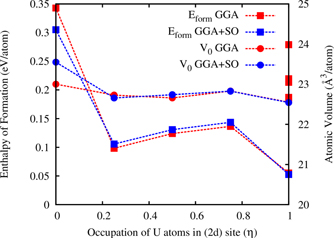
Figure 8. Variation of formation energies (in eV atom−1) and unit cell volumes (in Å3 atom−1) of UZr2 as a function of U/Zr atoms occupation on 2d site characterized by parameter η. Lines connected with points are only for visual guidance.
Download figure:
Standard image High-resolution imageTable 2 compares our GGA–PBE and GGA–PBE + SO calculated equilibrium volume, bulk modulus and Eform of considered ordered structures (C32-a, C32-b and SQS-24 (η = 1)) with those obtained experimentally [2, 49]. To find out the effect of SO coupling the equilibrium volume and bulk modulus of pure Zr (hcp) and pure U (bco) structures are compared with previous DFT results and experiments [35–48]. Our PBE calculated Eform show that SQS-24 structure is energetically favorable with respect to C32-a and C32-b which is in agreement with x-ray and neutron diffraction experiments [2, 3]. The Eform of SQS-24 structure is 0.055 eV atom−1 (table 2) calculated using PAW–PBE is in agreement to the value of 0.058 eV atom−1 calculated with PAW–PBE for a 12-atom SQS cell [21], while high temperature solution calorimetry measured value is −0.013 ± 0.035 eV atom−1. Xie et al [21] reported Eform value of 0.026 eV atom−1 calculated using PAW–PBE + U. On the contrary, Landa et al [17] reported Eform value of −0.065 eV atom−1 calculated using EMTO + CPA method. The EMTO + CPA method is known to be inaccurate for the modelling of alloys with short-range order and constituent atoms with appreciable difference in atomic radii. Therefore, the discrepancy in the Eform values of UZr2 (between PAW–PBE and LMTO + CPA) can be attributed to the inherent approximations of the DFT methods. It was also observed that Eform depends on the choice of the Hubbard U parameter in previous DFT + U study [21]. Subsequently, Soderlind et al [53] have shown that DFT + U + SO calculations using the PAW potentials results in unrealistically large volume expansions, particularly for γ-U phase, and leads to unphysical magnetic ground state in non-magnetic elemental uranium.
The difference in the Eform value calculated from our PAW–PBE study (0.055 eV atom−1) and experimentally reported value (−0.013 ± 0.035 eV atom−1) can be attributed to two factors. Firstly, modelling of chemical disorder in 2d site of AlB2-type structure and secondly, description of electronic structure to model U–Zr alloys. The chemical disordering is modelled through the SQS structure generated using the Monte Carlo generator of SQS as implemented in mcsqs code [25]. The values of the pair and multisite correlation functions the SQS structure is given in supplementary information material and it shows very good agreement with the ideal values of pair and multisite correlation functions. Therefore, our PAW–PBE calculated formation enthalpy value is converged with respect to the distribution of U/Zr atoms in the 2d Wyckoff site. Now, to understand the effect of the exchange–correlation interaction in the electronic structure description the cohesive energies of pure Zr (hcp) and pure U (bco) and UZr2 is calculated using nonlocal HSE06 hybrid functional, where a fixed amount of nonlocal Fock exchange is incorporated with the standard PBE functional. Recently, it has been shown that nonlocal rectification of standard DFT (HSE06) can correctly predict the stability sequence of Cu–Au intermetallics as well as the formation enthalpy values are in close agreement to experimental values which otherwise have been underestimated by a factor of two using semi-local approximations (GGA/LDA) [54]. Table 2 also shows the incorporation of SO coupling effect change the formation enthalpy value from 0.055 eV atom−1 to 0.052 eV atom−1. The HSE06 calculated formation enthalpy of SQS-24 (η = 1) is −0.002 eV atom−1 (shown table 2) which is in improved agreement with experimental value compared to the PBE calculated value. Hence, we believe the SQS-24 (η = 1) structure is true representation of δ-UZr2 structure.
As δ-UZr2 phase is known to be stable phase at room temperature, it is reasonable to assume that configurational entropy is playing a role in its stability. Since equal number of U and Zr atoms are distributed randomly on the B-sublattice of AlB2-type UZr2, and, Al-sublattice is completely occupied by Zr atoms, the configurational entropy (per unit cell), Sconf, is calculated using ideal solid solution relation:
![${S}_{\mathrm{c}\mathrm{o}\mathrm{n}\mathrm{f}}={k}_{\mathrm{B}}\sum _{i}{n}_{i}\left[{x}_{i\enspace }\enspace \mathrm{ln}\enspace {x}_{i}+\left(1-{x}_{i}\right)\enspace \mathrm{ln}\left(1-{x}_{i}\right)\right]$](https://content.cld.iop.org/journals/0953-8984/33/25/254003/revision4/cmabf20bieqn1.gif) , where ni
is the number of atoms at site i, xi
is the atomic concentration at site i and kB is the Boltzmann constant. The value of Sconf becomes kB 2 ln 2 = 0.462 kB/atom = 0.0398 meV atom−1 K−1. Therefore, at 300 K the configurational entropy reduces formation enthalpy by 12 meV atom−1 suggesting that the configurational entropy makes disordered δ-UZr2 structure stable with respect to α-Zr and α-U. The contribution of configurational free-energy is ∼22% of the formation enthalpy.
, where ni
is the number of atoms at site i, xi
is the atomic concentration at site i and kB is the Boltzmann constant. The value of Sconf becomes kB 2 ln 2 = 0.462 kB/atom = 0.0398 meV atom−1 K−1. Therefore, at 300 K the configurational entropy reduces formation enthalpy by 12 meV atom−1 suggesting that the configurational entropy makes disordered δ-UZr2 structure stable with respect to α-Zr and α-U. The contribution of configurational free-energy is ∼22% of the formation enthalpy.
3.4. Electronic density of states of δ-UZr2
Figure 9(a) compares the PBE and HSE06 calculated electronic DOS of α-U. As can be seen, the total DOS for uranium around Fermi energy consists of 6d and 5f orbitals. Just before the Fermi energy the contribution of 6d states is dominant. On the contrary, 5f states are dominant just after the Fermi energy. Around the Fermi level, hybridization of 6d–5f orbitals are evident. Predominant features of PBE and HSE06 calculated DOS are similar. The HSE06 calculated DOS expands the valence band width of α-U and give close agreement with XPS data [54]. In the XPS data three prominent peaks can be identified. The HSE06 calculated DOS also shows three peak features after the Fermi energy and the peak positions are roughly shifted by 1.5 eV compared to the experimental DOS. Figure 9(b) shows total and angular momentum decomposed DOS of δ-UZr2 modelled through SQS-24 structure. A pesudo-gap in the total DOS manifests a strong hybridization between U-5f and Zr-4d states. The bottom of the energy valley is present right at the Fermi energy signifying stability of the SQS-24 structure. The valence band width after the Fermi energy is elongated compared to the PBE calculated DOS.
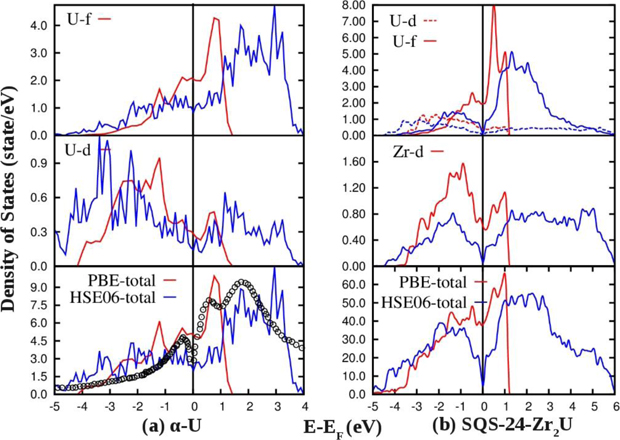
Figure 9. GGA–PBE and HSE06 calculated electronic DOS of (a) α-U and (b) δ-UZr2 structure. XPS measured DOS of α-U is also shown for comparison [54].
Download figure:
Standard image High-resolution image3.5. Phonon spectrum and elastic constants of δ-UZr2
Section 3.2 shows SQS-24 cell is a true representation of crystal structure of δ-UZr2 and has the formation enthalpy close to the experimental one. Section 3.3 shows the DOS of SQS-24 structure has features of energetically stable crystal structure. An energetically stable crystal structure needs to follow additional stability criteria of mechanical and dynamical stability to qualify as thermodynamically stable phase. In order to find mechanical stability of SQS-24, single crystal elastic constants are calculated as those are compared with C32-a, C32-b structures as well as pure Zr and U (shown in table 3). Elastic constant values of C32-b and SQS-24 cell are closely matching. The elastic constants values of SQS-24 cell satisfy all the stability criteria to qualify it as mechanically stable structure [55].
Table 3. GGA–PBE calculated single crystal elastic constants of C32-a, C32-b and SQS-24 structures. For comparison single crystal elastic constants of α-Zr and α-U are also listed in the table.
| C11 | C12 | C13 | C22 | C33 | C44 | C55 | C66 | |
|---|---|---|---|---|---|---|---|---|
| α-Zr | 148.8 | 64.3 | 68.6 | 149.0 | 162.7 | 26.4 | 25.7 | 42.6 |
| (155.4) | (67.2) | (64.6) | (172.5) | (36.3) | ||||
| α-U | 314.6 | 59.3 | 22.7 | 219.2 | 364.9 | 152.8 | 131.8 | 100.8 |
| (215.0) | (46.5) | (21.8) | (199.0) | (267.0) | (124.0) | (73.4) | (74.3) | |
| γ-U | 82.7 | 164.2 | — | — | — | 42.0 | — | — |
| C32-a UZr2 | 137.3 | 114.9 | 39.8 | 137.3 | 158.5 | 22.8 | 22.8 | 11.2 |
| C32-b UZr2 | 175.1 | 92.4 | 50.2 | 175.1 | 186.3 | 43.3 | 43.3 | 41.4 |
| SQS-24 δ-UZr2 | 175.8 | 85.6 | 51.4 | 176.7 | 201.7 | 42.7 | 42.2 | 45.4 |
aSingle crystal experiment at 4 K, reference [56]. bExperiment at room temperature, reference [57].
Figure 10 shows GGA–PBE calculated phonon dispersion curve along the symmetry directions of C32-b and SQS-24 structures. The dispersion curve of C32-b shows an imaginary phonon acoustic branch along Γ → H and Γ → X symmetry directions signifying dynamical instability of C32-b structure. On the contrary SQS-24 structure is dynamically stable with no imaginary phonon branch in the reciprocal space.
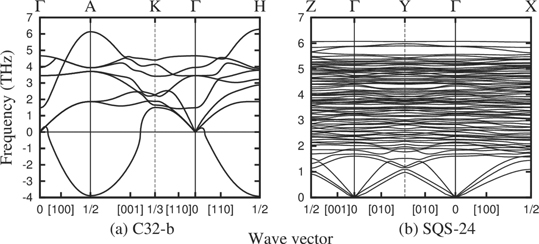
Figure 10. GGA–PBE calculated phonon dispersion curve of C32-b and SQS-24 structures.
Download figure:
Standard image High-resolution image3.6. The β → ω displacive transition in chemically ordered δ-UZr2 alloy
Section 3.2 shows β → ω displacive transition is energetically not favorable in random UZr2 alloy. Section 3.3 shows that the chemically ordered structure where all the U atoms occupy randomly 2d Wyckoff sites of AlB2-type crystal structure (η = 1) is energetically most favorable. A 24 atoms SQS structure (SQS-24) is determined which present chemically ordered δ-UZr2 structure and the HSE06 calculated formation enthalpy matches favorably with calorimetric value. In this section we intend to demonstrate the chemical ordering is an essential precursor for inducing the β → ω displacive transition. For this purpose we calculate energetic of the structures differ by chemical order (η2 parameter) as a function of (222)bcc plane collapse mechanism presented as normalized displacement parameter (Z, shown in figure 1)
In this study a set of initial bcc structures with varying η2 parameter are used and those are shown in supplementary information material (figure SI 2). Figure 11 shows (222)bcc plane collapse mechanism is energetically favorable for η2 = 1. It can also noted that η2 = 1 structure with Z = 1 is C32-b structure (as shown in figure 3(b)). Hence figure 11 signifies chemical ordering is a precursor for the subsequent displacive transformation to form chemically order ω structure (δ-UZr2).
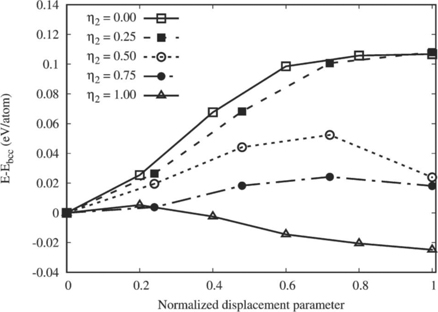
Figure 11. GGA–PBE calculated energy variation versus normalized displacement parameter (Z) as a function of chemical ordering parameter η2. Z = 0 and 1 correspond to β and ω structures, respectively.
Download figure:
Standard image High-resolution image3.7. EXAFS results
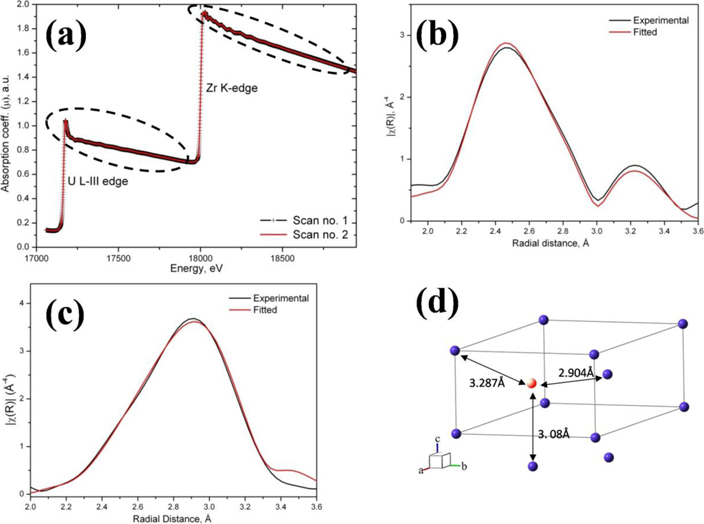
EXAFS is a characterization technique that gives information about the average local structure in terms of inter-atomic distance and the surrounding atomic species around a given species of atom. The dashed region of figure 12(a) is subjected to the background subtraction and fitting. The fitted results are further subjected to Fourier transformation followed by fitting which finally gives rise to figures 12(b) and (c) respectively. From the fitting parameters of figures 12(b) and (c) the NN information could be obtained. It is important to note that figures 12(a) and (b) represents phase uncorrected fitting, which means the peak position does not indicate the NN distance in absolute terms. Finding peak positions from the graph also leads to error due to the peak overlapping. Therefore the inter-atomic distances can only be found out from the fitting parameters alone. From the fitting parameters of figure 12(b) it was found that around uranium atom the first and second NN were Zr and U with their corresponding average inter-atomic distance of 2.87 and 3.02 Å respectively. From the fitting parameters of figure 12(c) it was found that around zirconium atom the first and second NN were Zr and U with their corresponding average inter-atomic distance of 2.97 and 3.16 Å respectively. It is interesting to note that average 1st NN distance around Zr is high and that around U atom is low and overall average 1st NN distance is 2.92 Å, which is comparable with the ideal 1st NN distance as per figure 12(a). Similar observation could be made for the 2nd NN; where the average 2nd NN distance around Zr is high and that around U atom is low and overall average 2nd NN distance comes as 3.08 Å which is exact match with figure 12(a).
Figure 12. (a) X-ray absorption spectra of U-50 wt.% Zr alloy. Dashed region is the part of the plot onto which EXAFS analysis was carried out. (b) Phase uncorrected fitted result (after Fourier transformation) around uranium atom with goodness of fit R-factor =0.004. The first and second NN was found to be Zr and U with their corresponding inter-atomic distance of 2.87 and 3.02 Å respectively. (c) Phase uncorrected fitted result (after Fourier transformation) around zirconium atom with goodness of fit R-factor =0.007. The first and second NN was found to be Zr and U with their corresponding inter-atomic distance of 2.97 and 3.16 Å respectively. (d) Crystal structure of UZr2 δ-phase (a = 3.08 Å, c = 5.03 Å) showing 1st, 2nd and 3rd NN distances. There are 3 nos. of 1st NN, 2 nos. of 2nd NN and 6 nos. of 3rd NN.
Download figure:
Standard image High-resolution image
Since, EXAFS data gives the average of the local environment around a given species of atom, therefore, it is not unusual to have non-integer coordination number. Around uranium atom the coordination no. for Zr and U was found to be 1.03 and 0.47 and around Zr atom the coordination no. of Zr and U was found to be 2.13 and 1.93, respectively. Adding up the coordination numbers of the first and second NN around U and Zr atom one gets 3.23 and 2.4, respectively. This coordination number is comparable with the crystal structure of UZr2 phase, as shown in figure 12(d). It is rather important to note that probability of finding Zr in the 1st NN distance from Zr is more than twice than that for finding U (2.13 vs 1.03); similarly probability of having 1st NN distance between Zr–Zr and U–Zr pairs are in the ratio of their average coordinate number; normalization of this ratio reveals having Zr–Zr NN is twice more likely than to have U–Zr NN in the UZr2 crystal structure. But, more important point is the absence of U–U pair as the 1st NN, which clearly indicate UZr2 crystal structure as an ordered structure. Hence the assumption of Akabori et al [2] that in all lattice sites the occupancy of U and Zr is in 1:2 ratio does not hold any longer, as predicted earlier [6].
4. Conclusion
Present study adopts a combination of (i) studies on the evolution of the δ-UZr2 phase during in-situ ageing of metastable U–Zr solid-solution (γ-phase, bcc structure), (ii) DFT calculations for estimating the ground state energies associated with the transient structures in the path of the displacive lattice collapse, necessary for bringing about the structural transition and (iii) an examination of the necessity of chemical ordering prior to the lattice collapse process. EXAFS measurements are deployed to ascertain the number and the nature of NNs around U and Zr atoms. Major findings of this study are as follows:
- (a)A novel Monte-Carlo based strategy is developed to generate random supercells to study β → ω displacive PT in A1−x Bx binary random alloy.
- (b)Structures generated with this strategy and using DFT calculations it is determined that (222)bcc plane collapse mechanism is energetically unfavorable in chemically disordered environment in UZr2 composition.
- (c)A 24 atom SQS structure (SQS-24) is derived which is a structural model of chemically ordered δ-UZr2 structure. The HSE06 calculated formation enthalpy of SQS-24 structure matches favorably with drop calorimetry measured value.
- (d)The 24 atom SQS structure (SQS-24) is mechanically and dynamically stable. Presence of pseudo-gap in DOS manifests a strong hybridization between U-5f and Zr-4d states. The bottom of the energy valley is present right at the Fermi energy signifying stability of the SQS-24 structure.
- (e)Chemical ordering is a precursor for the subsequent displacive transformation to form chemically ordered δ-UZr2 structure.
Finally, a thermodynamic basis for the mechanism of the γ to δ transformation have been established.
Acknowledgment
The authors wish to thank Dr R Tewari for several discussions and suggestions. The authors also wish to acknowledge the help and support of A C Bagchi in the experimental work.
Data availability statement
All data that support the findings of this study are included within the article (and any supplementary files).