

Abstract
We report detailed temperature-dependent inelastic neutron scattering and ab initio lattice dynamics investigation of magnetic perovskites YCrO3 and LaCrO3. The magnetic neutron scattering from the Cr ions exhibits significant changes with temperature and dominates at low momentum transfer regime. Ab initio calculations performed including magnetic interactions show that the effect of magnetic interactions is very significant on the low- as well as high-energy phonon modes. We have also shown that the inelastic neutron spectrum of YCrO3 mimics the magnon spectrum from a G-type antiferromagnetic system, which is consistent with previously reported magnetic structure in the compound. The pressure-dependent ab initio lattice dynamics calculations are used to calculate the anisotropic thermal expansion behaviour in orthorhombic YCrO3, which is in excellent agreement with the available experimental data in the paramagnetic phase. We identify that the low energy anharmonic phonon modes involving Y vibrations contribute maximum to the thermal expansion behaviour.
Export citation and abstract BibTeX RIS
1. Introduction
Materials with more than two switchable ferroic properties are of great interest due to potential use in four state memory devices. Materials that exhibit spontaneous ordering of magnetization, electric polarization and elastic strain are called multiferroics [1–7]. These materials find several technological applications such as refractory electrodes, thermistors, and thermoelectric materials. The coupling of the ferroelectric (FE) and ferromagnetic (FM) order parameters is particularly attractive if found in the same phase, both from fundamental science and technology point of view [8]. These compounds find use in spintronics and as data storage devices. It is interesting to note that most of the multiferroics, currently of interest are perovskite (ABO3) structured. These structures have a capacity to accommodate multitude of structural distortions and are able to incorporate almost every element. Ideal perovskite structure is a framework of corner sharing octahedra hosting B cations, while A cations are placed in the resulting dodecahedral sites. Structural instabilities of these biferroic oxides (ABO3) depend on the A cation size (with same B cation) and change in B cation. The effects of external parameters like temperature, pressure, chemical composition drive these distortions, which lead to several rich and unique physical properties. These physical properties are derived from tilt of BO6 octahedra, polar cation displacement leading to ferroelectricity, etc. Multiferroic materials with coupled FM and FE order parameters are promising for developing new generation of electrically and magnetically controlled multifunctional devices. A large number of studies on chromate based perovskites have been performed in recent years due to its rich physics and simple structures [7, 9–12].
There are two types of multiferroics: (i) the materials that exhibit magnetic ordering and FE ordering up to a very high temperature, but the ordering temperature as well as origin of ferroic properties are very different, hence coupling is very weak; (ii) on the other hand, there are compounds with the same ordering temperature and origin of FE and FM ordering with strong coupling, but unfortunately the transition temperature as well as the magnitude of electric dipole moments are very small [13, 14]. Hence, across the globe intense research is going on to achieve both the requirement of strong coupling as well as high transition temperature.
The compounds RCrO3 (R = Y, La) are magnetic but do not exhibit ferroelectricity in pure single phase. However, mixing them together results in enhanced FE properties [12, 15–22]. The mixing leads to strain, which could cause the strain mediated ferroelectricity in the mixed phase. Thermal expansion could also act as a source of strain in the mixed compound. Hence, it is important to understand the thermal expansion behaviour and its anisotropy that would be useful to design the multiferroic material in future.
RCrO3 (R = Y, La) are found in orthorhombic structure (space group Pnma) at ambient condition (figure 1). With respect to the ideal cubic perovskite structure (space group Pm-3m), this orthorhombic phase is obtained by an anti-phase tilt of adjacent CrO6 octahedra; the R cations is usually in eight coordination (figure 1). Although Pbnm is a centrosymmetric space-group and non-compatible to ferroelectricity, but local non-centrosymmetric nano regions give rise to ferroelectricity in YCrO3 [18, 22–25]. Previous work on YCrO3 indicated [26] that it is ferrimagnet with weak ferromagnetism (TN ∼ 140 K). Subsequently it has been shown that YCrO3 exhibits [17] canted antiferromagnetic behaviour below 140 K and a FE transition around 473 K. More recent x-ray and neutron powder diffraction, and Mössbauer spectroscopy measurements on YCrO3 also indicate [27] that it is antiferromagnetic and the direction of the moment on Cr3+ ion is along the c-axis. LaCrO3 is also reported [27, 28] to be G-type antiferromagnetic, and the direction of the magnetic moment is found along [28] the crystallographic a-axis. The magnetism in both the compounds, LaCrO3 and YCrO3, is attributed to Cr d-orbital electrons, and so, one might expect similar magnetic behaviour in both the compounds. However, the different sizes of La and Y atoms in the two compounds may alter the wave function overlap or effective interaction between electrons in Cr d-orbitals and electrons from other elements, which may affect the direction and magnitude of the orbital moments.
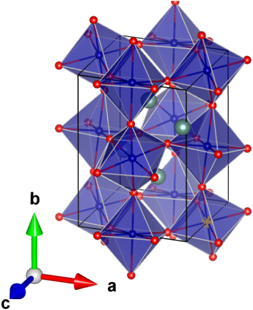
Figure 1. The structure of orthorhombic RCrO3 (R = Y, La). Key: Y/La—silver, Cr—blue and O—red.
Download figure:
Standard image High-resolution imageFerroelectricity is absent in LaCrO3 due to the large size of La3+ ion which might prevent some structural instability necessary for FE transition (in comparison to Y3+). In order to understand the structural instabilities in these oxides, several theoretical and experimental studies have been carried out. Understanding the driving force behind FE instability in oxides like LaCrO3 has warranted several electronic structure studies, and experimental Raman studies [8, 19–21, 29–31]. Understanding the correlation between individual phonon modes and structural distortions, make interesting ongoing studies. Temperature dependence of Raman measurements [32] on YCrO3 show that the A1g and B2g Raman active modes about ∼560 cm−1 undergo significant changes across the magnetic transition temperature. Therefore, these modes are likely to show strong coupling with magnetic ordering. There have been studies to understand the changes in the physical properties of YCrO3 with doping; it is found that its electrical conductivity increased with Ca-doping. High pressure synchrotron powder diffraction experiments have been carried on YCrO3 up to 60 GPa to study its evolution with increasing pressure [33]. High resolution neutron diffraction studies have been reported to understand the average and local structure in YCrO3 in order to explain the electric polarization seen above 430 K despite the centrosymmetric phase [18].
In this paper, we report neutron inelastic scattering measurements over a wide range of momentum transfers, which enables to separately identify the contributions from magnetic excitations (at low momentum transfers) and phonons (at high momentum transfers). The neutron measurements have been performed as a function of temperature, which reveal significant changes across the magnetic phase transition; however, the magnetic scattering persists in the paramagnetic phase due to paramagnetic relaxations. We have also performed extensive ab initio calculations of the phonon spectra and identified the effect of magnetism. Further, we use the ab initio calculations to derive the anisotropic elasticity and the thermal expansion, including the negative thermal expansion along the a-axis of the orthorhombic structure. The results are in very good agreement with the available data. The theory helps to identify the anharmonic phonon modes behind the anomalous thermal expansion behaviour.
2. Experimental details
Polycrystalline samples of LaCrO3 and YCrO3 were prepared by solid state reaction method. The inelastic neutron scattering (INS) measurements were carried out using the high-flux time-of-flight (IN4C) spectrometer at the Institut Laue Langevin (ILL), France, covering a wide range of scattering angles from 10° to 110°. Thermal neutrons of wavelength 2.4 Å (14.2 meV) are used for the measurements. The scattering function S(Q, E) is measured in the neutron energy gain mode with a momentum transfer, Q, extending up to 7 Å−1. About 10 g of polycrystalline sample has been used for the measurements over 100–550 K. The polycrystalline sample was put inside a cylindrical niobium sample holder and mounted in a cryoloop. The data analysis was performed by averaging the data collected over the angular range of scattering using ILL software tools [34] to get neutron cross-section weighted phonon densities of states. The phonon density of states g(n)(E) in the incoherent [35, 36] one-phonon approximation is extracted from the measured dynamical structure factor S(Q, E) as follows


where ![$n\left(E,T\right)={\left[\mathrm{exp}\left(E/{\mathrm{k}}_{\mathrm{B}}\mathrm{T}\right)-1\right]}^{-1}$](https://content.cld.iop.org/journals/0953-8984/32/50/505402/revision3/cmabb547ieqn1.gif) , ± represents energy gained/lost by the neutron. bk
, mk
and gk
(E) are, respectively, the neutron scattering length, mass, and partial density of states of the kth atom in the unit cell. 'A' and 'B' are normalization constants. 2W(Q) is the Debye–Waller factor, which is set to zero. The weighting factors
, ± represents energy gained/lost by the neutron. bk
, mk
and gk
(E) are, respectively, the neutron scattering length, mass, and partial density of states of the kth atom in the unit cell. 'A' and 'B' are normalization constants. 2W(Q) is the Debye–Waller factor, which is set to zero. The weighting factors  for various atoms in the units of barns/amu are: 0.0866, 0.0695, 0.0671 and 0.2645 for Y, La, Cr and O respectively. The values of neutron scattering lengths for various atoms can be found from reference [37].
3. Computational details
All the calculations were performed using Vienna based ab initio simulation package (VASP) [38, 39]. We have used the projected augmented wave flavor of pseudo potential within generalized gradient approximation (GGA) parameterization by Perdew, Burke and Ernzerhof [40, 41]. A kinetic energy cutoff of 900 eV for the plane wave pseudo potentials is used. The 6 × 4 × 6 k-point mesh generated using Monkhorst–Pack method [42] were used to integrate the Brillouin zone. A convergence criterion of 10−8 eV and 10−5 eV Å−1 were chosen for total energy and ionic forces, respectively. These parameters ensured to achieve convergence of less than 0.1 meV in total energy, which is essential for precise calculation of phonons. The phonon calculations (the dispersion curves and density of states) were performed using finite displacement method implemented in PHONON software [43]. The 17 distinct atomic configurations resulting from symmetrical displacements of the inequivalent atoms along the three Cartesian directions (±x, ±y and ±z) are used to generate the force constant matrices. The calculated structures (table 1) of LaCrO3 and YCrO3 agree well with the available experimental data.
Table 1. The calculated (this work) and experimental structures [27, 28] in the orthorhombic phase (space group Pnma) of RCrO3 (R = Y, La). The experimental values of the magnetic moment for YCrO3 and LaCrO3 are from reference [27, 52] respectively.
| LaCrO3 | YCrO3 | |||||||||
|---|---|---|---|---|---|---|---|---|---|---|
| Magnetic | Magnetic | |||||||||
| moment | moment | |||||||||
| a (Å) | b (Å) | c (Å) | V (Å3) | (μB) | a (Å) | b (Å) | c (Å) | V (Å3) | (μB) | |
| Expt. | 5.4813 | 7.7611 | 5.5181 | 234.81 | 3.0 | 5.524 | 7.529 | 5.238 | 217.90 | 2.66 |
| GGA (non-magnetic) | 5.764 | 7.632 | 5.515 | 242.6 | 5.761 | 7.420 | 5.238 | 223.9 | ||
| GGA (collinear magnetic) | 5.611 | 7.890 | 5.567 | 246.4 | 3.0 | 5.617 | 7.674 | 5.323 | 229.4 | 3.0 |
| GGA (non-collinear magnetic, | 5.580 | 7.592 | 5.274 | 223.4 | 2.7 | |||||
| moment along a-axis) | ||||||||||
The thermodynamic and transport properties of material with magnetic ions also contributed significantly by magnetic interaction between these ions. These additional magnetic interactions between controls translational and rotational flexibility of atoms in the crystal, hence, control the dynamics of the material. In addition to that the associated spins of the magnetic ions form collective spin excitation known as magnons in magnetic ordered phase. While in the paramagnetic phase they do contribute in the free energy in the form of spin configurational entropy. Hence to understand the effect of magnetic interaction on thermodynamics properties, it is important to include the magnetic interaction in the system. The standard DFT formalism allows the inclusion of magnetic interaction in two ways, the collinear spin polarized magnetic calculation where the spin is considered as a one-dimensional variable and the Hamiltonian in rotationally invariant with respect to lattice. The other way to include the magnetic interaction is known as noncollinear spin polarized calculation, this is very computationally expensive method and the spin is treated as a three-dimensional object.
Both the compounds YCrO3 and LaCrO3 are reported [27, 28] to be G-type antiferromagnetic. The structure relaxation for both the compounds was performed in the non-magnetic as well as magnetic configurations. For LaCrO3, on-site Hubbard correction is applied within the Dudarev approach [44] using Ueff = U − J = 4.3 eV [45]. The authors of reference [45] observed that for Ueff = 4.3 eV the calculated electronic bandgap is very close to the reported experimental value. The same value of Ueff has been used in the calculations of YCrO3. Another ab initio calculation [46] on LaCrO3 used Ueff = 3.8 eV, which is close to that from reference [45]. For YCrO3, we have performed the phonon calculation considering the G-type magnetic configuration using a non-collinear calculation (moment along a-axis) and another collinear calculation. Dzyaloshinskii–Moriya interaction [47] is taken care in our non-collinear calculation by including the spin–orbital interaction. We did not achieve the required convergence in the phonon calculations with the non-collinear magnetic configuration with moments along the c-axis. As discussed below, the calculations show that the change in magnetic moment configuration does not result in significant changes in the overall phonon density of states. However, we have seen that for some zone center modes their energy changes significantly (∼5%) due to change in the magnetic moment configuration. For LaCrO3, we have performed only the collinear calculation. The non-collinear calculation does not converge for required accuracy for phonon calculation, hence we have not performed the non-collinear phonon calculation for LaCrO3.
We have also used the density functional perturbation theory (DFPT) method for calculation of the zone-center modes for making a comparison with the supercell method, and in particular, to justify the supercell size for accurate phonon calculation. DFPT method does not depend on a supercell. In DFPT we compute the dynamical matrices on a finite wave-vector (q) grid and then use those dynamical matrices to get the phonon frequencies at intermediate q-points using an interpolation scheme, which we believe may introduce the same level of error as the supercell scheme. Further, the DFPT calculation will have convergence issue especially with non-collinear calculation, hence we have opted for the supercell scheme for calculation of phonon modes in the entire Brillouin zone. We have used the DFPT method as implemented in VASP package (VASP-5.2) to obtain the zone-center phonon modes for the collinear cases of YCrO3 and LaCrO3.
Thermal expansion behaviour of any material is an important thermodynamic property essential for material design for specific application. Here, we have computed the linear thermal expansion behaviour in both the compounds using quasi-harmonic approximation that has been found useful in many similar compounds. The thermal expansion calculation is done using pressure dependence of phonon frequencies in the entire Brillouin zone [48]. Each phonon mode of energy E q j (jth phonon mode at wavevector q in the Brillouin zone) contributes to the thermal expansion coefficient, which is given by the following relation for an orthorhombic system [49]:
where sij are elements of the elastic compliance matrix, s = C−1 at 0 K (C is the elastic constant matrix), V0 is volume at 0 K and CV (q, j, T) is the specific heat at constant volume due to jth phonon mode at point q in the Brillouin zone. The mode Grüneisen parameter of phonon energy E q ,j is given as [50],

The volume thermal expansion coefficient for an orthorhombic system is given by:

The elastic constants (Cij ) and elastic compliance matrix elements (sij ) are given in table 3. The elastic compliances show negative values of some components, which implies that elongation along one axis leads to contraction to the conjugate axis.
As described above, the distribution of phonon energies averaged over Brillouin zone does not show significant change with magnetic configuration; hence, we do expect that the thermodynamic quantities, which are functional of phonon density of states, might not change significantly with magnetic orientation.
We have performed the magnon simulation using the Heisenberg spin Hamiltonian
where Jij is the magnetic exchange interaction between spins at site i and j respectively. The magnetic Hamiltonian is solved by considering the magnetic exchange interaction up to second neighbors using spinw software [51].
4. Results and discussion
4.1. Temperature dependence of phonon spectra
We have measured the INS spectra of YCrO3 and LaCrO3 (figure 2) up to 550 K. The temperature range of measurements includes the magnetic transition in both the compounds (TN (YCrO3) [27] ∼140 K and TN (LaCrO3) [52] ∼291 K). Since both the compounds are magnetic, the INS data contain both phonon and magnetic contributions. The magnetic contribution in the INS spectrum is of two kinds, one is due to well-defined magnon excitations that dominates below the magnetic transition temperature, and other is the quasielastic scattering from paramagnetically rotating spins that dominates above the transition temperature. It is known that the magnetic contribution to the INS spectrum dominates at low momentum transfers (Q) due to the magnetic form factor. Therefore, two Q-domains were considered; i.e., high-Q (4–7 Å−1) and low-Q (1–4 Å−1) in order to extract the magnetic contribution in the INS data at low-Q and the phonon contribution at high-Q.
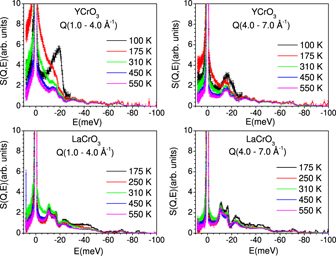
Figure 2. Temperature-dependent INS spectra of RCrO3 (R = Y, La). Top panel: the low-Q and high-Q Bose-factor corrected S(Q, E), where both the energy loss (0–10 meV) and the energy gain (−100 to 0 meV) sides are shown. The horizontal axis gives the neutron energy transfer (E = Ei − Ef; Ei and Ef being the incident and scattered neutron energies) in the neutron inelastic scattering spectra, and so the negative values correspond to the neutron energy gain.
Download figure:
Standard image High-resolution imageThe temperature dependence of the Bose-factor corrected S(Q, E) plots of YCrO3 and LaCrO3 are shown in figure 2. At low temperatures (up to 315 K), the low-Q data show a larger elastic line as compared to the high-Q data. We could see that the energy spectrum close to the elastic line is also very sensitive to Q, i.e. at lower Q (1–4 Å−1), there is larger intensity in the low energy spectrum and at higher momentum transfer (Q ∼ 4–7 Å−1), it reduces significantly. As noted above, the magnetic signal is more pronounced at low Q, and vanishes at higher Q, following the magnetic form factor. We speculate that this quasi-elastic scattering originates from paramagnetic spin fluctuations.
The low-Q inelastic spectrum in YCrO3 shows significant intensity at energy around 20 meV at 100 K (below magnetic transition temperature TN ∼ 140 K), which decays rapidly above TN . This indicates that there is significant contribution by magnon excitations at about 20 meV. Further, the intensity around zero energy is contributed by paramagnetic scattering of neutrons by Cr ions. The inelastic spectrum averaged over high Q does not show any prominent change with temperature. However, in case of LaCrO3, we do not observe any significant difference between the low- and high-Q data at 175 K (TN ∼ 291 K) (figure 2), and so, the contribution from the magnetic excitations seems to be insignificant.
Our INS data on polycrystalline sample of LaCrO3 are insufficient to extract the magnon contribution quantitatively. Hence, we could not perform any modeling to derive inferences about the magnetic interaction, which could be better obtained from magnon dispersion data from single crystal measurements. To explain the major differences in the measured low-energy INS spectrum at low-Q, we have performed magnon dispersion simulation using spinw software [51]. We have assumed the G-type AFM structure of both the compounds. The magnetic exchange interaction parameters (J values) between various Cr3+ atoms are taken from available literature [53, 54]. The J1 value for YCrO3 (J1 = −1.685 meV and J2 = −0.428 meV) [53] is much smaller in comparison to that for LaCrO3 (J1 = −8.8 meV and J2 = −0.38 meV) [54]. The large difference between the exchange parameters is also reflected in the difference in their TN values, which are ∼140 K for YCrO3 [27] and ∼291 K for LaCrO3 [52]. The calculated magnon dispersion relation using these parameters are shown in figure 3(a). The calculations show a flat magnon branch at ∼10 meV and ∼90 meV in YCrO3 and LaCrO3 respectively, which will contribute a large magnon density of states and show up in INS measurements at 10 meV and 90 meV respectively. Our INS measurements of YCrO3 at low-Q show (figure 2) a prominent peak at energy around ∼20 meV at 100 K (below the magnetic transition), which is qualitatively consistent with the above theoretical prediction of large magnon contribution in YCrO3 (figure 3(a)). However, for LaCrO3 the predicted peak magnon contribution at 90 meV. Such high energy excitations cannot be observed at low Q values, and would require a very high Q value of about 7 Å−1. The magnetic form factor falls rapidly at higher momentum transfer. As shown in figure 3(c), the magnetic form factor for Cr3+ at 7 Å−1 falls to 6%, which makes it difficult for magnons to be seen in the INS experiments performed using a polycrystalline sample. This might be the reason that in LaCrO3, we do not see significant variation in the low-Q intensity in the spectra across the magnetic transition as we do see in YCrO3.
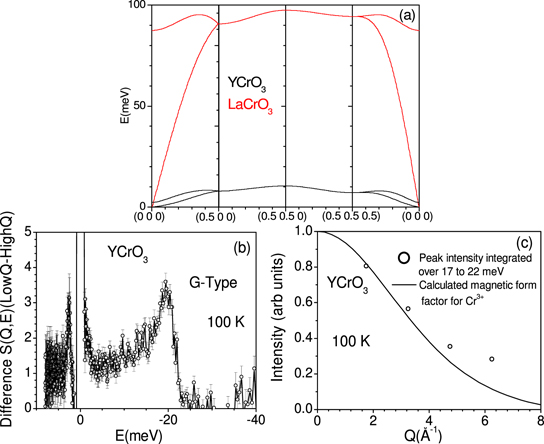
Figure 3. (a) The calculated magnon dispersion relation of YCrO3 and LaCrO3. (b) Extracted magnetic contributions (intensity difference between low-Q and high-Q) in neutron inelastic spectra of YCrO3 at temperatures below TN from polycrystalline samples. (c) The variation of integrated intensity of the excitation for YCrO3 (energy range = 17–22 meV) with wave-vector Q. The magnetic form factor for Cr3+ is computed using the analytical relation and shown as a continuous line. The experimental intensity is scaling by a constant factor for comparison with the calculations.
Download figure:
Standard image High-resolution imageAs mentioned above, the neutron inelastic scattering spectrum from powder sample contains rich information of dynamics of atoms from the entire Brillouin zone. For magnetic systems, it also contains the magnon density of states. McQueeney et al [55] have shown that the information of magnetic structure is embedded in magnon density of states and can be extracted from the powder neutron inelastic scattering data. Using the Heisenberg Hamiltonian, the authors derive the magnon dispersion relation and show that for different magnetic structure, the magnon density of states exhibits distinct features in the von Hove singularities irrespective of the magnetic exchange interaction strength. For, a three-dimension FM (F-type) cubic perovskite, the magnon density of states shows five von-Hove singularities contributed by different high symmetry zone boundary modes. The A-type antiferromagnetic cubic perovskite will have many von-Hove singularities, while the C-type AFM structure will have only three von Hove singularity features in magnon density of states. The authors found that the G-type magnon density of states show very distinct magnon density of states and it contains only one cusp like singularity near the maximum magnon energy.
In the inelastic experiment, we measure the dynamical structure factor S(Q, E), which contains the information of both the magnon and phonon density of states. Hence, the dynamical structure factor contributed from the magnon dynamics would also exhibit distinct von-Hove singularities as described above. To probe these features in our inelastic neutron spectrum, we have further processed our data to extract the magnon structure factor Smag(Q, E) by subtracting the high-Q inelastic neutron spectrum from the low-Q inelastic spectrum. We obtained the Smag(Q, E) for YCrO3 (figure 3(b)). The magnon dynamical structure factor consists of one von Hove singularity at around ∼20 meV energy, which is a strong signature of the G-type AFM structure. The conclusion that YCrO3 compound establishes a G-type AFM is based on the shape of the magnon peak. McQueeney et al [55] showed that the information of magnetic structure is embedded in magnon density of states and may be extracted from the powder neutron inelastic scattering data. This result supplements the previous diffraction observation [27] and justifies our calculation with the G-type AFM structure.
Here, our aim was to describe the richness of the information contained in the INS spectrum, which can be further utilized to characterize the material properties. In order to confirm that the peak observed at around 20 meV in Smag(Q, E) has magnetic origin and hence should follow the magnetic form factor of associated magnetic ion, we have plotted (figure 3(c)). This figure gives the integrated intensity in the Smag(Q, E) over 17–22 meV as a function of momentum transfer from 1–7 Å−1. We have also calculated the Q dependence of magnetic form factor of Cr+3 using analytical method [56] and compared it with the variation of the integrated peak intensity (Smag(Q, E)) with Q. We found a very good agreement between the two, which unambiguously confirms that the peak ∼20 meV in Smag(Q, E) is contributed by magnetic excitation (magnons).
Further, the spectra derived from S(Q, E) data using equation (2), within the incoherent approximation in both the Q regimes, are shown in figure 4. We find that for both the compound the low-Q data show large variation in the intensity as a function of temperature. However, for the high-Q data we do not observe any significant change in the spectra except at the lowest temperature. Further, in the low-Q data of YCrO3 at 100 K, which is below the magnetic transition temperature (∼140 K), there is a large intensity of the low energy inelastic spectra (∼20 meV) as compared to the data collected at higher temperatures. This is expected to be due to a strong magnetic signal. At 175 K, it is found that there is considerable decrease of the intensity of the low energy peaks around 20 meV indicating loss of the magnetic signal.
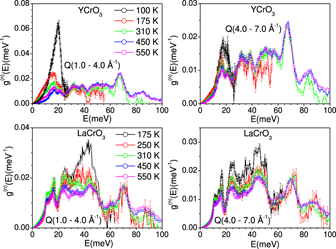
Figure 4. Temperature-dependent neutron inelastic scattering spectra of RCrO3 (R = Y, La). The low-Q and high-Q, unity-normalized, excitation spectra, g(n)(E), inferred from the neutron energy gain S(Q, E) data, within the incoherent approximation.
Download figure:
Standard image High-resolution image4.2. Magnetic ordering and calculated phonon spectra
We have calculated the relaxed structure for both the compounds in the non-magnetic as well as magnetic configurations, and the results are given in table 1. Without the magnetism the a-lattice constant is significantly overestimated by about 5%. We find that the magnetism substantially reduces the overestimate to about 2%. Further, in order to see the effect of the direction of magnetic moment on the structure we performed both collinear and non-collinear calculations (moment along a-axis) for YCrO3. We find that the relaxed lattice parameters are quite similar in the two cases and differ from the experiments by about 2% (table 1), which is acceptable in standard DFT calculation. The calculated magnetic moment of Cr ion in both the compounds is found to be 3.0 μB, which is due to the fact that Cr atom occurs in +3 ionic states in the compounds and all the remaining d3 electron occupy the t3g orbital.
It may be noted that above the magnetic transition temperature the compounds become paramagnetic, where the magnetic ordering is lost which results in marginally reduced effective interaction between magnetic ions. Hence, in order to reproduce the phonon spectrum in paramagnetic phase we cannot use nonmagnetic calculation (magnetic moment of Cr = 0 μB, which is equivalent to magnetic quenching). The calculation of phonon spectrum in paramagnetic phase can be obtained by calculating the phonon spectrum over a large set of randomly oriented spin configurations which is not a feasible option but may be in near future one can use machine learning methods to achieve the same. However, in the present case, we can estimate the changes in the phonon spectrum between few magnetic configurations and can have a sense of change in phonon energies across the magnetic transition and this could be useful to identify modes which may show strong spin–phonon coupling.
The calculated partial density of states of various atoms in collinear and noncollinear magnetic configuration for YCrO3 are shown in figure 5. It may be noted that the low energy phonon spectrum below 20 meV does not show any change, while small changes are observed at higher energies (above 45 meV) that are mostly contributed by chromium and oxygen atoms. This can be understood from the fact that the magnetic interaction between chromium atoms are mediated by oxygens and change in the direction and magnitude of magnetic moment will affect the Cr–O bond length and O–Cr–O bond angle, and hence the phonons. It has been reported that the Raman modes [32] in YCrO3 around ∼560 cm−1 (∼70 meV) show significant changes across the magnetic transition temperature, and therefore are expected to be influenced by magnetic interactions, which is consistent with the above ab initio results.
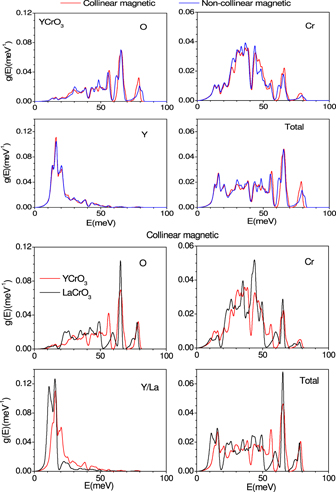
Figure 5. The calculated atomic partial phonon density of states (Y/La, Cr and O) in the orthorhombic phase of RCrO3 (R = Y, La). The magnetic moment on the Cr atoms in the non-collinear calculations is along the a-axis.
Download figure:
Standard image High-resolution imageThe phonon density of states of LaCrO3 and YCrO3 differ significantly (figure 5) below 50 meV, which are dominated by Y and La dynamics. The differences are mainly attributed to difference in various bond lengths and strengths in both the compounds. However, the high energy phonon modes above 50 meV, which mainly arise from Cr–O stretching, do not change much since in the both the compound the Cr–O bond length is nearly same.
4.3. Experimental and calculated phonon spectra
We compare in figure 6 the INS measurements at T = 310 K with phonon calculations that includes the magnetic interaction (spin polarized phonon calculation). The phonon density of states obtained from measurements is neutron weighted. Hence, in order to compare with the data, we have done the neutron weighting of the calculated phonon data using equation (2). The calculated phonon density of states for YCrO3 shows good agreement with the measurements. We observe slightly underestimated phonon energies with respect to measurements. That could be understood better in terms of overestimated lattice parameters or under-binding effect of GGA exchange correlation function in DFT approach. In case of LaCrO3, the calculated phonon density of states is found to be in good agreement with the neutron data below 55 meV, while there is significant underestimation of high energy phonon density of states. The significant underestimation of high energy modes might be attributed to strong correlation effect of La deep-d orbital electrons, which is not very well accounted in DFT methods. However, qualitatively overall spectrum matches very well with the measurements.
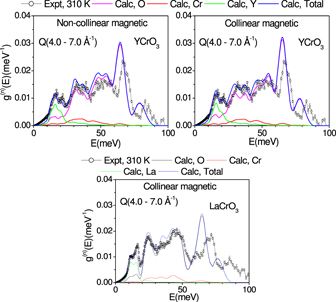
Figure 6. The calculated and experimental neutron inelastic scattering spectra of RCrO3 (R = Y, La). The magnetic moment on the Cr atoms in the non-collinear calculations is along the a-axis.
Download figure:
Standard image High-resolution imageFurther, we have shown (figure 6) the contribution of individual atoms to the neutron inelastic scattering spectrum. We found that for both the compounds the contribution from oxygen atoms is dominated across the entire spectral range. The Cr and R (=Y, La) atomic dynamics are significantly contributed in the spectrum below 70 meV and 30 meV respectively.
4.4. Magnetic ordering and calculated zone-center phonon modes
The phonon density of states is an integrated spectrum of phonons in the entire Brillouin zone. To give a sense of quantitative changes in specific phonon modes due to collinear and non-collinear magnetic configuration in YCrO3, we have shown the calculated zone-center phonon frequencies in table 2 and figure 7 in the G-type magnetic configuration in two type of calculations, i.e., non-collinear vs collinear. Group theoretical analysis of Pnma symmetry of RCO3 (R = Y, La) shows that at zone-center the total of 60 normal modes can be classified as follows:

Table 2. Calculated energies (in meV units) of the zone-center phonon modes of YCrO3. Experimental data of YCrO3 and LaCrO3 are from references [20, 25, 57, 58] respectively.
| YCrO3 | LaCrO3 | |||||||||
|---|---|---|---|---|---|---|---|---|---|---|
| Supercell | ||||||||||
| scheme, non | ||||||||||
| -collinear | Supercell | |||||||||
| scheme, | Supercell | DFPT, | scheme | DFPT, | ||||||
| Mode | Irreducible | (moment along | collinear | collinear | Irreducible | collinear | collinear | |||
| number | representation | Expt | a-axis) | magnetic | % change | magnetic | representations | Expt | magnetic | magnetic |
| 1 | Ag | 19.1 | 17.5 | 17.7 | −1.4 | 17.7 | Ag | 10.9 | 11.0 | |
| 2 | Ag | 23.2 | 21.2 | 20.5 | 3.3 | 20.5 | Ag | 12.9 | 15.5 | 15.6 |
| 3 | Ag | 35.4 | 33.4 | 33.0 | 1.3 | 33.0 | Ag | 21.7 | 23.0 | 23.1 |
| 4 | Ag | 43.1 | 40.8 | 40.1 | 1.6 | 40.2 | Ag | 31.8 | 32.1 | 32.0 |
| 5 | Ag | 53.5 | 49.6 | 50.6 | −2.0 | 50.6 | Ag | 34.1 | 37.4 | 37.4 |
| 6 | Ag | 61.9 | 57.6 | 57.4 | 0.4 | 57.4 | Ag | 54.5 | 50.4 | 50.4 |
| 7 | Ag | 71.3 | 66.3 | 65.3 | 1.5 | 65.3 | Ag | 65.1 | 65.2 | |
| 8 | Au | 12. | 12.7 | −2.7 | 12.7 | Au | 10.5 | 10.6 | ||
| 9 | Au | 22.6 | 22.8 | −0.7 | 22.8 | Au | 22.1 | 22.1 | ||
| 10 | Au | 29.8 | 30.4 | −1.9 | 30.4 | Au | 30.7 | 30.7 | ||
| 11 | Au | 34.9 | 34.2 | 1.9 | 34.2 | Au | 34.5 | 34.6 | ||
| 12 | Au | 43.2 | 44.4 | −2.8 | 44.4 | Au | 43.8 | 43.8 | ||
| 13 | Au | 49.3 | 52.1 | −5.4 | 52.1 | Au | 46.1 | 46.1 | ||
| 14 | Au | 61.8 | 64.6 | −4.3 | 64.6 | Au | 64.5 | 64.4 | ||
| 15 | Au | 64.2 | 66.5 | −3.5 | 66.5 | Au | 65.5 | 65.5 | ||
| 16 | B1g | 22.0 | 19.7 | 11.4 | 19.8 | B1g | 18.8 | 18.9 | ||
| 17 | B1g | 33.7 | 31.6 | 30.2 | 4.6 | 30.3 | B1g | 19.6 | 19.7 | |
| 18 | B1g | 51.3 | 47.4 | 47.2 | 0.5 | 47.2 | B1g | 40.4 | 40.5 | |
| 19 | B1g | 69.7 | 65.3 | 63.9 | 2.2 | 63.9 | B1g | 64.6 | 64.7 | |
| 20 | B1g | 78.0 | 76.2 | 2.3 | 76.4 | B1g | 89.0 | 74.7 | 74.9 | |
| 21 | B1u | 0.0 | 0.0 | 0.0 | B1u | 0.0 | 0.0 | |||
| 22 | B1u | 19.8 | 20.3 | −2.6 | 20.3 | B1u | 15.5 | 15.5 | ||
| 23 | B1u | 24.0 | 23.9 | 0.4 | 23.9 | B1u | 24.4 | 20.3 | 20.3 | |
| 24 | B1u | 39.0 | 39.0 | 0.0 | 39.0 | B1u | 32.5 | 32.4 | ||
| 25 | B1u | 40.0 | 40.3 | −0.8 | 40.3 | B1u | 36.5 | 36.5 | ||
| 26 | B1u | 44.5 | 45.0 | −1.2 | 45.0 | B1u | 43.8 | 43.8 | ||
| 27 | B1u | 50.7 | 51.7 | −1.9 | 51.7 | B1u | 47.5 | 47.4 | ||
| 28 | B1u | 55.5 | 56.5 | −1.9 | 56.6 | B1u | 55.3 | 48.9 | 48.9 | |
| 29 | B1u | 60.8 | 62.5 | −2.7 | 62.5 | B1u | 71.1 | 52.4 | 52.4 | |
| 30 | B1u | 65.3 | 68.4 | −4.5 | 68.4 | B1u | 83.1 | 66.6 | 66.7 | |
| 31 | B2g | 16.9 | 17.2 | −1.9 | 17.2 | B2g | 15.5 | 12.5 | 12.5 | |
| 32 | B2g | 27.7 | 25.6 | 25.7 | −0.6 | 25.7 | B2g | 18.7 | 17.4 | 17.4 |
| 33 | B2g | 39.8 | 37.4 | 37.9 | −1.2 | 37.9 | B2g | 22.8 | 22.7 | |
| 34 | B2g | 45.4 | 44.5 | 2.0 | 44.6 | B2g | 43.4 | 40.5 | 40.4 | |
| 35 | B2g | 63.2 | 58.0 | 58.5 | −0.9 | 58.5 | B2g | 50.4 | 47.9 | 47.9 |
| 36 | B2g | 63.1 | 64.0 | −1.5 | 64.0 | B2g | 58.2 | 58.3 | ||
| 37 | B2g | 76.6 | 78.6 | −2.5 | 78.7 | B2g | 77.8 | 78.0 | ||
| 38 | B2u | 0.0 | 0.0 | 0.0 | B2u | 0.0 | 0.0 | |||
| 39 | B2u | 22.1 | 20.7 | 6.9 | 20.7 | B2u | 17.1 | 19.4 | 19.4 | |
| 40 | B2u | 24.5 | 25.0 | −2.0 | 25.0 | B2u | 23.0 | 23.0 | ||
| 41 | B2u | 41.0 | 41.1 | −0.3 | 41.1 | B2u | 33.0 | 40.3 | 40.4 | |
| 42 | B2u | 42.5 | 44.1 | −3.8 | 44.2 | B2u | 41.2 | 43.6 | 43.7 | |
| 43 | B2u | 51.3 | 53.9 | −4.8 | 53.9 | B2u | 44.3 | 47.8 | 47.8 | |
| 44 | B2u | 59.9 | 63.4 | −5.4 | 63.4 | B2u | 64.0 | 64.0 | ||
| 45 | B2u | 65.4 | 66.5 | −1.7 | 66.5 | B2u | 65.7 | 65.6 | ||
| 46 | B3g | 21.8 | 20.0 | 18.9 | 5.7 | 18.9 | B3g | 17.9 | 16.3 | 16.3 |
| 47 | B3g | 38.5 | 37.7 | 2.0 | 37.7 | B3g | 35.4 | 35.5 | ||
| 48 | B3g | 60.9 | 55.4 | 55.9 | −0.9 | 56.0 | B3g | 52.7 | 49.4 | 49.4 |
| 49 | B3g | 66.0 | 64.4 | 2.3 | 64.5 | B3g | 64.7 | 64.7 | ||
| 50 | B3g | 81.4 | 76.5 | 6.5 | 76.5 | B3g | 73.2 | 76.3 | 76.6 | |
| 51 | B3u | 0.0 | 0.0 | 0.0 | B3u | 0.0 | 0.0 | |||
| 52 | B3u | 18.0 | 18.3 | −1.6 | 18.3 | B3u | 15.4 | 15.5 | ||
| 53 | B3u | 27.5 | 28.0 | −1.6 | 28.0 | B3u | 20.6 | 20.4 | 20.4 | |
| 54 | B3u | 33.3 | 33.8 | −1.6 | 33.8 | B3u | 30.0 | 31.6 | 31.6 | |
| 55 | B3u | 38.9 | 39.0 | −0.3 | 39.0 | B3u | 35.7 | 35.7 | ||
| 56 | B3u | 44.9 | 45.3 | −0.9 | 45.3 | B3u | 47.3 | 39.1 | 39.1 | |
| 57 | B3u | 47.4 | 48.5 | −2.4 | 48.5 | B3u | 52.7 | 43.4 | 43.4 | |
| 58 | B3u | 57.1 | 58.6 | −2.5 | 58.5 | B3u | 58.4 | 52.3 | 52.3 | |
| 59 | B3u | 62.6 | 65.4 | −4.3 | 65.4 | B3u | 61.2 | 62.8 | 62.8 | |
| 60 | B3u | 66.3 | 67.3 | −1.5 | 67.3 | B3u | 75.2 | 64.5 | 64.5 | |
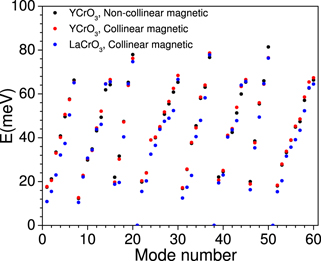
Figure 7. The calculated zone-center frequencies in collinear and noncollinear magnetic configurations in YCrO3 and in collinear magnetic configuration in LaCrO3. The magnetic moment on the Cr atoms in the non-collinear calculations is along the a-axis. The mode number corresponds to that given in table 2.
Download figure:
Standard image High-resolution imageHere, we have 24 Raman active modes and 36 are infrared active. One may note that a few zone-center phonon modes show significant change with magnetic configuration, indicating that these modes exhibit strong spin–phonon coupling. We find that most of the zone-center modes in YCrO3 above 45 meV show significantly change in phonon energies (∼5%) between non-collinear and collinear calculations. This also reflects strongly in the density of states calculations shown in figure 5. Further, we have shown the calculated zone-center phonon modes of LaCrO3 in table 2. We may observe that most of the zone-center phonon modes in LaCrO3 are lower in energy than that in YCrO3, which might be due to larger La mass and weaker bonding between La and O. Experimental data of the zone-center modes for YCrO3 and LaCrO3 available from references [20, 25, 57, 58] respectively, are in fair agreement with our ab initio calculations. We have used both the supercell scheme and DFPT method for calculation of the zone-center modes. The DFPT calculation for collinear cases of YCrO3 and LaCrO3 are found to be in excellent agreement with that using the supercell scheme (table 2).
In figure 8, we have shown the eigenvectors of some of the representative modes in YCrO3, which show significant change in phonon energy with magnetic configurations. The most striking feature of these modes is that these modes are mainly dominated by oxygen dynamics. The dynamics of oxygen will cause variations in the O–Cr bond and O–Cr–O bond angle, which are critical for antiferromagnetic interaction. Hence, different types of magnetic configurations result in difference in strength of the force constants for these bonds and bond angles, which in turn reflect in changes in the phonon frequencies. As the stretching and bending modes in these compounds occur at high energies, we expect that significant changes in the high energy Raman and IR modes would be observed in presence of strong magnetic field.
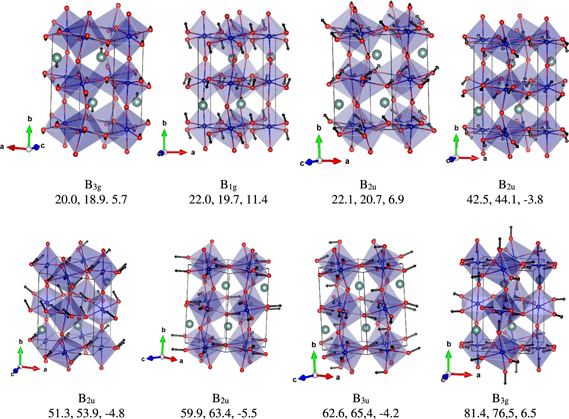
Figure 8. The displacement pattern of representative zone-center modes that exhibit large change in phonon energy in the two type of magnetic calculations (the collinear calculation and non-collinear calculation with magnetic moment along a-axis) in YCrO3. The numbers below each plot represent the character of the mode, and the numbers in the next line are the phonon energy in meV with the non-collinear magnetic moment and collinear magnetic calculations respectively and the percentage change. Key: Y—silver, Cr—blue and O—red.
Download figure:
Standard image High-resolution image4.5. Thermal expansion behaviour
The calculated elastic constants and elastic compliances in YCrO3 and LaCrO3 are given in table 3. The calculated elastic constant C22 in YCrO3 shows significantly large difference between the non-collinear and collinear calculations. Neutron powder diffraction has been used to study the high temperature behaviour of RCrO3 (R = Y, La). An orthorhombic to a rhombohedral structural phase transition has been reported [59] in LaCrO3 at about 533 K, while in YCrO3 measurements show [60] no transition up to 1200 K. Detailed experimental data on anisotropic thermal expansion behaviour are available for YCrO3, but not for LaCrO3. Here we only report the thermal expansion calculation for YCrO3 using collinear calculation in a G-type magnetic structure. Previously our thermal expansion calculations using collinear magnetic configuration in YMnO3 [61] and GaFeO3 [62] were found to be in good agreement with the available experimental data.
Table 3. The calculated elastic constants and elastic compliances YCrO3 and LaCrO3. Cij and sij are in the units of GPa and 10−3 GPa−1 respectively. The magnetic moment on the Cr atoms in the non-collinear calculations is along the a-axis.
| Cij (in GPa) | sij (in 10−3 GPa) | |||||
|---|---|---|---|---|---|---|
| YCrO3 | LaCrO3 | YCrO3 | LaCrO3 | |||
| Non-collinear | Non-collinear | |||||
| magnetic | magnetic | |||||
| (moment along | Collinear | Collinear | (moment along | Collinear | Collinear | |
| ij(Cij /sij ) | a-axis) | magnetic | magnetic | a-axis) | magnetic | magnetic |
| 11 | 313.5 | 315.8 | 238.0 | 4.7 | 4.4 | 5.7 |
| 22 | 320.0 | 290.0 | 294.4 | 3.9 | 4.4 | 4.2 |
| 33 | 292.7 | 289.4 | 287.4 | 4.9 | 4.7 | 4.9 |
| 12 | 128.4 | 121.9 | 92.8 | −1.1 | −1.2 | −1.0 |
| 13 | 160.0 | 144.1 | 126.0 | −2.1 | −1.7 | −2.1 |
| 23 | 114.2 | 110.1 | 115.6 | −0.9 | −1.1 | −1.3 |
| 44 | 78.4 | 80.6 | 84.2 | 12.8 | 12.4 | 11.9 |
| 55 | 100.6 | 98.6 | 96.0 | 9.9 | 10.1 | 10.4 |
| 66 | 107.0 | 106.8 | 90.8 | 9.3 | 9.4 | 11.0 |
It is important to mention here that a large number of phonons in the entire Brillouin zone contribute [44, 48, 63] to the thermal expansion behaviour. The calculated anisotropic Grüneisen parameters (Γ(E)) averaged over the Brillouin zone are shown in figure 9. We note that Γ(E) have large values for energies below 10 meV. However, the density of states below 10 meV is relatively small, and so it does not contribute much to the thermal expansion around 300 K and above. At higher energies above 10 meV, the values of all the three anisotropic Grüneisen parameters (Γa , Γb and Γc ) in the entire energy range are found to be nearly same, except that Γa is negative around 20 meV. To get a numerical sense of the dependence of the Grüneisen parameters on the linear thermal expansion coefficients for YCrO3, we re-express the equation (3) using the elastic compliance values (table 3) as follows:

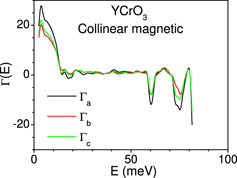
Figure 9. Variation of the anisotropic Grüneisen parameters with phonon energy E averaged over the Brillouin zone in YCrO3.
Download figure:
Standard image High-resolution imageIt can be seen that the anisotropic Grüneisen parameters (Γa, Γb and Γc ) as shown in figure 9 would lead to anisotropic linear thermal expansion coefficients. The linear thermal expansion coefficients αb would have maximum positive value, while αa would have minimum positive value. The calculated linear thermal expansion coefficients for YCrO3 in the orthorhombic phase above 140 K (paramagnetic phase), as a function of temperature are shown in figure 10(a). In figure 10(b), we have compared the calculated values with the available experimental data [60] on YCrO3. The experimental observation of anisotropic thermal expansion behaviour of YCrO3 in the paramagnetic phase above 140 K is very well reproduced (figure 10(b)) by our calculation.
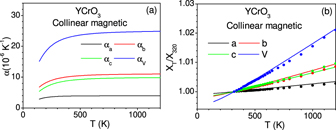
Figure 10. (a) Calculated anisotropic thermal expansion coefficients in YCrO3. (b) Variation of a, b and c lattice parameters, and volume (X = a, b, c, V) with temperature in YCrO3. The experimental data of structural parameters (solid circles) for YCrO3 are taken from reference [60] respectively. The thermal expansion calculations are shown in the paramagnetic orthorhombic phase of YCrO3 above 140 K.
Download figure:
Standard image High-resolution imageZhu et al [60] inferred an isosymmetric structural phase transition at 900 K from an anomaly in the structural parameters. The information about isostructural transition is difficult to get in powder INS data. We also note that all the DFT calculations are performed at T = 0; hence, we could not comment on the anomaly at 900 K from our experiments and calculations. Our calculations of the changes in the lattice parameters with temperature are compared with the experimental data in figure 10(b), which indicate an overall good agreement. However, the anomaly in the experimental data, which appears rather small in figure 10(b), is not seen in the calculation.
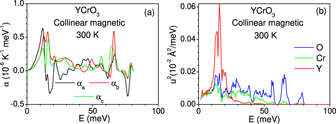
To investigate the specific anharmonic phonon energies responsible for the thermal expansion behaviour, we have calculated the contribution to the linear thermal expansion coefficients (figure 11(a)) from phonons of various energies averaged over the Brillouin zone at 300 K in YCrO3. We find that the phonons of energy around 10–20 meV (figure 9) contribute maximum to the thermal expansion along all the three axes. The calculated partial phonon density of states (figure 5) show that at these energies the contribution from Y atoms is more in comparison to that of Cr and O atoms.
Figure 11. (a) The contribution to anisotropic linear thermal expansion coefficients at 300 K, from phonon modes of energy E averaged over the Brillouin zone. (b) The contribution of phonons of energy E to the mean-squared amplitude of various atoms in YCrO3 at 300 K.
Download figure:
Standard image High-resolution image
To understand the nature of these phonons we have calculated (figure 11(b)) the contribution of phonons of energy E to the mean-squared amplitude [48] of atoms at 300 K, which shows that at energies around 10–20 meV the u2 values of Y atoms are significantly larger compared to Cr and O atoms. The modes corresponding to rotation of CrO6 and YO8 units are found at higher energies above 50 meV and 30 meV respectively.
5. Conclusions
In this article, we have presented the ab initio lattice dynamics calculations and INS measurements of YCrO3 and LaCrO3. The scattering with low momentum transfer (Q = 1–4 Ǻ−1) is significantly dominated by magnetic scattering and shows significant changes across the magnetic transition temperature, while the phonon processes are dominated at high momentum transfer regime (Q = 4–7 Ǻ−1) that remain essentially invariant with temperature. The calculated zone-center phonon frequencies in YCrO3 compound show significant change with different magnetic configurations, which suggests strong spin–phonon coupling. The calculated anisotropic thermal expansion behaviour in the orthorhombic phase of YCrO3 is in excellent agreement with the available experimental data above 320 K in the paramagnetic phase. We found that low-energy phonon modes involving translation motion of Y atoms contribute significantly to the thermal expansion behaviour.
Acknowledgments
The use of ANUPAM super-computing facility at BARC is acknowledged. SLC thanks the Indian National Science Academy for award of an INSA Senior Scientist position.