

Abstract
The bound states of 10Be have been studied by removing single neutrons from 11Be nuclei. A 2.8 MeV u–1 beam of 11Be was produced at ISOLDE, CERN and directed on to both proton and deuteron targets inducing one-neutron removal reactions. Charged particles were detected to identify the two reaction channels (d, t) and (p, d), and the individual states in 10Be were identified by gamma detection. All bound states but one were populated and identified in the (d, t) reaction. The combination of REX-ISOLDE and MINIBALL allowed for a clean separation of the high-lying states in 10Be. This is the first time these states have been separated in a reaction experiment. Differential cross sections have been calculated for all the reaction channels and compared to DWBA calculations. Spectroscopic factors are derived and compared to values from the litterature. While the overall agreement between the spectrocopic factors is poor, the ratio between the ground state and the first excited state is in agreement with the previous measured ones. Furthermore, a significant population of the  state is observed, which which may indicate the presence of multi-step processes at our beam energy.
Export citation and abstract BibTeX RIS

Content from this work may be used under the terms of the Creative Commons Attribution 3.0 licence. Any further distribution of this work must maintain attribution to the author(s) and the title of the work, journal citation and DOI.
1. Introduction
The study of light nuclei has always presented challenges due to the rapid structural changes encountered here. The field has been reinvigorated recently partly due to experimental progress that now allows studies at and even beyond the driplines [1], partly due to the impressive theoretical progress in ab initio calculations, see e.g. [2]. We are here intersted on the particle bound levels in 10Be, a nucleus that due to its halflife of more than 1 My and its location close to the valley of stability has been studied thoroughly in many previous experiments. This holds in particular for the two lowest states, the  ground state and the first excited
  state (
 keV), where as an example the E2 transition between the two states as well as the corresponding transition in the mirror nucleus 10C have been measured and can be compared with ab initio calculations [3]. The two doublets situated around 6 MeV have been significantly harder to tackle due to the small separation of the levels. The four levels are situated within 300 keV of each other, see figure 1. The experimental situation for the (unbound) mirror levels in 10C is still being unraveled [4].
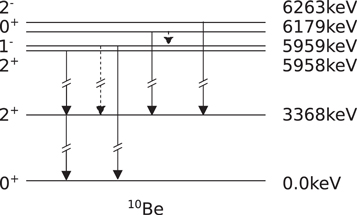
Figure 1. Level scheme of the bound states in 10Be. The excitation energy, spin and parity are given. The gamma decay lines with a branching ratio larger than 10% are shown as well. In the levels with more than one decay, the decay with the largest branching ratio is marked with a solid line.
Download figure:
Standard image High-resolution imageThe four excited states in 10Be close to 6 MeV excitation energy are often described in terms of cluster models with two alpha particles and two neutrons as basic constituents, see the reviews [5, 6] for references to the original literature. In these models there is a tendency for the  level to have more separated alpha cores, which could retard transitions between that level and the others. We shall be concerned mainly with the negative parity
  and
and  states that are candidates for being one-neutron halo states [7], although that it could be dangerous to describe them in terms on an inert 'core' of 9Be or 8Be. As an example the recent calculation of the 1/2+ resonance in 9Be [8] showed that its structure changes from α+5He at short distances to n+8Be at large ones.
Halo structures are by now established in many nuclear ground states [9–11] but are much harder to identify clearly in excited states, one of the few exceptions being the excited  bound state in 11Be. The
  and
and  states in 10Be are 852 keV and 549 keV, respectively, below the neutron threshold and would be halo states if their wavefunctions were dominated by a configuration with an s-wave neutron around a 9Be core. There is some support for such a picture from microscopic cluster models, see [7] that contains a detailed analysis of the electromagnetic decays of the
  state. Independent evidence may be found in the beta-delayed neutron emission of 11Li that proceed through all excited states in 10Be, see [12] and references therein, but there is a clear need for further experimental data before firm conclusions on the structure of these states can be made. The neutron-removal reaction from a 11Be beam is here an attractive one since the states are naturally formed by removal of a neutron in the 10Be core. One has to take care in the theoretical description of such transfer reactions, since three of the involved states would then be halo states (11Be, the
  or
or  state, and the deuteron) and only the triton or proton (for (d, t) and (p, d) reactions, respectively) a 'normal' nuclear state.
There is also relevant information in the transition to the ground state and the first excited state in 10Be. The two main components of the ground state of 11Be are 10Begs+n(s1/2) and 10Be +n
+n and the relative amounts can be determined from the spectroscopic factors for transitions to the two states. The two transitions therefore can be thought of as corresponding to removal of the halo neutron. Many different experiments have addressed this problem. The results are compiled and discussed in recent papers [13, 14] on a 10Be(d, p) experiment carried out at Oak Ridge.
This paper presents results from 11Be(d, t) and (p, d) reactions at 2.8 MeV u–1 carried out at the REX-ISOLDE postaccelerator and discusses their relevance for the single-particle structure of 10Be as well as the 11Be ground state. Several earlier experiments have looked for the relation between 11Be and 10Be, but this is the first time that the four excited states between 5958 and 6263 keV could be clearly separated in a reaction experiment. This was possible owing to the unique combination of moderate Doppler shift and high intensity provided by ISOLDE, and the high detection efficiency of the MINIBALL setup even at 6 MeV gammas.
Knock-out of a neutron from 11Be at high beam energy should give similar information as the transfer reactions at lower energy, but none of the experiments have so far succeeded in separating all final states. The first such experiment took place at MSU [15], where the possible populations of the  and
and  states were assumed to be much smaller than to the
  and
and  states, based on shell-model calculations. The latter two could be separated due to their different decay paths, see figure 1 and table 1. Similar assumptions were made in more detailed experiments at GSI [16] and at GANIL [17]. An earlier GANIL 11Be(p,d) experiment at 35.5 MeV u–1 [18, 19] had no γ-detection, but the SPEG spectrometer allowed separation of the ground state, the
  state and the group of four states at 6 MeV from each other. The analysis here again assumed that the
  and
and  states dominate over the
  and
and  states.
Table 1. The important gamma lines produced by excited states in 10Be. The branching ratios and the detection efficiencies are also shown.
| Eγ | Decay | BR (%) |
 (%) (%) |
|---|---|---|---|
| 0.22 MeV |

|
34.3 | 14 |
| 2.6 MeV |

|
91 | 3.2 |

|
34 | ||
| 2.9 MeV |

|
65.7 | 2.8 |

|
100 | ||
| 3.3 MeV |

|
100 | 2.5 |
| 6 MeV |

|
66 | 1.5 |
| 6 MeV+C |

|
66 | 9.5 |
The experimental procedure is described in the next section 2 followed by the analysis in section 3. Finally the results are compared to values from previous experiments and discussed in section 4.
2. Experiment
The data presented in this paper was taken as part of a larger experiment performed at the ISOLDE facility, CERN. The first results are published in [20], which also contains a detailed description of the experimental setup and procedure. A general overview of the reaction program at ISOLDE can be found elsewhere in this volume [21].
The 11Be beam was produced by fragmentation of a UC-target irradiated by 1.4 GeV protons. The beryllium atoms were subsequently laser iodized by the RILIS [22] and post-accelerated to 2.8 MeV u–1 by REX-ISOLDE [23].
Five different targets were used in the experiment. The primary targets were a CD2 (1.00(5) mg cm–2) and a CH2 (1.1(1) mg cm–2) target. The first was used for the (d, t) reactions while the latter was used for the (p, d) reaction and for background correction of reaction on proton contamination in the CD2 target. A pure carbon target (1.50(5) mg cm–2) was used to correct for reactions on carbon in the two primary targets. The beam intensity was measured throughout the experiment using Rutherford scattering on a silver target (1.9(1) mg cm–2). The final target was a thick aluminum foil ( ), which was used for efficiency calibration of the germanium detectors as presented later in this section.
The MINIBALL germanium setup [24] along with the T-REX silicon array [25] were used for detection of gammas and charged particles respectively. The tritons were detected by the eight resistive strip detectors of the T-REX covering angles between 40° and 120° in center of mass. Four annular detectors placed in the very forward laboratory angles allowed for coincidence measurements of tritons and 10Be. The statistics for these events was much lower than for the single particle events. The coincidence measurements were therefore only used to determine the structure of the beam as described in [26].
The silicon detectors were calibrated using an α-source containing four emitters (148Gd, 239Pd, 241Am and 244Cm). The energy and efficiency calibration of the low-energy ( keV) part of the germanium detectors were done using three known sources (152Eu, 60Co and 207Bi).
Long lived, high energy gamma sources do not exist. It is therefore challenging to calibrate the germanium detectors up to 6 MeV, which is required to identify the  state (
 keV). The ISOLDE facility enabled the usage of shortlived isotopes for the calibration. 11Be isotopes were stopped in an aluminium foil, where they β-decayed and subsequently emitted gammas ranging from 2 to 7 MeV. The relative efficiencies of these gammas were determined and scaled to fit the low-energy ones. Figure 2 shows the determined detection efficiencies for the MINIBALL clusters. The dashed line is a fit to the efficiency function taken from RadWare [27].

Figure 2. The detection efficiency of the MINIBALL cluster. The values determined from 11Be are scaled to fit the sources with known activity.
Download figure:
Standard image High-resolution imageThe relevant efficiencies are given in table 1 along with the corresponding decay and their branching ratios. The value 6 MeV+C is the efficiency for the 6 MeV gamma peak including the compton edge ( MeV), see figure 5. This is the value used for the
  state. It is derived by scaling the 6 MeV peak efficiency with the ratio between the number in the 6 MeV peak (
 MeV) and the number in the peak plus compton edge (
 MeV), see figure 5:
This is a very high detection efficiency for such a high energy gamma. This is partly due to the clean gamma spectrum below the main peak and partly to the good detection efficiency of the MINIBALL cluster even at these high gamma energies.
3. Analysis
This section describes the analysis of the data. The identification of the five states is described first. Then the calculation of both the experimentally and the theoretically determined cross sections are described.
3.1. Identification of the bound states
The identification and separation of the populated states are done in two steps. The first step is to identify the (d, t) and the (p, d) reactions from other reaction channels. This was done using  plots, where the energies of the two telescope detectors are plotted against each other. The plots can be seen in [20]. The energy and angle of the identified tritons were then used to determine the excitation energy of the produced 10Be nuclei. The spectra are shown as the black lines in figures 3 and 4(a). It is clear that only the ground state is produced with sufficient deuteron energy in the (p, d) reaction. No significant carbon background is present in the spectrum either and all the events in figure 3 are used to determine the (p, d) differential cross section. The spectrum from the (d, t) reaction shows three peaks corresponding to the ground state, the first excited state and a peak consisting of the four high-lying states. The two lowest peaks are used to determine the differential cross sections for the corresponding states.
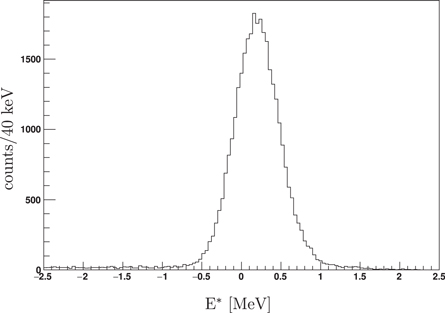
Figure 3. Spectrum of the excitation energy of 10Be deduced from deuterons in the (p, d) reaction.
Download figure:
Standard image High-resolution imageThe four states in the peak around 6 MeV, figure 4(a), is identified by looking at the gamma spectrum in coincidence with the detected tritons. The gamma spectrum is shown in figure 5, where all the important gamma peaks are marked. Excitation energy spectra gated on the gamma peaks are shown in figure 4(b). The spectra are scaled to take the detection efficiency and the branching ratio shown in table 1 into account. A sum of all the gated and scaled spectra are shown as the red line in figure 4(a). The strong overlap between the ungated and the gated spectrum in figure 4(a) and the clean peaks in figure 4(b) indicate a clean identification of the states and a proper scaling. The peak in figure 4(b) gated on the 6 MeV plus Compton edge is very clean and have a mean slightly below 6 MeV, which indicate a clean identification of the  state. The slight discrepancy for the upper part of the 6 MeV peak may indicate a small underestimation of the
  component.
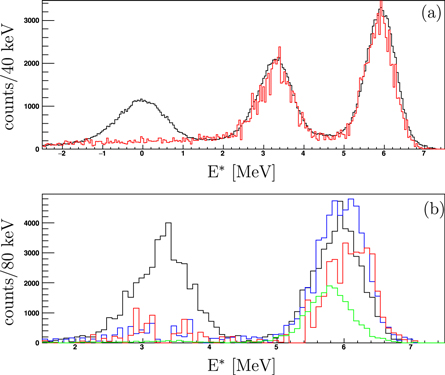
Figure 4. Excitation energy spectra of 10Be for the (d, t) reaction. (a) Black: the total energy spectrum without any gamma gate. Red: the sum of the gamma gated spectra. (b) The individual excitation energy spectra for each gamma gate. Blue: 2.6 MeV. Red: 2.9 MeV. Black: 3.3 MeV. Green: 6 MeV+C.
Download figure:
Standard image High-resolution image
Figure 5. Energy spectrum for gammas in coincidence with detected tritons. The four peaks used to produce the four spectra in figure 4(b) are indicated. The Compton edge plus 6 MeV peak used for the  is taken as the area from 4.6 to 6.2 MeV.
Download figure:
Standard image High-resolution imageIt is clear from table 1 that the spectrum gated on the 3.3 MeV gamma line can contain all four states, as well as the  state, which is anyway clearly separated in the particle spectrum. This spectrum is therefore only shown for completion. The spectrum gated on the 6 MeV gamma peak and compton edge is the only peak containing one state, the
  . This spectrum is used to determine the differential cross section for the
  state. The two spectra gated on the 2.6 MeV and the 2.9 MeV gamma peaks could both contain two different states. The spectrum gated on the 2.9 MeV gamma is used to make a combined differential cross section for the
  and the
  states. The pure cross section for the
  state determined from the 6 MeV gated spectrum is then subtracted from the combined differential cross section in order to determine the cross section of the
  state. The 2.6 MeV gated spectrum could contain contributions from both the
  and the
  state. The
  state can both decay via a 2812 and a 219 keV gamma, see table 1. The 2:1 ratio in the branching ratios is fully compensated by the 2.8:14 ratio in the detection efficiency. The 219 keV gamma peak should therefore be the stronger than the 2812 keV one, and since no peaks are observed at 219 keV, figure 5, the conclusion is that the
  is only very weakly populated and its contribution to the 2.6 MeV gamma peak is negligible. The spectrum gated on the 2.6 MeV is therefore assumed to be purely from the
  state.
3.2. Differential cross sections
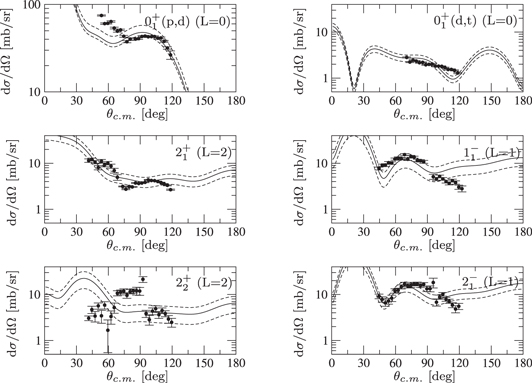
Experimentally determined differential cross sections for the five populated states are shown in figure 6. Theoretically determined cross sections based on simple DWBA calculations are also shown. It is well established that DWBA calculations may have systematic problems when the nuclear levels in question are close to being unbound, see e.g. the discussion in [13]. One earlier example involving the excited states in 10Be is the study of 9Be+4He [28] where strong coupled-channels effects were observed. A more sophisticated analysis should therefore be done to draw quantitative conclusions (e.g. by use of the extended continuum discretized coupled channel method [29, 30]) and the calculations below mainly illustrate qualitative features of the data. A contribution from a compound nucleus reaction can also not be excluded. For the similar reaction on 9Li, this contribution was estimated to be in the order of 1 mb sr–1 with a rather flat angular distribution [31]. This and the symmetry around the 90° indicate that compound reactions only make a smaller contribution.
Figure 6. Differential cross sections. The black dots are the experimental ones while the lines are the theoretical ones. The solid lines correspond to the determined spectroscopic factors given in table 3. The dashed lines are using the upper and lower limits of the spectroscopic factors. The final state values and the angular momentum used in the DWBA calculations are given in each subfigure.
Download figure:
Standard image High-resolution image
The experimentally ones are determined by comparing the spectra shown in figures 3 and 4 with Geant4 simulations. The comparisons were done using angular gates with a width of 3°. The theoretical cross sections were calculated using FRESCO [32]. The potentials used in the calculations are shown in table 2.
Table 2. Parameters for the different potentials used in the DWBA calculations.
| Channel | V0 | r0 | a0 | Wd | rI | aI | Vso | rso | aso |
|---|---|---|---|---|---|---|---|---|---|
| 10Be+d | 124.7 | 0.9 | 0.9 | 4.38 | 2.452 | 0264 | 6.0 | 0.9 | 0.9 |
| 10Be+t | 172.5 | 1.2 | 0.515 | 15 | 1.2 | 1.445 | 5.0 | 1.2 | 0.515 |
| 2H+n | 57.15 | 1.5 | 0.5 | ||||||
| 10Be+n | 62.52 | 2.585 | 0.6 | 5.25 | 2.585 | 0.6 | |||
| 11Be+d | 124.7 | 0.9 | 0.9 | 4.38 | 2.452 | 0264 | 6.0 | 0.9 | 0.9 |
| 11Be+p | 57.8 | 1.25 | 0.25 | 8.08 | 1.4 | 0.22 | 6.5 | 1.25 | 0.25 |
| 1H+n | 72.15 | 1.484 |
The 11Be+d and 10Be+d potentials are calculated from generalized parameters given by Satchler et al [33]. The 10Be+t is taken from Park et al [34] while the 11Be+p is calculated from parameters given by Comfort et al [35]. The binding potentials are taken from Capel et al [36] (10Be+n) and Austern et al [37] (1H+n).
4. Discussion
The main 'forward' peak of the differential cross sections is unfortunately not observable in our inverse kinematic. The scaling of the theoretical cross sections is therefore done without this peak, which lead to large uncertainties on the spectroscopic factors. Spectroscopic factors are determined based on the theoretical cross sections and are given in table 3 along with factors from previous experiments [13, 15, 18, 38] and theoretical ones [39, 40]. The uncertainties are given based on a comparison between the theoretical and the experimental cross sections. The theoretical cross sections with the upper and lower limits of the spectroscopic factors are shown as dashed lines in figure 6.
Table 3.
The spectroscopic factors derived in this work along with values from the literature. The first column shows the final state and the orbital of the removed neutron. The result for the  state should be taken with care, as it is based on a one-step process.
| State | This work | Fortier/ | Aumann | Timofeyuk | Schmitt | Auton | Zwieglinski |
|---|---|---|---|---|---|---|---|
| (orbital) | winfield | ||||||
| [18, 19]a | [15] | [38] | [13] | [39] | [40] | ||

|
1.05(10)/ | 0.67/ | 0.74 | 0.65(5)/ | 0.71(5) | 0.73 | 0.77 |
| 0.42(7)b | 0.79c | 0.40(4)d | |||||

|
0.20(5) | 0.28(10) | 0.18 | ||||

|
0.31(11) | 1.4e | 0.69 | ||||

|
0.40(10) | 0.58 | |||||

|
0.25(10) |
aThe values for  and
and  are taken from [18] and the last from [19].
bFactors from (p, d) and (d, t) respectively.
cValues calculated with two different well geometries.
dWithout and with 11Be breakup respectively.
eThis includes both negative parity states.
are taken from [18] and the last from [19].
bFactors from (p, d) and (d, t) respectively.
cValues calculated with two different well geometries.
dWithout and with 11Be breakup respectively.
eThis includes both negative parity states.
Concerning the extracted values of the spectroscopic factors we consider first the transitions to the ground state and  state in 10Be. These are expected to be due to removal of the halo neutron in 11Be and thereby reflect the amount of core excitation in the initial state. There is a striking difference of more than a factor of two between our (d, t) and (p, d). Furthermore our (p, d) to the ground state value is significantly higher than in all the previous measurements. These deviations underline the need for more detailed modeling. Our beam energy is too low to make one-step model results reliable and the low neutron binding that gives higher cross-sections here than for a normal nucleus [41] also calls for a more specialized treatment. However, we note that the ratio of spectroscopic factors to the ground state and the
  state agrees with the previous result within error bars, which may indicate that the our main problem lies in the absolute scale.
Secondly, we consider the four states around 6 MeV, which are produced by removing a core neutron. This is the first experiment that could differentiate all of the four states. Several earlier experiments have based on theory used that the  and
and  states would dominate. It is striking that the population for the
  state is non-negligible while we see no indications for a feeding to the
  state. Since we have a low beam energy our results may be more affected by higherorder effects. The spectroscopic factors determined here should therefore be taken with care, especially for the
  state, which is expected to be only weakly populated in a one-step process. The DWBA calculation also fails to reproduce the angular distribution for this state. As mentioned earlier, a compound reaction would not lead to such a high cross section, so a possible contribution could be a two-step process in which a core-neutron is removed from the
  shell and the halo-neutron is excited from the
  orbital to the
  orbital. The
  to
to  transition in 11Be is known to be strong, so such a higher-order process may turn out to be important at our beam energy.
While the spectroscopic factor of the  state is in our case similar to the ones found for the two negative parity states, the angular distribution for the
  state deviate from the other cases. This gives some support for the belief that the negative parity states are 'halo states' with an s-neutron around 9Be and that transitions to them via core-neutron removal are favoured. We do not attempt to extract quantitative results, but note that the
  and
and  states may not have a pure halo configuration and that more careful structure calculations may be needed.
In general we see that the simple DWBA calculations are insufficient to fully describe the data and the spectroscopic factors may for several states be affected in a more elaborate analysis. This is supported by CCBA calculations [42], where an added deformation leads to a stronger population of the two 2+-states while decreasing the population probability for the ground state.
5. Summary and conclusion
Five bound states in 10Be have been populated by removing a neutron from 11Be. Each state has been identified using the T-REX silicon array and the MINIBALL germanium clusters. Differential cross sections have afterwards been derived and compared with DWBA calculations. This is the first experiment to provide differential cross section individually for the high lying states in 10Be. Spectroscopic factors were determined as well, but do not agree with earlier determinations from literature. This is probably due to the lower beam energy in our experiment, which could lead to multi-step processes. Multi-step processes would also explain our non-neglible population of the  state. The ratio between the ground state and the
  state is on the other hand agreeing with previous measured ones within the error bars. A similar study with a higher beam energy would be able to confirm these expectations and would furthermore enable a clean study of the high-lying states in the (p,d) reaction. The HIE-ISOLDE facility, which started operating in 2015, provides more intense beams and higher beam energy and would be ideal for this experiment.
Acknowledgments
This work was supported by the Danish Research Council, by the European Union Seventh Framework through ENSAR (Contract No. 262010) and a Marie Curie Actions Grant under Contract No. PIEF-GA-2008-219175, by the BMBF under Contracts No. 06MT7178, No. 06MT9156, No. 05P09PKCI5, No. 05P12PKFNE, No. 06DA9036I, No. 05P12RDCIA, No. 05P15PKCIA and Verbundprojekt 05P2015, by the Spanish MINNECO under Contracts No. FPA2012-34332 and No. FPA2015-, by the FWO-Vlaanderen (Belgium), by GOA/10/010 (BOF KU Leuven), by the Interuniversity Attraction Poles Programme initiated by the Belgian Science Policy Office (BriX network P7/12), by the United Kingdom Science and Technology Facilities Council, and by Maier-Leibnitz-Laboratorium, Garching. The authors would like to thank Antonio M Moro and Jose A Lay for their input regarding the theoretical calculations of the differential cross sections.