
Abstract
The present study focuses on the characterization of a hyperbolic vortex plasma reactor through the comparison of various plasma-atmospheric regimes for the production efficiency of reactive nitrogen (RNS) and reactive oxygen (ROS) species. The research also explores effectiveness in the removal of micropollutants, including pharmaceuticals and per- and polyfluoroalkyl substances (PFAS). The technology includes several degradation mechanisms, such as advanced oxidation, ultraviolet photolysis, ozonation, electrolysis, and shockwave water purification, without the need for additional chemicals. Our results indicate that the plasma of bipolar or 'flashover' mode is notably more effective and efficient than both positive or negative polarity. Through the testing of various energy levels, it has been demonstrated that higher energy plasma yields lower efficiency but necessitates shorter treatment times compared to lower energy treatment. When plasma is produced under ambient atmosphere, water chemical properties change significantly in comparison to treatment under argon (Ar) or nitrogen (N2) due to the presence of both oxygen and N2 molecules. In a N2 atmosphere, the predominant formation is of RNS due to the chemical reactivity of N2 exited states, whereas under Ar atmosphere, predominantly ROS are generated. Notable advantages of this technology are its scalability and its low energy requirements. The scalability of the technology involves increasing the size of the reactor, the power and electrode count.
Export citation and abstract BibTeX RIS

Original content from this work may be used under the terms of the Creative Commons Attribution 4.0 license. Any further distribution of this work must maintain attribution to the author(s) and the title of the work, journal citation and DOI.
1. Introduction
1.1. Removal of micropollutants
Micropollutants are introduced into aquatic environments and wastewater during production and application processes. Existing methods used in drinking water and wastewater treatment plants (WWTPs) are often not effective enough in their elimination. As a result, these pollutants are dispersed throughout the environment through both specific and diffuse sources, including spills or leaching from production, application, and disposal sites, as well as the discharge of WWTP effluents into surface waters. Once released into the environment, these micropollutants can ultimately contaminate sources of drinking water such as groundwater and surface waters. Due to the inefficiency of conventional drinking water treatment processes in eliminating persistent micropollutants, the distribution systems for drinking water can serve as significant pathways for human exposure [1, 2]. Despite their low concentrations, continuous discharge of these pollutants can lead to various undesirable and hazardous consequences, including bioaccumulation, antibiotic resistance, feminization/masculinization of aquatic organisms, hormonal interference, reproductive issues, and carcinogenic effects [1, 3–5].
While conventional secondary water treatment processes can partially remove some micropollutants through (bio)degradation, transformation, and (bio)sorption, other more persistent compounds necessitate additional tertiary treatment. Current and emerging treatment methods include adsorption, photolysis, advanced oxidation processes (AOP), advanced reduction processes, membrane filtration, thermolysis, and plasma technology [5–7]. Although these methods can achieve high removal efficiencies, they exhibit selectivity towards specific compounds and may be less effective against others. This selectivity is influenced by the chemical and material properties, such as the type of oxidant, molecular weight, hydrophobicity, and electrical charge.
Challenges also arise in terms of high operational costs. For example, while adsorption and membrane filtration methods are established technologies with commercial applications in organic pollutant remediation, achieving high removal efficiencies, they do not involve active degradation. Consequently, these methods generate a residue, waste stream, or brine rich in micropollutants, necessitating additional treatment. Furthermore, periodic regeneration and management of fouling substantially contribute to operational costs and the complexity of these processes. Treatment methods such as photolysis, advanced oxidation and reduction processes, thermolysis, and plasma technology facilitate degradation, potentially resulting in complete mineralization. The degree of mineralization depending on the applied AOP and energy density. However, these treatments may also lead to the formation of harmful degradation by-products in the treated solution. Overall, many of the aforementioned technologies require significant energy inputs and/or prolonged treatment times, and encounter difficulties in scaling up to commercial applications due to specific operational conditions and associated costs [1, 5, 8, 9].
1.2. Pharmaceuticals
Apart from improving human and animal health, pharmaceuticals enhance livestock growth and well-being [10, 11]. These chemicals are designed to have a significant impact even at very low concentrations and to persist in the targeted organism for a sufficient duration to produce the desired effects. As a result, many pharmaceuticals exhibit resistance to biodegradation, leading to approximately 90%–95% being excreted unchanged after use [11]. Conventional WWTPs with primary and secondary treatment processes have been shown to be ineffective in removing various pharmaceuticals, resulting in the discharge of these compounds into surface waters either unaltered or only partially degraded [12]. This contamination has been observed to have ecotoxic effects and adverse health impacts on aquatic species such as fish, daphnia, and algae [11]. Particularly harmful pharmaceuticals to aquatic and terrestrial species belong to therapeutic groups like nonsteroidal anti-inflammatory drugs (NSAIDs) and lipid regulators [13]. While limited data is available on human health effects, translating ecotoxicity studies from other organisms poses challenges due to the chronic nature of most health effects compared to acute toxicity [14, 15]. Another significant concern is the potential development of antibiotic resistance in natural bacterial populations, which can lead to increased health costs and higher rates of morbidity and mortality due to reduced effectiveness of available antibiotics [14, 16].
1.3. Per- and polyfluoroalkyl substances (PFAS)
PFAS are a group of synthetic chemicals consisting of more than 5000 compounds. These chemicals are composed of carbon chains that are either saturated or partially saturated with fluorine atoms. Additionally, they often contain a terminal functional group such as carboxylate, sulphonate, phosphonate, sulphonamide, or hydroxyl [17]. PFAS are highly resistant to thermal and chemical degradation, have favorable dielectric properties, and exhibit low surface energy and friction coefficient. These characteristics make PFAS versatile and durable chemicals that have been used in various applications since the 1940s [4, 17].
All PFAS have a common chemical structure (Cn F2n+1), known for its high stability due to strong C–F bonds. These bonds are more electronegative and possess higher covalent bond energy than C–H bonds found in hydrocarbons (485 kJ mol−1 or 5 eV, respectively) [18]. PFAS can be further categorized based on the length of their carbon chains. Compounds with more than six to eight carbon segments are classified as 'long-chain PFAS', while those with fewer carbon segments are referred to as 'short-chain PFAS'. The most commonly encountered PFAS in the environment are perfluorooctanoic acid and perfluorooctane sulfonate (PFOS), both long-chain molecules and have been produced for the longest period. Short-chain PFAS found in the environment are typically substitutes or degradation products of long-chain PFAS [5].
Concerns about the potential impact of PFAS on human health emerged in the 1980s as their environmental distribution and bioaccumulation potential became apparent [4, 19, 20]. This led to a decrease in the use of long-chain PFAS and the emergence of short-chain PFAS as substitutes, as they were believed to have lower bioaccumulation potential. When PFAS accumulates in an organism, it increases the concentration of reactive oxygen species (ROS) in the body, leading to oxidative stress [4]. Additionally, increased cholesterol, thyroid disease, kidney & testicle cancer and pregnancy issues have been reported [4, 20]. Therefore, efficient and sustainable technologies being able to fully mineralize PFAS are of increasing importance in the water treatment industry. The vortex plasma treatment presented in this work is one of these technologies.
1.4. Plasma treatment
Plasma technology is an advanced treatment method that can achieve a high rate of removal of various micropollutants [21] due to its ability to initiate multiple degradation mechanisms without the need for additional chemicals, while still maintaining a moderate energy requirement [22, 23].
The primary mechanism of plasma chemical degradation in an aqueous environment primarily involves oxidation processes, although reduction processes and certain physical processes may also play significant roles [24, 25]. In gas–liquid environments, the composition typically consists of oxygen (O2), nitrogen (N2), and water molecules, referred to as the parent species. These parent species are the initial particles subjected to excitation and ionization by an electrical discharge. The ionization of these parent species leads to the formation of reactive particles known as primary species. Subsequent chemical reactions between the primary species and the parent species result in the creation of more stable particles called secondary reactive species [24]. They can be categorized into two main groups: ROS and reactive nitrogen species (RNS). ROS mainly include hydroxyl radicals ˙OH, hydroperoxyl radicals HO2, hydrogen peroxide H2O2, ozone O3, singlet molecular oxygen 1O2. On the other hand, RNS consist of NOx and stable and transient N2 oxyacids Ha Nb Oc . These reactive species are involved in degradation reactions with organic and/or inorganic compounds, which are the target species [25, 26].
Previous studies [27–29] have shown that plasma treatment is highly effective in the destruction of bacteria, pesticides [30], pharmaceuticals [31, 32], organic dyes [33], and PFAS [34, 35].
One innovative technology in this field is the water vortex gas discharge plasma reactor, which combines plasma technology with a Schauberger hyperbolic vortex. As shown in [36, 37] water vortices are very efficient aeration systems, and thus are capable of dissolving gases at very high rates. This reactor enables the in-situ production of reactive species in the gas phase for micropollutant degradation by plasma discharge and the efficient mass transfer and mixing required for distributing these reactive species into the liquid phase by the water vortex. Therefore, such a combination can significantly enhance micropollutant degradation
2. Methodology
2.1. Experimental setup
The system is divided into two main parts: hydraulic and electric. The left cabinet contains equipment for hydraulics, water chemical properties measurements, and data collection. In the right cabinet, the hyperbolic funnel and the high-voltage equipment are located. Figure 1 provides an overview of the experimental setup. Peristaltic pumps (Masterflex L/S, Avantor ®, VWR International GmbH, Darmstadt, Germany) were used to control the mass flow rate and water level in the funnel.
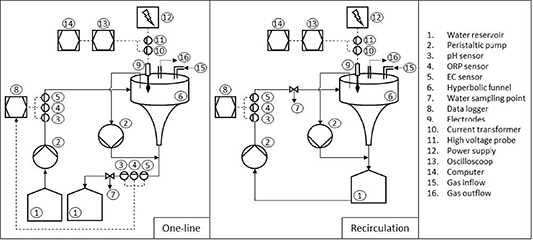
Figure 1. Schematic overview of the setup with single-pass operation on the left and recirculation on the right.
Download figure:
Standard image High-resolution imageThe reactor was connected to gas lines (compressed air (CA), argon (Ar), and N2) and the main ventilation system, enabling operation with different gas compositions in the reactor. Because of the pressure sensitivity of the water vortex, the reactor was connected to ventilation in order to maintain atmospheric pressure inside. Therefore, to handle different atmospheres, Ar and N2 gases were continuously supplied to the reactor to maintain a stable atmosphere inside. Both the ventilation and the gas supply were connected to the top of the funnel. Before starting the experiment, the whole system was running for 15 min with gas supply and without plasma discharge to establish a stable atmosphere.
The water flow was carefully directed from the left cabinet into a hyperbolic funnel positioned within the right cabinet. Both built electromagnetic compatibility cabinets were constructed with metal material to shield high frequency electro-magnetic radiation from high voltage capacitor discharging and were grounded to ensure safety. The water inlet and outlet were also grounded for added precaution. Inside the hyperbolic funnel, a water vortex formed due to the combination of tangential water flow and the hyperbolic shape of the funnel.
A set of high-quality stainless steel electrodes was positioned just above the water's surface. The number of electrodes could be easily adjusted, ranging from a minimum of one to a maximum of 16.
The experimental setup allowed operations in two different configurations. The first configuration was a single-pass system, where water was pumped from the initial reservoir through the reactor and subsequently collected in a separate reservoir. Samples were extracted from the pipeline between the reactor and the reservoir with effluent. This particular configuration was utilized to assess the reactor's performance after completing one cycle of treatment. In contrast, the second configuration was recirculation. In this mode, water was pumped from the 1.3 l water reservoir, treated within the reactor, and then discharged back into the same reservoir. This recirculation setup enabled the continuous treatment of the same water, providing a means to evaluate the impact of varying treatment times. In both configurations, a second pump was used to pump a small amount of water from the top cylindrical part of the funnel to a separate 1.3 l water tank or reservoir to stabilize the water level, avoid overflows, and provide a stable gap between the electrodes and the water surface. The water level in the funnel is highly dependent on water flow and plasma regime. By adjusting the flow rate of both pumps, a water vortex was formed and its stability was achieved while pumping water through the reactor.
2.2. Electric circuit
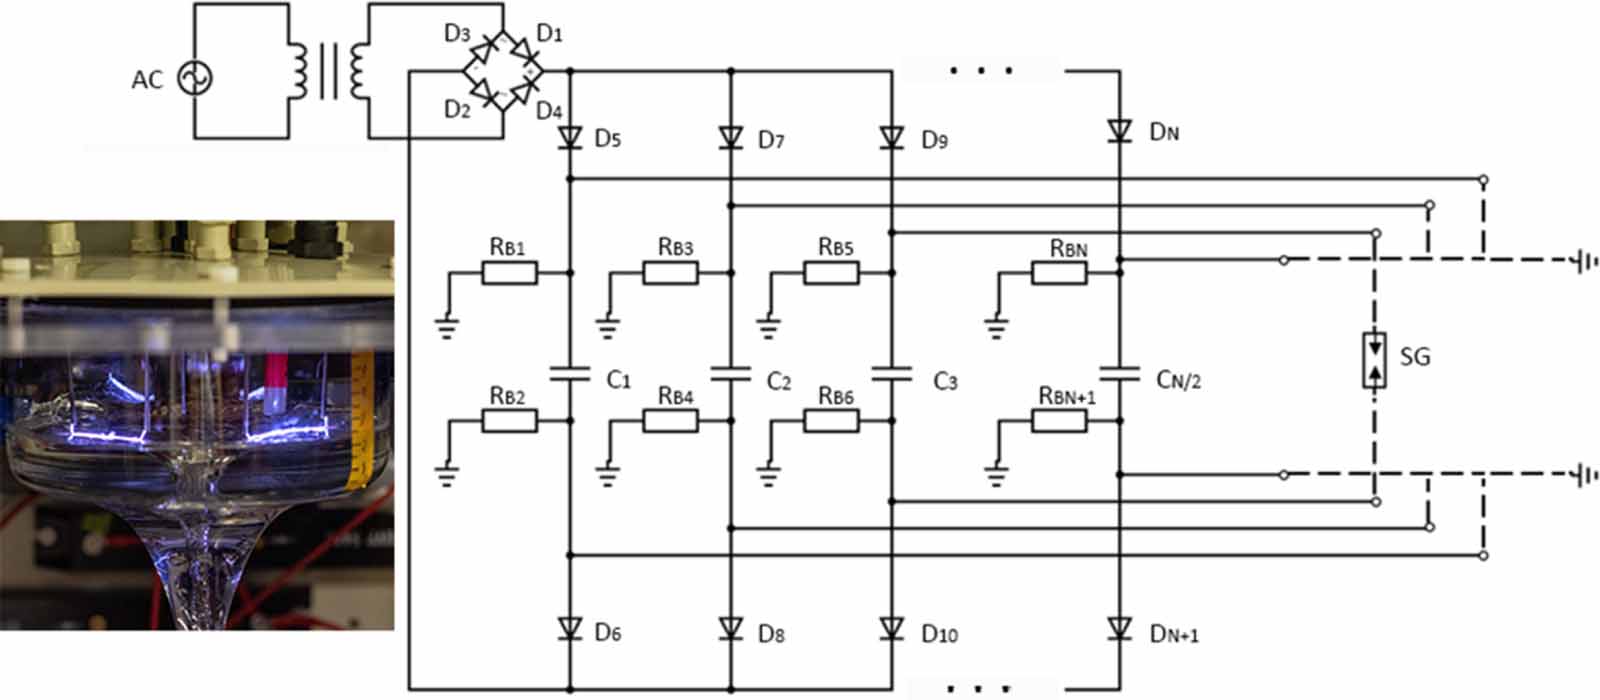
Figure 2 illustrates the electric circuit for the high-voltage power supply. It consists of a low-voltage power supply (230 V AC). A neon-transformer (T) (RESINBLOCK-230 V-input low voltage to high voltage signal. The high voltage passes through a bridge rectifier (D1, D2, D3, D4) for AC to DC conversion. A set of capacitors (C1, C2, C3, ... CN /2) linked to the electrode configuration in the funnel lid supplies the pulsed power. Diodes (D5, D6, D7, ... DN/2) separate capacitors, allowing independent electrode functioning. Bleeder resistors (RB1, RB2, RB3, ... RBN , RBN+1) ground the capacitors for quick discharge as a safety measure after system shutdown. The system can easily expand by adding more capacitors and electrodes to increase the number of discharges in the funnel.

Figure 2. Electric circuit diagram of the high voltage power supply used for the experiments. Low voltage power supply (230 V AC), A neon-transformer (T) (RESINBLOCK-230 V–10 000 V–18 mA; F/ART Italia) converts the input low voltage to high voltage signal. The high voltage passes through a bridge rectifier (D1, D2, D3, D4) for AC to DC conversion. Cx are capacitors, Dx diodes, Rx bleeding resistors, SG spark gap.
Download figure:
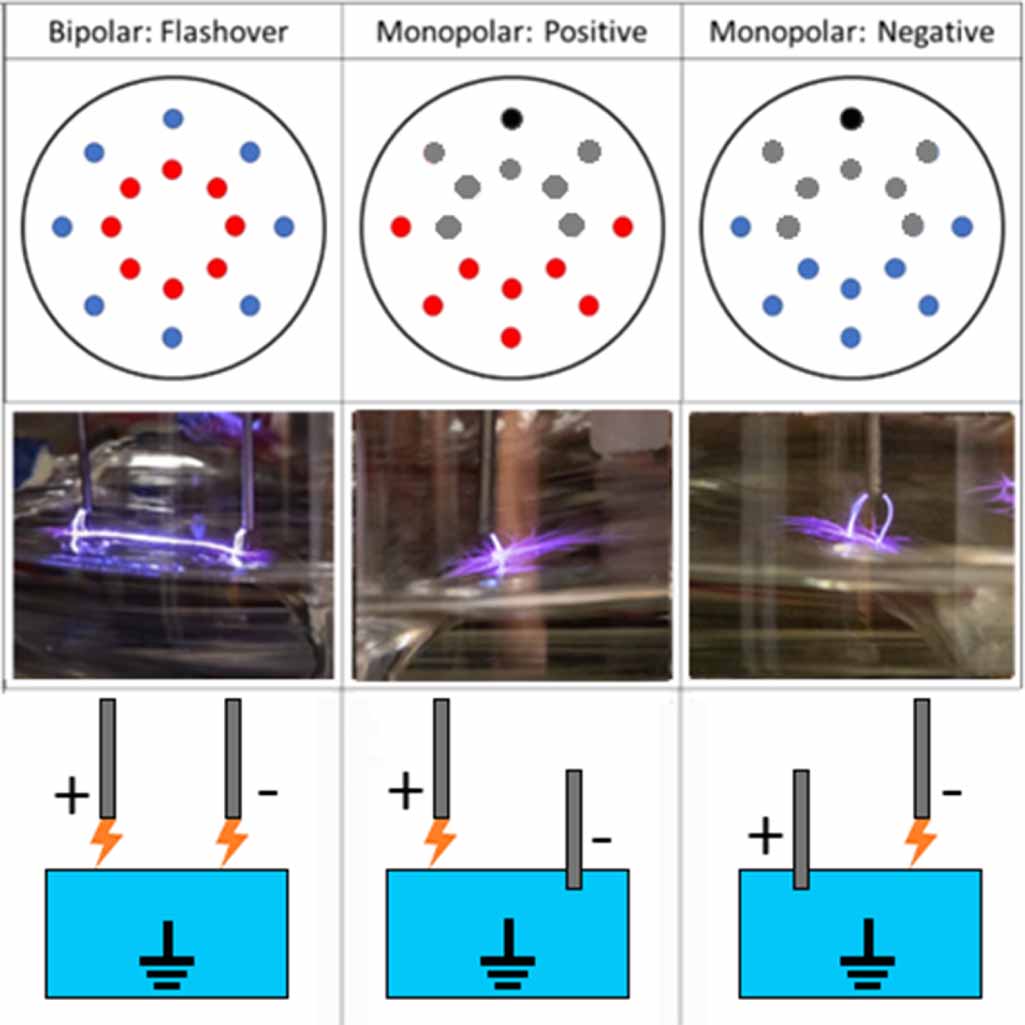
Standard image High-resolution imageThe electric circuit allows for the application of three types of discharges: bipolar and monopolar, each resulting in different plasma parameters and discharge types. In the bipolar electrode configuration, a non-thermal arc plasma discharge was generated, with the streamer spanning from one electrode to another. This particular plasma regime is referred to as the 'flashover'. In this regime half of the electrodes carry a positive polarity, while the other half holds a negative polarity (as depicted in figure 3). All electrodes are located above the water surface. On the other hand, the monopolar electrode configurations, either positive or negative polarity, produced a pulsed streamer plasma discharge. To achieve monopolar discharges in the setup, the working side of the capacitors was connected to the electrodes positioned above the water surface, initiating the plasma discharge. The other side of all capacitors was connected to a single spark gap (SG). The dashed lines in figure 2 denote that depending on the polarity of the monopolar plasma discharge, either one or the other side of the capacitors is connected to the SG. Subsequently, the SG was connected to a single electrode located below the water surface. As explained in section 2.1, the water was grounded. Therefore, the submerged electrode was also grounded, which is shown as connected ground to the SG in figure 2 and illustrated in figure 3. In the case of positive monopolar discharge, the negative side of the capacitors was connected to the SG. In the case of negative polarity, the positive side was connected. Electrodes were distributed uniformly over the surface of the vortex for the flashover regime. In monopolar regime, the working electrodes were placed further from the submerged electrode to avoid flashover discharge.

Figure 3. Electrode configuration of 16 electrodes for bipolar (flashover) and monopolar (negative or positive) plasma discharges. Positively charged electrodes are indicated in red, negatively charged electrodes are indicated in blue, while grey-indicated electrodes are not in use. In the upper diagram, the electrode connected to the SG is marked in black. In the bottom diagram, the same electrode is immersed in water.
Download figure:
Standard image High-resolution image2.3. Analysis of the pulsed electrical signal
Current and voltage analysis of the pulsed plasma discharge signal was conducted using a current transformer (Magnelab CT-F0.25-S, GMW Associates, San Carlos, CA, United States) and a high-voltage probe (PVM-5, North Star High Voltage, Bainbridge Island, WA, United Staes). These instruments were connected to an oscilloscope (Handyscope HS6D, TiePie, Sneek, The Netherlands) and a computer in the left cabinet for data collection and analysis related to energy demand and plasma parameters. Subsequently, MatLab R2022b (9.13.0.2080170) was employed to process the recorded data, enabling the determination of current and voltage pulse profiles, along with the pulse repetition rate for the generated plasma discharge within the reactor.
2.4. Water analysis
The inlet and outlet of the set-up contained water sampling points and sensors to measure physicochemical parameters for monitoring water chemical properties as shown in figure 1, including pH (Memosens Orbisint CPS11D, Endress + Hauser, Wien, Austria) oxidation reduction potential (ORP) (Memosint CPS12D, Endress + Hauser, Wien, Austria), and electrical conductivity (EC) (Memosens CLS15E, Endress + Hauser, Wien, Austria).
Samples were analyzed for reactive species by the photo spectrometric method of Hach-Lange for nitrate (LCK339, Hach Lange GmbH, Wien, Austria) and nitrite (LCK342, Hach Lange GmbH, Wien, Austria). The drop count titration method of Hach-Lange was used for the determination of hydrogen peroxide concentration (HYP-1, Hach Lange GmbH, Wien, Austria).
For experiments with micropollutants, these were spiked into an ultrapure Milli-Q water. Water samples were taken at set time intervals and analyzed for PFAS or pharmaceuticals species concentrations with liquid chromatography—mass spectrometry (6420 triple Quad LC/MS, Agilent Technologies, Santa Clara, CA, United States). In addition, for PFAS experiments, defluorination was assessed by measuring free fluoride (F−) ions in water samples using a fluoride sensor (combination fluoride electrode perfectIONTM, Mettler Toledo®, Wien, Austria).
2.5. Experimental configuration (table 1)
2.5.1. Bipolar and monopolar discharges.
A comparison was conducted involving three different polarity configurations, each utilizing four capacitors of 2000 pF. The configurations included two monopolar modes, one with four positive electrodes and another with four negative electrodes, along with a flashover mode involving four positive and four negative electrodes together, all under an air atmosphere. The comparison was based on water chemical properties (pH, ORP, EC) and the efficiency of reactive species production. This assessment took place within a single-pass configuration using tap water.
Table 1. List of experiments performed and parameters chosen.
| Experiment | Discharge type | Number of electrodes | Сapacitance (pF) | Atmosphere | Flow configuration | Treatment (time min−1) | Applied energy density (kWh m−3) |
|---|---|---|---|---|---|---|---|
| 2.5.1 Bipolar and monopolar discharges | Positive monopolar | 4 | 2000 | Air | Single-pass | 0.2 | 0.005 |
| Negative monopolar | 4 | ||||||
| Flashover | 8 | ||||||
| 2.5.2 Different capacities | Flashover | 8 | 1000 | Air | Single-pass | 0.2 | 0.003 |
| 2000 | 0.005 | ||||||
| 2.5.3 Number of electrodes | Flashover | 2 | 2000 | Air | Recirculation | 20 | 0.3 |
| 16 | |||||||
| 2.5.4 Different atmospheres | Flashover | 16 | 2000 | Air | Recirculation | 60 | 0.9 |
| Argon | 0.45 | ||||||
| Nitrogen | 3.5 | ||||||
| 2.5.5 Pharmaceutical matrix treatment | Flashover | 16 | 1000 | Air | Recirculation | 30 | 0.25 |
| 2000 | 15; 30 | 0.25; 0.45 | |||||
| 2.5.6 PFAS degradation | Flashover | 16 | 1000 | Air | Recirculation | 10; 30; 60 | 0.08; 0.25 0.5 |
| 2000 | 0.15; 0.45; 0.9 |
2.5.2. Different capacities.
The plasma characteristics highly depend on the capacitors in the electric circuit. Therefore, different types and numbers of capacitors were tested. In the current series of experiments, a single-pass system with tap water under an air atmosphere in flashover mode, along with eight electrodes and two types of capacitors (1000 pF and 2000 pF) was used. The comparison of capacitor efficiency was based on water chemical properties and the effectiveness of reactive species production.
2.5.3. Number of electrodes.
Two recirculation configurations were compared: one with two electrodes and another with 16 electrodes, both operating for 20 min in flashover mode under an air atmosphere with 2000 pF capacitors and Milli-Q water (Milli-Q® systems, Merck MilliporeSigma, Burlington, MA, United States). It should be noted here that in principle, the difference in the number of electrodes does not alter the power of the plasma discharge or its pulse energy. The comparison was made based on reactive species production and water chemical properties (ORP, EC, and pH).
2.5.4. Different atmospheres.
The characteristics of a plasma discharge depend on the electrical properties of the atmosphere inside the reactor. Therefore, different atmospheres were tested in the reactor. The key comparison was conducted under different atmospheres (air, Ar, and N2) regarding reactive species production and water chemical properties. Three different recirculation configurations were applied for 60 min in flashover mode, each utilizing 2000 pF capacitors and Milli-Q water.
2.5.5. Pharmaceutical matrix treatment.
A matrix of different pharmaceuticals (table 2) was treated for 30 min in a recirculation configuration, in flashover mode, under an air atmosphere, and with capacitors of two different types, 1000 pF and 2000 pF. Then, the same matrix was treated with the same amount of plasma energy using different capacitors, corresponding to different treatment times (30 min for 1000 pF capacitors and 15 min for 2000 pF capacitors). A comparison was made regarding the removal rate and removal efficiency of micropollutants.
Table 2. Matrix of treated pharmaceuticals and their characteristics.
| Pharmaceutical name | CAS number | Therapeutical category |
|---|---|---|
| Carbamazepine | 298-46-4 | Ani-epileptic |
| Ciprofloxacin | 85721-33-1 | Antibiotic |
| Diclofenac | 15307-79-6 | NSAID |
| Ibuprofen | 51146-56-6 | NSAID |
| Metronidazole | 443-48-1 | Antibiotic |
| Naproxen | 22204-53-1 | NSAID |
| Hydrochlorothiazide | 58-93-5 | Diuretic |
2.5.6. PFAS degradation.
A concentration of 80 mg l−1 of PFOS was treated for 10, 30, and 60 min in recirculation configuration, operating in flashover mode under an air atmosphere, and utilizing capacitors of 1000 pF and 2000 pF. As described in section 2.5.5, a comparison of the different settings was carried out on the rate and efficiency of PFOS removal and defluorination at the same plasma energy and different treatment times, or at different plasma energies and the same treatment time.
3. Results and discussion
3.1. Bipolar and monopolar discharges
The bipolar and monopolar discharges caused different changes in the water chemical properties (figure 4). Notably, the bipolar flashover plasma discharge led to a decrease in pH, coinciding with a minor increase in ORP. These changes suggest a higher concentration of reactive species in the solution, particularly N2-based species, as supported by existing theories [38, 39]. The gas composition, consisting of approximately 78% N2 in natural air used during the characterization experiments, promoted the formation of nitric/nitrous acids, resulting in a pH decrease.

Figure 4. Change in the water chemical properties, pH, ORP, EC, production of reactive oxygen (H2O2), and nitrogen species (NO2 − and NO3 −), per cycle applying three different types of bi- and monopolar discharges (bipolar flashover, positive and negative monopolar discharge).
Download figure:
Standard image High-resolution imageWhen comparing the effects of a positive discharge to the inlet, a decrease in ORP was observed, indicating a lower electron withdrawing properties of the concerned aqueous solution. This drop is due to the reactive species in the liquid phase formed due to the plasma discharged, as depicted in figure 4, lowering the concentration of oxidants. With the bipolar flashover discharge the highest concentrations among all species measured was exhibited.
On the other hand, the decrease in EC during the negative monopolar discharge is not easily explained since the values remained the same as the inlet measurements in other experiments, and EC always shows a constant trend over time. The wide range of inlet EC can be attributed to the varying EC of the tap water on different days.
Subsequently, the current and voltage of plasma pulses were measured and logged.
In figure 5, pulse characteristics of the three possible polarity configurations are shown. The positive signal has a higher current amplitude compared to the negative one. Additionally, the shape of the voltage monopolar peaks closely resembles that of the current peaks of corresponding polarities. However, the pulse duration of the flashover discharge was approximately 100 times shorter than that of the monopolar discharge, with respective values of around 0.6 μs and 60 μs.
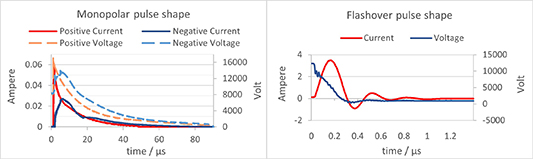
Figure 5. Pulse characteristics for current and voltage for three different types of bi- and monopolar discharges (bipolar flashover, positive and negative monopolar discharge), when using a 2000 pF capacitor.
Download figure:
Standard image High-resolution imageDespite the shorter duration, the amplitude of the flashover current pulse was significantly greater than that of the monopolar discharges. Specifically, the flashover current pulse had an amplitude of 3.4 A, while the positive and negative polarities of the monopolar discharges had amplitudes of 60 mA and 30 mA, respectively. The oscillations in the breakdown current signal can be discussed in terms of an RLC circuit, which can be defined by its resistance (R), inductance (L), and capacitance (C). All RLC circuits operate at a resonant frequency  , which can be calculated using equation (1) [40],
However, for the flashover pulses the resistance was low due to the formation of the plasma channel between the cathode and anode through the gas-water interface, which led to the damped oscillations, as illustrated in figure 5. In the case of monopolar discharges, the resistance was high, and the electrical signal was critically damped, making it impossible for the system to oscillate [40].
As electrical energy is a product of current, voltage, and time, these measurements hold significant relevance, as shown in equations (2) and (3),
and

where Ep is the energy per pulse in Joules and can be calculated using a discrete Fourier transform, N is the pulse length, n is the length of discrete Fourier transform, f is the pulse repetition rate in Hertz, P is the power of the plasma discharge in Watts, Iij represents the current in amperes and Vij denotes the voltage in volts of the pulse at time t, which can be calculated using equation (4),

where Δtj is the time step of a discrete Fourier transform for the certain pulse j in seconds, and i is the current step number in a Fourier transform. The second sum in equation (2) is the sum over the pulse length. To obtain the average pulse energy, it must be divided by the pulse length N.
Applied energy density (W) in kWh m−3 for specific regimes can be calculated using equation (5),
where  is the treatment time is seconds,
  is the reactor volume in m−3. For the described experiments the volume was 1.3 l or 0.0013 m−3.
  in the denominator represents the amount of joules in 1 kWh.
The pulse repetition rate for both positive and negative polarity was 396 Hz. For the flash discharge it was 378 Hz. In figure 6, the energy characteristics of the three polarity configurations are depicted. Notably, the plasma pulse energy for the positive polarity is the highest at 5 mJ, followed closely by the negative polarity at 4 mJ. Comparatively, the flashover pulse energy is the lowest, amounting to 3 mJ.

Figure 6. Energy per pulse and plasma power characteristics three different types of bi- and monopolar discharges (bipolar flashover, positive and negative monopolar discharge), when using a 2000 pF capacitor.
Download figure:
Standard image High-resolution imageSimilarly, the power characteristics exhibit the same trend, with the positive pulse having the highest power output at 1.8 W, followed by the negative pulse at 1.6 W, and the flashover pulse registering the lowest power at 1.2 W.
In the comparative analysis, it became evident that the flashover discharge has significantly higher efficiency compared to monopolar plasma discharges. It causes more significant changes in the water chemical properties, such as pH, ORP, and EC. These changes serve as indirect indicators of the production rate and dissolution of reactive species, as corroborated by the findings presented in figure 4, which shows a similar trend. Figure 4 demonstrates that the flashover discharge was more effective in generating both ROS and RNS. Additionally, the energy measurements of plasma pulses in figures 5 and 6 revealed that the flashover discharge required less energy than negative and positive polarity plasma pulses. This fact is attributed to the flashover pulse having a significantly shorter duration and a higher amplitude, resulting in less energy dissipated as heat and light emission.
The shorter pulse duration of the flashover regime gives neutral gas molecules less time to dissipate received energy through molecular vibrations, resulting in a higher chance of ionization and increased production of reactive species. Moreover, the flashover discharge creates a plasma channel between two electrodes of different polarities directly on the plasma-water interface, with a length of about 5 cm (as illustrated in figure 3). This phenomenon significantly increases the plasma-water interface compared to monopolar pulses, leading to enhanced production of reactive species directly in or close to the liquid phase.
3.2. Different capacities
Modifying capacitors in the electric circuit significantly impacts pulse characteristics. The pulse repetition rate for the 1000 pF capacitors was 425 Hz. For the 2000 pF it was 378 Hz. Figure 7 shows the difference between the plasma pulses produced by 2000 pF and 1000 pF capacitors. Using 2000 pF capacitors resulted in a larger current amplitude and a slightly longer pulse duration than using 1000 pF capacitors. Furthermore, the increased capacity of the 2000 pF capacitors allowed them to store more electrical energy, leading to a higher energy release during the pulse discharge. As a result, there was an increase in pulse energy and power for the plasma discharge when 2000 pF capacitors are utilized.
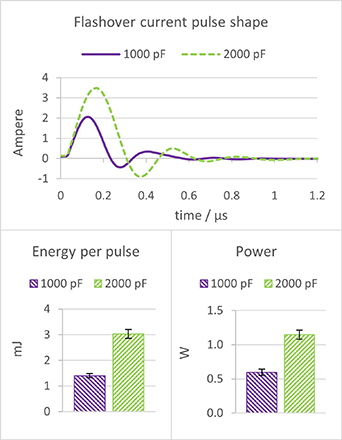
Figure 7. Pulse current, energy per pulse, and plasma power characteristics for two different capacitors, 1000 pF and 2000 pF, respectively.
Download figure:
Standard image High-resolution imageFigure 8 shows a notable decrease in pH when using a 2000 pF capacitor, compared to the incoming water flow, indicating a shift towards increased acidity. Additionally, a marginal increase in EC is evident within the range of experimental error. The ORP of the water treated with plasma created by 2000 pF capacitors was significantly higher than that treated with plasma from 1000 pF capacitors. This data proves that utilizing larger capacitors results in generating a higher amount of RONS.
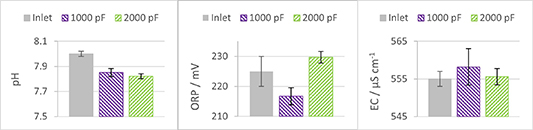
Figure 8. Change in the water chemical properties, pH, ORP and EC for two different types of capacitors, 1000 pF and 2000 pF, respectively.
Download figure:
Standard image High-resolution imageOn the other hand, the lowest concentration of reactive species is expected with the use of 1000 pF capacitors, as the treatment with plasma created by these capacitors showed the smallest change in pH (indicating fewer RNS) and no distinct increase in ORP (indicating fewer oxidants) compared to 2000 pF capacitors. It should also be noted that variable pulse energy and pulse repetition rate at equal total energy input might result in different plasma chemistry, because in this case the plasma homogeneity and, therefore, the species created can be different.
Figure 9 shows the reactive species concentrations in the liquid phase, confirming that the highest concentration increase was indeed observed for hydrogen peroxide. However, in contrast to the higher ORP and the generation of more RONS with plasma created by 2000 pF capacitors, 1000 pF capacitors demonstrated a higher energy efficiency. This can be explained by the fact that there is more heat dissipation for 2000 pF. As depicted in figure 9, when using 1000 pF capacitors, it was possible to create a greater quantity of all measured species while expending the same amount of energy, compared to the results obtained with 2000 pF capacitors.

Figure 9. Observed concentrations and production efficiencies for some RONS per cycle for two different types of capacitors, 1000 pF and 2000 pF, respectively and negative.
Download figure:
Standard image High-resolution imageReplacing the capacitors changes the energy stored and released as a plasma discharge, thus affecting the pulse amplitude and duration of the plasma discharges. Larger capacitors produce more reactive species and are more effective (in terms of time). However, smaller capacitors are more energy-efficient, although they may require longer treatment times to achieve the same production rate as larger capacitors.
3.3. Number of electrodes
Figure 10 shows the decrease of pH over treatment time, which was less evident for the setup with two electrodes compared to the configuration with 16 electrodes, suggesting that a lower number of electrodes corresponds to a lower RNS production in the liquid phase, since these are mainly responsible for acid formation and thus a decrease in pH. Both configurations exhibited an ORP stabilization at approximately 600 mV.
On the other hand, the EC increased due to the treatment, but in the case of two electrodes, this increase is almost half of what is observed with 16 electrodes. This disparity implies that a smaller number of electrodes results in a lower production of ions.
Subsequently, figure 10 illustrates the concentrations of nitrite, nitrate, and hydrogen peroxide in the liquid phase after 20 min of treatment. The configuration with two electrodes resulted in concentrations nearly half of those found with a configuration with 16 electrodes.
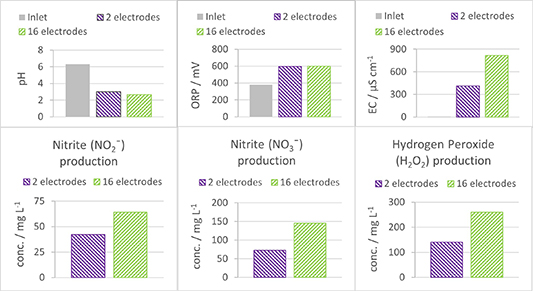
Figure 10. Change in the water chemical properties, pH, ORP, EC, production of reactive oxygen (H2O2), and nitrogen species (NO2 − and NO3 −) after 60 min of treatment for two electrode configurations: the one with two electrodes and the other with 16 electrodes.
Download figure:
Standard image High-resolution imageThis result means that an increase in the number of electrodes or the plasma-water interface leads to an increase in the formation of reactive species without changing the plasma discharge power. A similar trend has been observed previously by other authors [41]. By increasing the plasma-water interface, these other authors significantly improved the degradation rate of PFAS molecules.
3.4. Different atmospheres
Since a plasma consists of exited state and ionized gas molecules and atoms, it is expected that different gas compositions impact the plasma characteristics and thus subsequently also the formation of reactive species in the liquid phase. The results of a series of experiments with different atmospheres showed indeed significant differences in the water chemical properties after 60 min of treatment, particularly when air is compared to N2 and Ar (figure 11). Using air resulted in notably higher concentrations for certain species (150 mg l−1 for NO2 −, 574 mg l−1 for NO3 − and 760 mg l−1 for H2O2). In a N2 atmosphere, nitrate became the most abundant reactive species transferred to the liquid phase (240 mg l−1). Notably, nitrite was not detected, potentially this species were only serving as an intermediate in nitrate formation. Only a minor amount of hydrogen peroxide was present in the liquid phase under this condition (15 mg l−1). Contrary, using an Ar atmosphere, hydrogen peroxide emerged as the most abundant reactive species in the liquid phase (180 mg l−1), accompanied by a small amount of nitrate (24 mg l−1), corroborating the observed pH decrease, and supporting the assumption of residual air in the gas and liquid phases during the initial stages of the experiment.
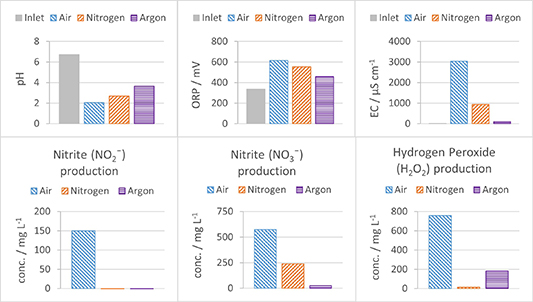
Figure 11. Change in the water chemical properties, pH, ORP, EC, production of reactive oxygen (H2O2), and nitrogen species (NO2 − and NO3 −) after 60 min of treatment for three different gas compositions: air, N2 and Ar.
Download figure:
Standard image High-resolution imageVarying the atmosphere in the reactor enables manipulation of plasma characteristics like pulse energy, signal shape, pulse duration, plasma-water interface area, as well as the type, concentration, and mechanism of reactive species production (figure 11). The absence of a gas flow during air treatment led to significant changes in water chemical properties, while a continuous N2 or Ar supply maintained a stable gas composition but resulted in lower concentrations of reactive species due to purging RONS from the reactor. Also, the lower formation of reactive species for N2 and Ar was due to the lack of O2. It can only transfer energy to water and water vapor via excited states and energetic ions. Creating plasma discharge. A plasma discharge only in a N2 atmosphere without O2 significantly decreased the formation of reactive species in the gas phase due to the impossible generation of ROS and most RNS, both having O2 in their molecular structure. Only the reaction between N2 excited states and ions with water vapor and water surface can explain the formation of small amounts of RNS. The observed variations in pH, ORP, and EC for different atmospheric conditions can be related to the formation of different types and amount of reactive species.
3.5. Pharmaceutical matrix treatment
Figure 12 illustrates the analysis of pharmaceutical matrix treatment using plasma from two types of capacitors, one with a capacitance of 1000 pF and the other with 2000 pF. The matrix, comprising various types of pharmaceuticals, underwent treatment for 30 min. Remarkably, the Diclofenac concentrations dropped below the detection limit (<0.05 μg l−1), showcasing a removal efficiency of at least 99.3%. Similarly, the low concentrations of Ibuprofen and Naproxen, both belonging to the therapeutic group analgesics/non-steroidal anti-inflammatory drugs, showed high levels of degradation, surpassing 70%. Hydrochlorothiazide, classified as a diuretic, and Carbamazepine, an anti-epileptic drug, were removed with a comparable efficiency of around 70% and 60%, respectively. These results are interesting especially for Carbamazepine, which is known to be a highly persistent micropollutant. In contrast, two antibiotics, namely Ciprofloxacin and Metronidazole, could only be removed by 50% and 35%, respectively.
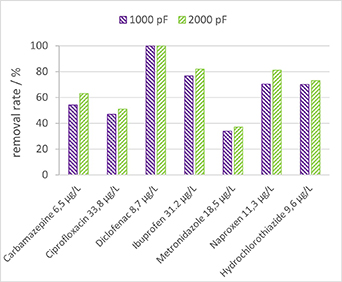
Figure 12. Removal of pharmaceuticals after 30 min treatment for two different types of capacitors, 1000 pF and 2000 pF, respectively.
Download figure:
Standard image High-resolution imageThe results indicate that 2000 pF capacitors generally provide better removal rates for most pharmaceuticals than the 1000 pF capacitors. However, it is crucial to consider the energy consumption associated with these capacitors, as shown in section 3.2. The energy costs associated with plasma treatment for removing pharmaceuticals, as indicated in figure 12, are 0.45 kWh m−3 when using 2000 pF capacitors, and 0.25 kWh m−3 for 1000 pF capacitors. It should also be noted that reported energies are imposed energy densities, which result in a certain conversion level, but not always full conversion.
This finding implies that while the 2000 pF capacitors may achieve higher removal rates, the overall removal efficiency in terms of energy consumption was lower compared to the 1000 pF capacitors (55 pmol J−1 for 1000 pF and 29 pmol J−1 for 2000 pF capacitors).
Figure 13 illustrates the outcomes of a pharmaceutical matrix treatment using both types of capacitors but the same plasma energy of 850 J l−1 or 0.25 kWh m−3, results in varying treatment times for each capacitor.
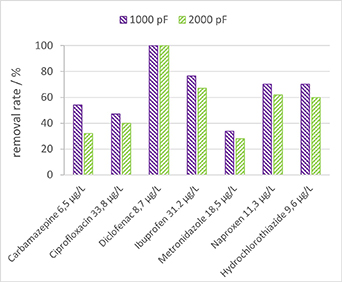
Figure 13. Removal of pharmaceuticals for two different types of capacitors, 1000 pF and 30 min treatment and 2000 pF and 15 min treatment.
Download figure:
Standard image High-resolution imageThe results from figure 13 indicate that the plasma generated with 1000 pF capacitors provides a higher removal efficiency. However, this increased removal efficiency comes at the expense of increased treatment time compared to the plasma produced by 2000 pF capacitors.
These results highlight the importance of the capacitor selection process (i.e. treatment energy) in micropollutant degradation, as it requires a careful evaluation of the trade-off between removal efficiency and energy consumption, necessary to determine the most sustainable and cost-effective micropollutant treatment, as well as, considering the specific type of contaminant. Nonetheless, a remarkable rate of removal for persistent pharmaceuticals was achieved at a cost of less than 0.3 kWh m−3, which is lower than the energy consumption of established procedures [42, 43].
3.6. PFAS degradation
Figure 14 illustrates the treatment of PFOS at an initial concentration of 80 mg l−1 using different capacitors and treatment times. The energy costs associated with plasma treatment for 60 min are 0.9 kWh m−3 when using 2000 pF capacitors, and 0.5 kWh m−3 for 1000 pF capacitors. In line with section 3.5, plasma produced by 2000 pF capacitors provided a higher removal rate than plasma produced by 1000 pF capacitors for the same treatment time. However, when considering removal efficiency, the 1000 pF capacitors performed better. This becomes evident when comparing the results of 2000 pF capacitors, using 60 min of treatment time, resulting in a removal efficiency of 29 nmol J−1, to 1000 pF capacitors, with 60 min of treatment time and a removal efficiency of 47 nmol J−1. When comparing 2000 pF capacitors and 30 min of treatment time to 1000 pF capacitors and 60 min of treatment time, the plasma energy was the same (1660 J l−1), but the PFOS removal rates were different, 62% and 66%, respectively. Notably, the highest removal rate (77%) was achieved when using 2000 pF capacitors for 60 min.
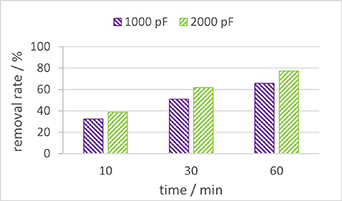
Figure 14. Removal rate of PFOS at a concentration of 80 mg l−1 for two different types of capacitors, 1000 pF and 2000 pF and different treatment times: 10 min, 30 min and 60 min.
Download figure:
Standard image High-resolution imageA similar trend is visible in figure 15, which shows the defluorination of treated PFOS. Fluorine atoms constitute approximately 65% of the total molar mass of the PFOS molecule. By measuring the fluoride concentration in the solution, the total mass of defluorinated PFOS can be calculated using equation (6),


Figure 15. Defluorination rate of PFOS at a concentration of 80 mg l−1 for two different types of capacitors, 1000 pF and 2000 pF, respectively, and different treatment times: 10 min, 30 min and 60 min.
Download figure:
Standard image High-resolution image
where  represents the measured fluoride concentration in g l−1. The PFOS molecule contains 17 fluorine atoms with a molar mass of 19 g mol−1. The molar mass of the PFOS molecule is 500.13 g mol−1. Again, the most significant defluorination rate of over 23% was achieved when using 2000 pF capacitors for 60 min.
In this way, a remarkable rate of removal for PFOS was achieved at a cost of less than 1 kWh m−3. In comparison, other removal technologies such as ultra-sonication, microwave-hydrothermal processes, or UV treatment demand energy inputs on the order of thousands of kWh m−3, electrochemical oxidation, in contrast, exhibits energy costs potentially below 100 kWh m−3, which are considered relatively low for effectively addressing PFAS removal from water [18], but still orders of magnitude higher than the energy demand of the technology presented in this work.
Furthermore, it is worth noting that plasma-based technologies are commonly applied at a small laboratory scale. While numerous studies explore plasma water treatment, few have transitioned to pilot projects [30, 44, 45]. One of the biggest challenges is scaling this technology. However, the utilization of a hyperbolic vortex plasma reactor significantly facilitates this process by simply increasing the dimensions of the funnel, particularly its upper cylindrical section. This scaling allows to increase the gas-liquid interface as well as the number of electrodes, thereby increasing the plasma-water interface and dissolution of RONS. Accordingly, it is necessary to increase the power of the power supply and, if necessary, the capacitance in the electric circuit to produce more oxidizing agents and ensure adequate energy for effective treatment process. Importantly, this setup is robust against known issues like clogging. However, the flash mode could potentially damage the reactor or electrodes and introduce metal ions into solution. This should be investigated in further publications.
4. Conclusion
We have shown that the combination of a hyperbolic vortex with plasma treatment technology is effective in degrading a broad spectrum of micropollutants, pharmaceuticals, and even the most persistent PFAS compounds while requiring significantly less energy than comparable methods. Also, the hyperbolic vortex plasma reactor can easily be upscaled for industrial needs. The key challenge of this method is its optimization, dependent on the nature of the target species. This study examines the effects stemming from altering atmosphere, plasma pulse duration, energy input, power levels, treatment time, and polarities. The flashover discharge mode exhibits higher efficiency and more efficient production of reactive species compared to monopolar plasma discharges.
Changing the atmosphere in the reactor allows controlling the characteristics of the plasma, and the rate and mechanism of reactive species production. Gas compositions containing both N2 and O2 show a more significant change in the water chemical properties and the production of ROS and RNS. The use of Ar leads to the formation of predominantly ROS, using pure N2 increases the formation of RNS.
A careful consideration of capacities is essential to optimize the balance between removal efficiency and energy consumption. In the described system, the plasma produced by the larger capacitors (2000 pF) was able to degrade micropollutants faster. However, a reactor with smaller capacitors (1000 pF) exhibited higher energy efficiency but required a longer treatment time.
Acknowledgments
This work was performed in the cooperation framework of Wetsus European Center of Excellence for Sustainable Water Technology (www.wetsus.eu) within the Applied Water Physics theme. Wetsus is cofounded by the Dutch Ministry of Economic Affairs and Ministry of Infrastructure and Environment, The Province of Friesland and the Northern Netherlands Provinces. This research has received funding from the European Union's Horizon 2020 research and innovation program under the Marie Sklodowska-Curie Grant Agreement No. 665874 and the Gilbert—Armstrong lab. During the preparation of this work, the authors used OpenAI (2023) ChatGPT (version 3.5) [Large language model] in order to structure text and DeepL SE (2023) DeepL API [Document translation application programming interface] for a stylistic text translation. After using these tools, the authors reviewed and edited the content as needed and take full responsibility for the content of the publication.
Data availability statement
All data that support the findings of this study are included within the article (and any supplementary files).
Conflict of interest
The authors declare that they have no known competing financial interests or personal relationships that could have appeared to influence the work reported in this paper.