

Abstract
We study the spatial distribution of dynamical properties in a strongly coupled confined experimental dust monolayer with a dense central region and a rarefied periphery. We show that the dust particle oscillations spectrum shifts into the low-frequency range from the center of the structure toward its periphery. Correspondingly, the high-frequency particle oscillations are localized in the central region of the system. This effect is quantitatively described within the framework of the model system of trapped screened Coulomb charges. Such spatial localization has a significant effect on the spatial distribution of dynamical parameters, such as the amplitude of particle oscillations and the coupling parameter. The obtained results might be useful for the theory of crystal formation, instabilities and phase transitions in complex (dusty) plasmas, colloidal suspensions, and Coulomb crystals.
Export citation and abstract BibTeX RIS
1. Introduction
Micron-sized particles, when injected into a plasma, acquire a high electrical charge and form an additional strongly coupled component of the plasma, the so-called dust subsystem. Systems of such particles are actively studied both in a laboratory environment and under conditions of practical interest, mostly in plasma technological devices and in space [1–11].
In ground-based experiments, a dust subsystem in a plasma can evolve into a horizontal planar disk-shaped dust structure, whose dynamics can be resolved on an individual particle level [2, 4, 10, 12–14]. Availability for direct observation of such structures under different plasma conditions makes them a good media for the investigation of a variety of physical effects, including phase transitions [15–19], transport [20–26] and wave [27–30] phenomena, spectral properties [31–33], space plasmas [34–37]. These studies are usually conducted regarding only the central—close to uniform—region of the dust crystal.
As the further experiments show, the central region of a planar dust structure might have different particle number density compared to the rest of the structure. Hariprasad et al observed the system with a  times higher inter-particle separation at the periphery than in the center of a planar dust structure of 368 particles [14]. Similar inhomogeneity is shown by Liu et al for a one-dimensional chain of 28 dust particles—the inter-particle separation grows by
  times outward [38]. In a recent study, Alekseevskaya et al observed both uniform and non-uniform quasi-two-dimensional dust structures [39]. They demonstrated that variation of plasma parameters might have a significant effect on the type of observed non-uniformity: the central region might be more compact or more rarefied than the periphery.
The spatial inhomogeneity of the structure can lead to the emergence of unique phenomena [40–44]. Yurchenko et al observed the effect of inhomogeneous melting of a planar dust structure [40]. In the experimental system, melting starts from the dense central region of the structure and expands outward in the form of a sharp front due to the development of the mode coupling instability (MCI) [45–48]. This effect, which is compared to the process of flame propagation, can be explained by the presence of density gradient in the system as soon as the conditions for the MCI development are density-dependent [46, 49, 50]. Hariprasad et al observed the self-sustained non-equilibrium co-existence of a three-layer fluid region in the center and a planar solid region at the periphery of the dust system [42]. The multi-scale simulations supporting the experimental observations show that the melting of the central region is due to the Schweigert-type instability which develops locally [51]. The mentioned experimental observations indicate a strong effect of the spatial inhomogeneity on the behavior of dust structures.
The theoretical studies of the spatial inhomogeneity in such systems are conducted considering the model system of harmonically trapped screened Coulomb charges [41, 52–56]. In this model in the case of strong screening, the particle number density drops parabolically from the center of the structure toward the periphery. This model allows to obtain a good agreement with the experimentally measured density profile in a planar dust system [14, 57]. The dynamical properties, such as the amplitude of thermal oscillations and the Lindemann parameter, monotonically increase in the radial direction of the model system [57]. This effect has not been confirmed experimentally yet. For example, in [14] the radial profile of the oscillation amplitude is close to uniform due to the inhomogeneous heating of the experimental structure. Another prediction of interest that follows from the theoretical model is that the value of the highest available frequency of particle oscillations should monotonically drop outward the structure [58]. This unusual effect should reveal itself in the corresponding shift of the vibrational spectrum into the low-frequency range at the periphery of the system. In the present work, this effect of spatial localization of high-frequency particle oscillations is confirmed experimentally in a planar dust structure. We also demonstrate non-uniform radial profiles of both inter-particle separation and oscillation amplitude in the experimental system. The experimental observations are supported by the numerical simulations of the dust subsystem that confirm the significant effect of spatial non-uniformity of the structure on the vibrational properties of the system.
In this work, we use the 'Zyflex' plasma chamber to investigate the spectral properties of a planar dust structure [43]. This experimental setup is designed for studying the structural and dynamical properties of two-dimensional and 3D dusty structures in a gas-discharge plasma.
This work is organized as follows. Section 2 presents the experimental setup. Section 3 shows the dust structure and the analyzed properties of interest, such as the inter-particle separation, the amplitude and average kinetic energy of oscillations, and the coupling parameter. In section 4, we describe the experimentally observed effect of spatial localization of high-frequency particle oscillations in the structure. The effect is demonstrated via the analysis of both phonon and vibrational spectra. We propose a quantitative relationship between the screening parameter and the highest available frequency of particle oscillations.
2. Experimental setup
Spatial localization of high frequency particle oscillations was experimentally investigated in a planar dusty plasma crystal, levitating in capacitively coupled discharge that is driven at 13.56 MHz in argon at the pressure 1.3 Pa and is created in a 'Zyflex' plasma chamber designed for experiments with complex plasmas [59]. The chamber has four side and one top windows made from anti-reflective coated BK-7 glass for optical access. All major metal parts are manufactured from aluminum to prevent magnetic influences. An modified electrode with a diameter of 114 mm, surrounded by a grounded guard ring, allows to create monolayer dust structures containing about a thousand microparticles. Monodisperse polymer microparticles of melamine-formaldehyde, ρ = 1.51 g cm−3, with a diameter of 7.17 µm are injected into the glowing discharge by an electromagnetic dispenser. The number of microparticles injected into the discharge is controlled by the duration of the application of the voltage to the electromagnet, and the number of injections. A 2 mm-thick aluminum ring on top of the electrode induces an additional horizontal electrostatic potential confining the motion of microparticles in the central region of the discharge.
Microparticles were illuminated by a 3–W 520 nm laser. A system of cylindrical lenses provided a flat laser beam with a adjustable thickness in the range of 1.5–3.5 mm in the field of view of the video cameras. Tracing of microparticles was carried out by an optical system [43] consisting of four synchronized high speed (180 fps) and high resolution ( ) cameras located above the top window of the plasma chamber (figure 1). Such a system allowed us to determine 3D trajectories of microparticles with good spatial and temporal resolution for several minutes.
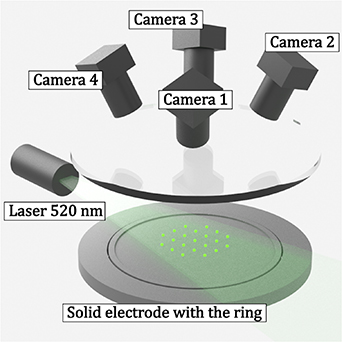
Figure 1. The scheme of the 'Zyflex' plasma setup. The optical system consisting of four synchronized high speed (180 fps) and high resolution (2048 × 2048) cameras located above the top window of the plasma chamber and directed to the center of the electrode.
Download figure:
Standard image High-resolution imageTo determine the position of the particle images on each frame with a subpixel accuracy, a known method of particle identification in dusty plasma experiments [60–63] was applied. The method is based on the separation of a group (cluster) of pixels corresponding to each individual microparticle. In this case, the 2D coordinates of the microparticle are calculated as weight-averaged coordinates of these pixels with their brightness used as their weight.
3D coordinates were determined by triangulating the position of the particles from their images on two mutually calibrated cameras [64]. We used a four-camera stereo diagnostic system to facilitate a search of unambiguous correspondence of dust particles with their images on video cameras [43, 65]. The search for images of microparticles on different cameras was carried out using the tools of epipolar geometry [66]. Triangulation of the position of the particles was carried out using images from the cameras most distant from each other to reduce error in determining the coordinates.
3. Experimental data processing
In the present work, we observe planar dust structures of 223 and 848 particles for 2 min. Below, we demonstrate the structure of N = 848 particles due to the similar results for both systems. The structure is disk-shaped and has a triangular crystalline structure in the central region, while in the periphery the structure is shell-like. Such a structure is typical for a two-dimensional system of trapped screened charges of  particles [32, 53]. We are assured of the planar form of the dust structure via 3D diagnostics, which is described in section 2.
The structure of the observed planar dust system is demonstrated in figure 2. Notice the decrease of the particle number density from the center of the system toward its periphery. To consider this inhomogeneity, we group particles into several close to uniform regions of the structure. In the observed structure, the particle number density n(R) depends on the radial distance R as  , where a and b are constant values. This parabolic form of the density profile is typical for a harmonically trapped system of screened charges [53, 54]. We divide the range of radial distances into intervals, in each of which the particle number density is close to constant.
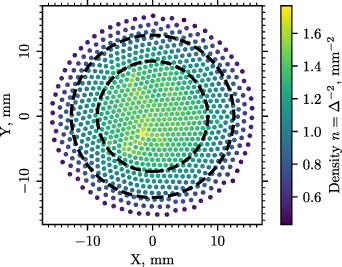
Figure 2. The structure of the observed spatially inhomogeneous dust system. The dots denote dust particles. For clearness, particles are colored according to the value of numerical density. Circular dashed lines are drawn to distinguish different quasi-homogeneous regions of the system. The sizes of the drawn particles do not indicate the sizes of the observed particles. Data analysis and visualization are made via Python packages Numpy [68] and Matplotlib [69].
Download figure:
Standard image High-resolution imageIn figure 2, dashed concentric circular lines denote the splitting of the structure into 3 groups with a close to constant particle number density. Such a partition of a spatially inhomogeneous system allows study of its structural and dynamical properties in a local approach [50, 57, 58, 67].
For the analysis of dynamic properties of the dust system, we remove the inherent rotation of the structure as a whole from the experimental particle trajectories. The procedure of the rotation removal is described in appendix
3.1. Radial profiles of structural and dynamical properties
The radial profile of the inter-particle distance Δ, which is obtained via (B.1) (see appendix  µm at the center of the system to
  µm at the periphery. A similar growth of the inter-particle distance is demonstrated by Hariprasad et al in [14]. In both cases, the particle number density profile is close to parabolic, which is predicted by Totsuji for a system of harmonically confined screened Coulomb charges [53].

Figure 3. Radial profiles of experimentally measured properties. The dots denote averaged by quasi-homogeneous region values. (a) The inter-particle distance Δ monotonically grows from the center to the periphery of the system. (b) The amplitude of oscillations  monotonically grows from the center to the periphery of the system. (c) The average kinetic energy T is close to the constant value
  K in the system. (d) The coupling parameter
  monotonically drops from the center to the periphery of the system.
Download figure:
Standard image High-resolution imageThe average kinetic energy of dust particles, which is calculated via (B.6), is close to the constant value  K throughout the experimental dust structure (figure 3(c)). This value of temperature coincides with that fitted from the Maxwellian distribution (figure B1). It is noteworthy that the kinetic energy of vertical oscillations coincides with the kinetic energy of the in-plane oscillations in our experimental dust structure. Such a uniform profile of the particle kinetic energy and low heating above the room temperature in the present work allow to exclude from consideration a variety of physical effects that might lead to the anomalous heating of the dust subsystem [70–72].
The particle oscillations amplitude, which is obtained via (B.5), in the experimental structure in this work increases monotonically from  µm at the center of the system to
  µm at the periphery (figure 3(b)). The values of thermal particle oscillations amplitude were also estimated in [14] in different regions of a planar dust structure. They obtained a close to uniform radial profile of the characteristic that differs from the nonuniform profile calculated here. This difference can be explained by the difference between radial profiles of the kinetic energy of particle oscillations that are calculated here in figure 3(c) and in [14].
Finally, the coupling parameter, which is calculated via (B.7), monotonically drops from the center ( ) to the periphery of the structure (
 ). A similar decrease of the modified coupling parameter with an increase of the radial distance is observed in a model system of harmonically trapped screened charges [57]. As soon as the coupling parameter indicates the phase state of the system, its non-uniformity in the structure demonstrates the possibility of a nonuniform melting of the system [49]. The critical value
  was theoretically predicted as the melting point in a two-dimensional system of screened charges [73]. In our experimental structure, the value of
  is far above the theoretical
  throughout the system.
3.2. Theoretical model of the experimental system
In terms of theoretical description of the experimentally observed dust structure, we rely on the simplified form of the particle interaction model. The employed model includes the screened Coulomb potential and the parabolic electrostatic trap. The main reasons for employing this interaction model are determined by the structural and dynamical properties of the experimental system. First, the particle number density radial profile has a parabolic form which is typical for a system of harmonically trapped screened charges [41, 53, 54, 57, 67]. Second, the radial profile of the particle kinetic energy is uniform, and the kinetic energy of particles can be, in the first approximation, described by the interaction of particles with a spatially uniform thermostat.
The screened Coulomb potential can be derived from the Poisson equation in the case of weakly charged particles [10, 74]
where Q is the electrical charge of a particle, κ is the screening parameter, Rij is the distance between interacting particles i and j. High values of the dust particle charge under experimental conditions do not allow linearization of the Poisson equation and derivation of (1). Nevertheless, the screened Coulomb potential can still be applied as the first approximation to describe the interaction of dust particles, but with the effective, not real values of κ and Q [6, 14, 75–78].
Since the potential (1) is repulsive, in real systems the electrostatic trap is applied to confine particles from the expansion. We consider the parabolic form of the trap potential  :
:
where α is the trap parameter, Ri is the radial distance of the ith particle. Generally, the form of the trap profile can deviate from the parabolic outside the central region of the system. The deviation might be related to the non-uniformity of the discharge plasma and the effect of dust particles themselves on the trap profile. At the same time, in the works [79, 80], it is demonstrated that close to the center of a dust structure the radial component of the electric field often has a linear dependence on the radial distance in the region of the dust structure's existence. For this reason, the parabolic trap might serve as a good first approximation for the account of external confinement acting on dust particles.
A body of complex effects cannot be considered in the simplified interaction model including the screened Coulomb potential and the parabolic trap. Such effects are the ion drag force [81–84], the shadowing effect [85], the thermophoretic force [86], and the plasma wake effect [87, 88]. Since we assume constant and uniform particle charge Q and screening parameter κ, we neglect such effects as the particle charge and plasma density fluctuations.
Such simplifications are justified by the fact that the kinetic energy of particle oscillations in our experimental system has a uniform radial profile throughout the structure (see figure 3). The heating of dust particles motion, in this case, can be accounted for via the Nosé–Hoover thermostat in simulations. The resultant total energy of the system excluding thermostat terms is then
4. Spatial localization of the high-frequency particle oscillations in the experimental system
The spatial inhomogeneity of structural and dynamical properties of a dust system, which is observed in the present work as well as in [14, 39, 44], might play a crucial role when describing wave phenomena, transport processes and phase transitions in such systems. Non-uniformity of the structural properties mainly reveals itself in the presence of gradient of dust particle number density in the system. Under our experimental conditions, the presence of this gradient can be, in the first approximation, explained via the action of the trap force in the radial direction of the system and the strong screening of the interaction potential [41, 53, 54, 89] (section 3.2).
The inhomogeneity of dynamical properties can be considered via another parameter—the amplitude of thermal oscillations of particles. In our experimental structure, it also has a clearly non-uniform radial profile. In the quasi-harmonical approximation, the value of the oscillation amplitude is determined by the spectrum of particle oscillations [90, 91]. For this reason, spatial inhomogeneity of the spectrum could explain the inhomogeneity of the oscillation amplitude.
In a system of harmonically trapped screened Coulomb charges, the oscillation spectrum is shown to shift into the low-frequency range at the periphery of the structure [58]. This effect is referred to as the spatial localization of the high-frequency particle oscillations. In the present work, we observe a similar effect in the experimental dust structure via both phonon and vibrational spectra of particle oscillations. This result indicates that the experimental system is non-uniform not only in terms of density, but also in terms of its spectral characteristics.
4.1. Demonstration via the phonon spectrum
To observe the effect of spatial localization of high-frequency particle oscillations in the experimental dust structure, we calculate the phonon spectrum in separate quasi-homogeneous regions of the system. The implemented procedure is described in appendix
The phonon spectrum of particle oscillations in the central region of the system is demonstrated in figure 4. There are three dispersion curves in figure 4: one for horizontal longitudinal (compression-like) oscillations, one for horizontal transversal (shear-like) oscillations, one for vertical transversal particle oscillations [46].
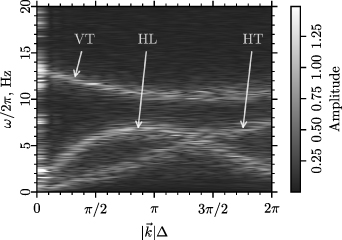
Figure 4. Phonon spectrum in the central fragment of experimental dust structure. There are three branches of dispersion curves: the horizontal longitudinal (HL) and transversal (HT) ones and the vertical transversal (VT) one.
Download figure:
Standard image High-resolution imageTo compare the value of the highest available frequency of particle oscillations in quasi-homogeneous regions of the experimental system, we plot the phonon spectra for three fragments of the system (see figure 5): the central one (a), the intermediate one (b), and the peripheral one (c). Dispersion curves are put into the plots along with the spectra (dashed curves). The procedure for obtaining dispersion curves is described in appendix
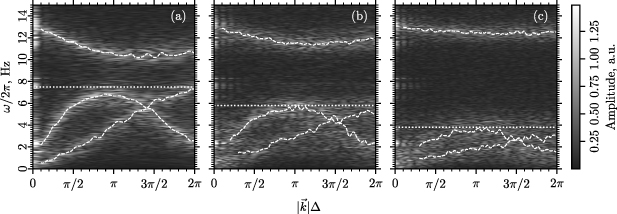
Figure 5. Dispersion curves in different regions of dust structure: central with  cm (a), intermediate with
  cm (b), and peripheral with
  cm (c). Horizontal dashed lines are drawn for the comparison of the highest available frequencies. The highest available frequency drops from the center to the periphery.
Download figure:
Standard image High-resolution imageEach subplot in figure 5 contains a dotted horizontal line. This line denotes the highest available frequency of in-plane particle oscillations in the selected region of the structure. Notice that the highest available frequency drops monotonically from the central region of the dust structure toward its periphery.
Let us consider the gap between the highest frequency of in-plane oscillations and the lowest frequency of out-of-plane oscillations in figure 5. The value of this gap increases from the center of the system toward its periphery. It means the closer the region to the center of a dust structure, the closer this subsystem is to the possible MCI development [46]. Since the described gap is far above zero in our experimental system, there is no coupling of horizontal and vertical dust particle motion and, thus, no MCI effect.
4.2. Demonstration via the vibrational spectrum
The effect of the spatial localization of particle oscillations can also be clearly demonstrated employing the vibrational density of states (VDOS). The vibrational spectrum is calculated from the experimental data and refined via the procedure that is described in appendix
The obtained experimental and theoretical vibrational spectra are shown in figure 6. Notice the difference of the highest available frequency of particle oscillations bounding the oscillation spectrum in different regions of the experimental system. It can be seen that the highest available frequency monotonically decreases from the central region of the dust structure toward its periphery. Thus, analysis of the vibrational spectra confirms the result obtained using the phonon spectra.

Figure 6. Oscillation spectra (VDOS) in different regions of a dust structure: central with  cm (a), intermediate with
  cm (b), and peripheral with
  cm (c). Vertical dotted lines denote the highest available frequencies, which are obtained from dispersion curves (figure 5). Thick solid lines denote VDOS in the experiment, thin dashed lines denote VDOS in the MD simulations. Lines are slightly smoothed for clarity. The spectra are cropped at 10 Hz, since the effect of the spectrum shifting is located below 10 Hz.
Download figure:
Standard image High-resolution imageThe accuracy of evaluation of the highest available frequency is limited by the form of the spectrum 'tail', which is blurred for all the spectra in figure 6. We calculate the highest available frequency within a several Hz error, which is comparable with the results that are obtained via the phonon spectrum in section 4.1.
Finally, let us compare the vibrational spectra of the crystal subsystems in the experimental dust structure and in the model MD structure. In each region there is a good accordance of the spectra forms, and we can see both compression- and shear-like types of oscillations that are typical for a screened Coulomb system [92]. Thus, MD simulations allow us to justify the applicability of the screened Coulomb potential along with the central parabolic trap for the explanation of the spectral properties of the experimental system. A certain mismatch is related to the error in the estimation of the experimental system parameters.
4.3. Profile of the highest available frequency
As we show in the previous sections, the value of the highest available frequency of particle oscillations  decreases with the growth of inter-particle distance outward the experimental dust structure. In this section, we obtain the dependence of
  on the inter-particle distance so that this dependence can be immediately used in the analysis of experimental data. As soon as our system is strongly screened (
 ) and particles mostly interact with their nearest neighbors, we assume that the density dependence of the highest available frequency in the finite system of charges can be directly transferred from the infinite system without an applied trap. To confirm this assumption, we conduct MD simulations of a spatially homogeneous system of screened Coulomb charges in periodic boundary conditions (PBCs) so that the total energy, excluding the thermostat terms, is similar to (3):
where N is the number of particles, Rij
is the distance between particles i and j, Q and κ are the particle charge and the screening parameter, respectively. We conduct simulations with several values of Q and κ. For each pair of Q and κ, we additionally vary the value of inter-particle distance Δ so that the value of  lies in the range from 1 to 5, i.e. in the range corresponding to the strong screening of the interaction potential.
We obtain values of the highest available frequency of particle oscillations  for each simulated system in PBC at particular values of Q, κ and Δ. The procedure of the calculation of
  is described in appendix
  is reduced by the value of the Einstein frequency
  , which is evaluated by the method discussed in [93]. First, for a given value of
  , the values of
  are almost identical among the different systems that differ in Q and κ. Second, the values of
  are almost constant in range of
  . The values of
  , which are obtained from each system in PBC, are plotted versus
  in figure 7 in an averaged manner. The circles denote the average values of
  that are calculated for systems with different values of
  and identical values of
  .
.

Figure 7. The value of the highest available frequency reduced by the Einstein frequency  as a function of unitless screening parameter
  does not depend on the system parameters Q and κ. The solid circles denote analytically calculated values of
  in several systems of screened charges in PBC with different parameters Q and κ. Error crosses denote the mean standard deviation of values. Dots are connected with a dashed line for clarity. The open squares denote experimentally measured values of
  , which are in a good accordance with theoretical results.
Download figure:
Standard image High-resolution imageThe considered systems of screened charges in MD in this section are spatially uniform and have a triangular lattice, which is similar to the lattice in a quasi-homogeneous fragment of the system of screened charges in a trap. In cases where the particle number density in the quasi-homogeneous fragment and in the bulk system coincide, values of the highest available frequency of particle oscillations also coincide in these systems, if the screening of the interaction potential is strong ( ) [58]. Hence, results from the systems in PBC can be transferred to an inhomogeneous system of a finite number of particles.
To confirm this result, we calculate the value of  from the experimental data. The obtained values are shown in figure 7 as the open squares. Experimental estimations are in good accordance with the theoretical calculations. This result shows that our experimental system should be considered as a set of independent quasi-homogeneous subsystems rather than a single uniform 'plasma crystal'. As soon as the trap is necessary to compensate the mutual repulsion of dust particles, its effect on the spectral properties should not be generally neglected under different experimental conditions. If the experimental system is strongly screened, the radial profile of particle number density is shown to be enough to calculate the ratio of highest oscillation frequencies in different regions of the structure.
5. Discussion
The observed properties of the experimental dust structure have explicit spatial non-uniformity. The dust system behaves not as a single crystal but rather as a set of quasi-uniform crystalline subsystems. Throughout the experimental structure, the inter-particle separation changes by  times, the amplitude of particle oscillations varies by
  times, the highest available frequency of particle oscillations changes by
  times. Previously, only a few experimental works directly address the spatial non-uniformity of the dust system, mainly in terms of the structural properties [14, 38, 67]. We demonstrate the principal non-uniformity of the spectral properties as well. Due to such an unusual combination of quasi-crystalline order and inhomogeneity, one can draw an analogy between the observed planar structure and systems observed in experiments with colloidal systems, quantum dots, electrons on the surface of liquid helium, one-component plasmas etc [94–101].
One should consider the properties of such a nonuniform system locally due to their explicit radial dependence. In our case of strong potential screening, the inhomogeneous structure can be separated into the quasi-homogeneous subsystems with almost uniform properties. As we show, the highest available frequency of particle oscillations can be transferred from the homogeneous model system in PBC to quasi-homogeneous subsystem of the experimental structure. Based on this fact, we propose the relationship between the highest available frequency and the inter-particle distance.
We observe one of the possible radially-dependent effects in the experimental dust structure. Spatial localization of high-frequency particle oscillations in a dust structure allows us to explain the spatial inhomogeneity of dynamical properties in this system. Under the conditions of our experiment, the higher oscillation frequency in the central region of the experimental system is explained by the lower inter-particle separation, which is caused by the parabolic trap and the strong screening of the particle interactions [41, 53, 54, 89]. It is known that the spectrum of particle oscillations determines the particle oscillations amplitude. That is why this non-uniformity reveals itself not only in the form of inter-particle distance gradient. Such properties of interest as the coupling and the Lindemann parameters and the dispersion curves become radially non-uniform.
These effects must be taken into account in the analysis of dusty plasma experiments. In [39], the authors adjust the degree of non-uniformity of a dust structure by a variation of plasma parameters and observe three different configurations of the dust structure. One of them is similar to our experiment—the central region is denser than the peripheral one. The other two differ from our experiment: the second one is almost homogeneous and the third one have the center more rarefied than the periphery. The latter cases can be described by the consideration of a more specific model that includes the hydrodynamical behavior of the electrons and ions in a plasma and the ion drag force [39]. The present and the mentioned studies shows that one should start the analysis of the experimental dust structure with the consideration of the inhomogeneity degree, because, as we show, it can have an impact on the dynamical properties of the system. The observed inhomogeneity of such systems provides an opportunity to observe a variety of local effects: wave propagation, inhomogeneous melting, instabilities development etc.
6. Conclusions
We experimentally studied the spatial distribution of the structural and dynamical properties of the two-dimensional dust system with the screening parameter  and the coupling parameter
  throughout the system. The obtained radial profiles of the inter-particle distance, the amplitude of particle oscillations, and the coupling parameter are spatially inhomogeneous. The radial profile of the average kinetic energy is close to uniform. We confirmed the effect of spatial localization of high-frequency particle oscillations in the central fragment of the dust structure. The shift of the particle oscillation spectrum into a low-frequency range is quantitatively described within the framework of the model of screened charges in a parabolic trap. Moreover, observed results are similar for systems of 223 and 848 particles. We attained the universal relationship between the highest available frequency of the in-plane particle oscillations and the inter-particle separation for an inhomogeneous system of screened charges in a trap. The universality of this relationship consists in the independence from the particle charge and the screening parameter in the case of strong interaction.
Acknowledgment
The experimental work is conducted by R A Syrovatka, A M Lipaev, D A Zamorin and was supported by Russian Science Foundation via Grant 20-12-00365. The theoretical work is conducted by I V Voronov, V S Nikolaev, A V Timofeev and was supported by the Ministry of Science and Higher Education of the Russian Federation (State Assignment No. 075-01129-23-00).
The computations were performed using the resources of Supercomputer center of JIHT RAS [102, 103] and Supercomputer Centre of Collective Usage of KIAM RAS.
Data availability statement
The data cannot be made publicly available upon publication because no suitable repository exists for hosting data in this field of study. The data that support the findings of this study are available upon reasonable request from the authors.
Appendix A: Method of rotation removal
We analyze the rotational motion of a dust structure via the tracking data. The dust structure rotates with the angular frequency  rad s−1. We eliminate rotation of the structure by the following correction to the particle position:
where  is the angular velocity vector,
  is the particle position relative to the rotation center and t is the time.
Appendix B: Considered structural and dynamical properties
Within the analysis of the structural properties of the system, we calculate the local value of mean inter-particle distance via the following formula:
where i is the index of a particle,  is the vector of the ith particle absolute coordinates, t is the time moment, and summation is done over n nearest neighbors of the ith particle. In our demonstration of a 2D triangular lattice n = 6 in an ideal situation and
  in presence of a lattice defect. Particles adjacent to the lattice defects with a number of neighbors that is different from 6 are eliminated from consideration. The list of the nearest neighbors is constructed via the Voronoi analysis of the structure [104].
To analyze the dynamical properties of the experimental system locally, we use a local coordinate system, which was introduced by Knapek et al [75]. The key idea of this approach is operating with particle properties that are calculated relative to the center of mass of the nearest neighbors of a particle.
Therefore, we consider not only the absolute coordinates of the particle  , but also calculate the vector of coordinates relative to the center of mass of the nearest neighbors of the particle [75],
for each particle  at each time moment, summation is done over n nearest neighbors of the ith particle. This procedure allows us to operate with the array of particle coordinates that are relative to the time-dependent position of the center of mass of the particle nearest neighbors. Notice the difference between
  and
and  . The first one contains the total information about absolute particle motion, including the translational motion of the structure. In general, the rotational motion can also be included into
  . The latter is the property that contains the information about relative particle motion, excluding the motion of the structure as a whole.
We calculate the particle velocity relative to the center of mass of the nearest neighbors as
additionally to the absolute particle velocity
In (B.3) and (B.4), t is the time moment,  is the time step,
  is the particle number.
The distribution of the X-component of the dust particle velocities VX
in the experimental structure is demonstrated in figure B1. Particles are grouped into three spatial regions: central, intermediate and peripheral (see figure 2). The Maxwellian fit with a temperature parameter corresponding to 600 K is in good accordance with the distribution of the most probable particle velocities in figure B1 in all selected regions of the structure. The temperature of 600 K is above the temperature of the ambient gas, which is  K.
K.
From the relative particle positions  , we calculate the amplitude of the in-plane particle oscillations
  via
via

where  is the mean standard deviation of the x-component of
  , the same for the y-component. Notice that in (B.5) we use the standard deviations of the x- and y-components of the relative particle coordinates
  , not the standard deviations of the X- and Y-components of the absolute particle coordinates
  . The relationship between these uncorrelated random values can be obtained via (B.2) and should be taken into account when these parameters are used for calculations.
In a similar manner, we calculate the average kinetic energy of the in-plane particle oscillations T from the relative particle velocities via
where  is the x-component of the ith particle velocity
  , the same for the y-component, m is the particle mass.
We calculate the coupling parameter from the experimental data as
where the inter-particle distance Δ is obtained from the experimental data via (B.1), and  . This definition of the coupling parameter is discussed in detail in [105]. It characterizes the ratio of the potential energy to the kinetic energy of a particle as the ratio of the geometrical area of a particle site, which corresponds to the Wigner–Seitz cell (
 ), to the characteristic area of thermal motion of a particle near the lattice site (
 ).
).
In figure B2, we show the radial distribution function g(r) in three regions of the structure: the central one (solid line), the intermediate one (dashed line) and the peripheral one (dash-dotted line).
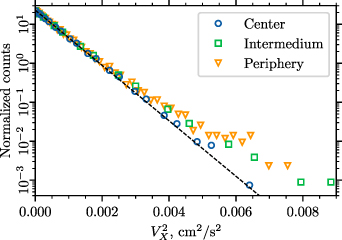
Figure B1. Distribution function of dust particle velocities, which are measured from the experimental data. Three types of symbols denote three regions, in which the distribution is obtained: circles for the central region of the structure, squares for the intermediate region, triangles for the periphery. The dashed line is the Maxwellian fit with T = 600 K, which is hotter than the room temperature gas.
Download figure:
Standard image High-resolution image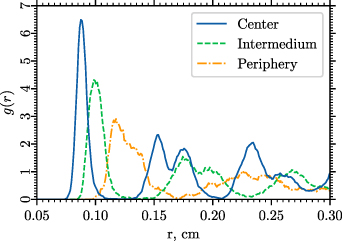
Figure B2. Radial distribution function of experimental dust structure. Three types of lines denote three regions, in which the distribution is obtained: solid line for the central region of the structure, dashed line for the intermediate region, dash-dotted line for the periphery.
Download figure:
Standard image High-resolution imageAppendix C: Calculation of the phonon spectrum
The wave dispersion curves of the microparticle monolayer can be explored using the velocities that are calculated from the tracking data [46, 106]. First, the particle current components are calculated:
where  is the wave vector, t is the moment of time, j is the particle index,
  is the s-projection of absolute velocity of particle j at the time moment t, i is the imaginary unit,
  is the vector of absolute coordinates of particle j at the time moment t. Second, the fast Fourier transform in the time domain is implemented to get the phonon spectrum in the 'frequency-wave vector' plane.
To get the dispersion curves of longitudinal and transversal waves, we implement the described procedure in three s-directions including two in-plane (parallel and perpendicular to the wave vector  ) and one out-of-plane perpendicular to the wave vector
  . The wave vector
  should be chosen regarding the lattice principal axis. We direct it strictly along the translational vector of the primitive cell.
It is known that an experimental crystalline system contains some defects in the lattice. The presence of these defects leads to the rotation of the lattice principal axis near the periphery of the crystal. Since that wave propagation in the periphery can be less sharp than in the center of the crystal. So, the dispersion curve degrades from the center of the crystal to the periphery.
To obtain dispersion curves from the phonon spectra, we consider each mode of oscillations one-by-one. For example, we calculate the phonon spectrum of longitudinal in-plane oscillations. Then we calculate the weighted average frequency for every wave number, using phonon spectrum amplitude as the weight. We consider all three modes of oscillations and obtain the complete set of dispersion curves from experimental tracking data.
In the experimental system, we estimate the highest available frequency of particle oscillations  in a certain region of the structure as the maximum value of the frequency in the in-plane dispersion curves in this region. This method gives more accurate results compared to the estimation by the tail of the VDOS.
In the case of the model system, we use a different approach. The value of the highest available frequency  can be calculated as the maximum eigenvalue of the dynamical matrix
where E is the total energy of the system (4), α and β denote x- or y-coordinates for the 2D case, i and j are particle indexes,  is the particle mass. The implemented procedure is referred to as normal mode analysis.
Appendix D: Experimental oscillation spectrum
The spectrum of particle oscillations is calculated from the experimental data in the following manner. The absolute velocity of particles  is calculated via (B.4), then the velocity autocorrelation function (VACF) is calculated as:
where the angle brackets denote the group averaging. The Fourier transformation of VACF is the VDOS, which is referred to as the particle vibrations spectrum.
In the laboratory experiment, parasitic vibrations of the experimental structure, which are not related to the particle interactions, can appear. These vibrations are revealed in the oscillation spectrum as 'parasitic' peaks. These peaks have an effect on the oscillation properties that can be extracted from the oscillation spectrum.
To remove the parasitic peaks in the particle oscillation spectrum, we obtain VACF in a different way. We calculate particle velocity relative to the center of mass of the nearest neighbors  via (B.3). This local value of velocity contains the information about relative particle motion, but not about the motion of the system as a whole. We then calculate VACF via (D.1) using the relative velocities
  instead of the absolute ones. In figure D1, the VACFs are compared: the one calculated via the absolute velocities
  and the one calculated via the relative velocities
  . Compared to the 'absolute' VACF, the 'relative' one is smoother and allows to obtain refined oscillation spectra that do not contain the parasitic peaks.

Figure D1. The autocorrelation function of absolute velocity (thin dashed line) is compared to the autocorrelation function of velocity relative to the center of mass (thick solid line). The second, refined VACF is smoother than absolute VACF.
Download figure:
Standard image High-resolution imageIn figure D2, the vibrational densities of states are compared for the different approaches to VDOS calculation: via the absolute and relative particle velocities. The spectrum, which is obtained via the 'relative' VACF, does not contain high-frequency thin peaks, which are supposed to be unrelated to the relative particle motion. The refined spectrum is bound between  Hz and
  Hz.
Hz.

Figure D2. The vibrational density of states, based on the 'absolute' velocity autocorrelation function (a), is compared to the vibrational density of states, based on the 'relative' autocorrelation function (b). The second one does not contain several high-frequency peaks, which are not supposed to be related to the inter-particle motion.
Download figure:
Standard image High-resolution imageAppendix E: Estimation of the system parameters
In order to describe the experimental dust structure as a system of particles interacting via the potential (1) in the field of the parabolic confinement (2), we need to estimate the system parameters Q, κ and α.
There are several methods that allow to estimate the particle charge Q and the screening constant κ from the detailed kinetic measurements of the monolayer dynamics [5, 41, 75, 78]. One of such methods is proposed by Knapek et al [75] and is based on the estimation of the coupling parameter in the system. Another method is described by Nunomura et al [78]. Their method allows us to find κ and Q by estimating the ratio of the sound speeds of the in-plane modes of particle vibrations. In the present work, we employ both described methods and obtain similar results for the observed experimental system: κ ≈ 14 cm−1 and  . The inaccuracy of the parameters estimation is
  .
.
After Q and κ are estimated, the trap parameter α is the last required parameter to characterize the experimental system if the potentials (1) and (2) are employed. The value of α can be calculated analytically if the radial density profile is known [53], but this method is only applicable to large systems of  particles. As soon as our system contains 848 particles, we conduct direct screening of α via the MD simulations with already estimated values of Q and κ.
The overall equation of motion that is solved numerically for the ith particle has the form

where  g is the particle mass, Q is the electrical charge,
  is the trap potential (2), V is the particle interaction potential (1), and the last term
  is the Hamiltonian of the Nosé–Hoover thermostat.
The simulation in a canonical ensemble is conducted via the LAMMPS package [107]. First, the system is equilibrated, then the particle trajectories are recorded. The temperature T is maintained equal to 600 K, the number of particles N is equal to 848 (the same as in the experimental structure). The planarity of the structure is achieved by implementing a strong vertical trap with the profile (2) and the trap parameter  .
.
We determine the value of the trap parameter  CGS units so that the particle number density radial profile in MD simulations coincides with the experimental system.
Finally, we test the applicability of the obtained system parameters  , κ = 14 cm−1,
  CGS units by comparing the radial profiles of structural and dynamic characteristics between the experimental structure and the simulated one. For both systems, we calculate the radial profiles of the inter-particle distance Δ via (B.1), and the amplitude of particle oscillations
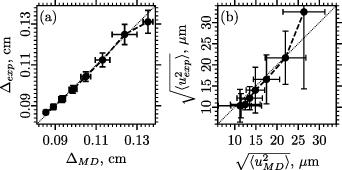
  via (B.5). Comparison of the radial profiles, which are calculated from the experimental data and from MD simulations, is demonstrated in figure E1. In figure E1(a), group-averaged experimentally obtained values of the inter-particle distance
  are plotted versus the group-averaged values of
  , which are obtained from MD simulations. Values of the particle oscillation amplitudes
  and
and  are plotted in a similar manner. Figure E1(a) demonstrates that values of the inter-particle distances
  and
and  are similar in the center of the system and almost coincide at the periphery. The same can be stated for the particle oscillation amplitudes. The difference between
  and
and  at the periphery is
  , while the difference between
  and
and  is
is  . Such a discrepancy is reasonable due to the edge effects in the experimental structure.
Figure E1. Comparison of the radial profiles that were calculated from the experimental data and from MD simulations. The inter-particle distance (a) and the amplitude of particle oscillations (b) are compared between the experimental system and the simulated one. The dots denote the group-averaged values. Error bars show the mean standard deviations from the group-average.
Download figure:
Standard image High-resolution image