

Abstract
Compared with the diffuse mode of helium plasma jets, a filamentary mode is normally produced in the plasma plume with less expensive inert gas, such as argon, which is undesirable because intense discharge in the filamentary mode may cause damage to fragile samples. Many efforts have been attempted to realize the diffuse mode of an argon plasma jet. In this paper, the diffuse mode is realized in an atmospheric pressure argon plasma jet with increasing biased voltage (Vb) applied to a downstream plate electrode. Results show that the diffuse mode transits from the filamentary mode with the increase of Vb. Waveforms of voltage, current and integrated light emission reveal that the filament originates from a positive discharge with a needle anode, while the diffuse mode results from negative discharges with a needle cathode, which consist of a Trichel-pulse phase and a slower-varying phase. By fast photography, the positive discharge is attributed to a streamer regime, whereas the negative discharges belong to a Townsend-discharge regime. From optical emission spectroscopy, electron density, electron excitation temperature, vibrational temperature, and rotational temperature are studied as functions of Vb.
Export citation and abstract BibTeX RIS
1. Introduction
Atmospheric pressure plasma jet (APPJ) has the ability to generate a plasma plume in open air atmosphere [1], where lots of active species exist [2, 3]. APPJ has extensive application fields, such as water purification [4], etching [5], catalysis enhancement [6], surface modification [7], element detection [8, 9], biomedical sterilization [10–14], etc.
Fed by helium, a diffuse plasma plume is usually observed [15, 16], which is actually composed of repeatedly propagating emission layers with a velocity ranging from 103 to 105 m s−1 [17, 18], and sometimes even reaching 106 m s−1 [19, 20]. In fact, the diffuse plume contracts in radial direction with increasing voltage amplitude, resulting in a straight filament in the center of helium stream [21]. Hence, there are two distinct operation modes for APPJ, namely a diffuse mode and a filamentary mode. The filamentary mode has an electron density in the range from 1013 cm−3 to 1015 cm−3 [22–24]. In contrast, electron density is lower, usually ranging from 1010 cm−3 to 1013 cm−3 for the diffuse mode [25–27]. Compared with the filamentary mode, the diffuse mode is more desirable because the intense discharge in a filament may damage the fragile samples to be treated [28].
When using available low-cost argon, the filamentary mode is more likely to appear [29–33]. Hence, lots of efforts have been attempted to achieve the diffuse mode of argon APPJ. Among them, pre-ionization is a popular method [34, 35]. In some cases, the geometry of APPJ has to be changed in order to provide the necessary pre-ionization [35]. Alternatively, it has been proven effective by adding some additives in argon, such as ammonia [36], hydrogen [31], acetone [37], and ethanol [38]. However, additive content needs to be controlled precisely, otherwise the diffuse mode will transit back to the filamentary mode. Moreover, some elements introduced into the plasma plume may do harm to the samples. Without any addictive, the diffuse mode is also generated with argon flow velocity comparable to ion drift velocity [29], which means that the diffuse mode can only be maintained in a small range of argon flow rate.
Using an argon APPJ in a needle to plate geometry, the diffuse mode is reported for the first time with applying biased voltage (Vb) to the plate electrode. The formation mechanism of the diffuse argon plume is investigated by electrical measurement, fast photography, and optical emission spectroscopy.
2. Experimental setup
Figure 1(a) presents a schematic diagram of the experimental setup, where APPJ is in a needle to plate geometry [39, 40]. A tungsten needle with 1.0 mm diameter and 250 μm tip radius is coaxially wrapped in a quartz tube with inner and outer diameters of 3.0 mm and 5.0 mm, respectively. The active length of the jet is around 12.0 cm with the needle tip aligned with the tube orifice. Along the tube, argon with a purity of 99.999% flows with a constant rate of 1.2 l min−1 and finally flushes out into the ambient air. A coordinate system (z axis) is built along the argon stream with the needle tip as its origin. An alternating-current power supply (Suman CTP-2000K) provides the needle with a 2.5 kHz sinusoidal voltage (Vs). At z= 40.0 mm, a copper plate is placed perpendicular to z axis. A direct-current power supply (Glassman, EK15R40) provides the plate with Vb through a ballast resistor (R= 200 kΩ). Vs and Vb are detected by two high-voltage probes (Tektronix P6015A), respectively. Current (Ic) is detected by a current coil (Pearson 8600). Integrated light emission (Ie) is collected by a photomultiplier tube (ET 9130/100B) after being focused with a quartz lens. Waveforms of Vs, Vb, Ic and Ie are monitored and recorded simultaneously by an oscilloscope (Tektronix DPO4054). Besides, the spatial and temporal evolution of the plasma plume is tracked by an electron-multiplying intensified charge-coupled device (emICCD) (PI MAX4-1024EM/EMB) in the following way. The emICCD is triggered by a transistor-transistor logic (TTL) signal produced by a home-made trigger, which is synchronized with the applied voltage. Thus, spatial and temporal evolution can be implemented by varying the delay time of emICCD gate. However, different discharges generated at different voltage cycles may occur at different moments due to temporal jitter [41]. Although the jitter time may be very short, it needs to be considered when recording emICCD images with high temporal resolution. To resolve this issue, the oscilloscope is employed to register the waveforms of the triggering TTL signal (the optical gate of the emICCD) and light emission signal from the discharge. Discharge images at arbitrary gate moments in reference to light emission signal can be obtained through varying delay time of the emICCD, and a complete discharge process can be reproduced by the image stitching. After being focused by a lens, integrated light emission is transmitted by a fiber into the entrance slit of a spectrometer (PI ACTON SP2750) mounted with a CCD (PI PIXIS 400B), which is used to collect optical emission spectra with a grating of 2400 grooves mm−1.
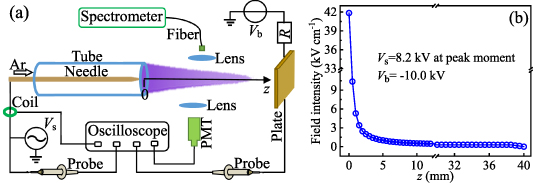
Figure 1. (a) Schematic diagram of the experimental setup. (b) Spatial distribution of electric field intensity along z axis, which is calculated by COMSOL under 18.2 kV voltage applied between the needle and the plate.
Download figure:
Standard image High-resolution imageThrough using COMSOL software, electrostatic field before discharge initiates can be calculated by solving the Laplacian equation in the axisymmetric cylindrical coordinate. Here, a direct-current voltage of 18.2 kV is applied between the two electrodes, and the needle is the anode. Under this circumstance, spatial distribution of field intensity is depicted in figure 1(b). It is found that maximal field appears in the vicinity of the needle tip, and field intensity decreases with increasing distance from the jet nozzle.
3. Results and discussion
Discharge initiates downstream of the argon APPJ with zero Vb once Vs amplitude surpasses about 5.3 kV, resulting in a plasma plume. The plume elongates with increasing Vs amplitude. Besides, the plume length can be influenced by Vb under a constant Vs amplitude. Plume tail almost touches the plate electrode with Vb of −2.0 kV, as shown in figure 2(a). Some filaments can be observed in the plasma plume, revealing the filamentary mode. With increasing Vb, the filamentary plume decreases in length, as presented in figure 2(b). It seems that a diffuse part appears near the nozzle. The diffuse part grows and the filamentary part shrinks with further increasing Vb. At around 7.0 kV, the filamentary part disappears completely, and only the diffuse part is left, as shown in figure 2(c). The diffuse plume elongates with further increasing Vb, which fills the whole space between the needle and the plate at Vb of 10.0 kV (figure 2(d)). Spatial distribution of gray level is investigated for the images of the diffuse mode (figures 2(c) and (d)), as presented in figure 2(e). Gray level is 255 if photograph is saturated. Hence, it can be deduced from figure 2(e) that the diffuse morphology does not result from image saturation. Therefore, a real diffuse structure is revealed in figures 2(c) and (d). To our knowledge, this is the first report on the pure-argon diffuse mode with varying voltage amplitude.
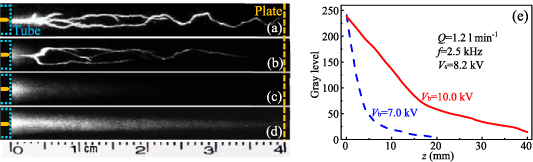
Figure 2. Images captured by the camera with texp of 0.4 ms for the plasma plume with Vb of −2.0 kV (a), 2.0 kV (b), 7.0 kV (c), and 10.0 kV (d). (e) Spatial distribution of gray level for the images of (c) and (d). Vs amplitude is 8.2 kV.
Download figure:
Standard image High-resolution imageFor the filamentary mode in figure 2(a), discharge initiates once per voltage cycle, as presented in figure 3(a). Apparently, the pulsed discharge with a duration of about 0.7 μs initiates when the needle serves as the anode, which is denoted as a positive discharge in the following. Besides the positive discharge, several emission pulses followed by a hump appear when the needle serves as the cathode, as presented in figure 3(b). Accordingly, these pulses and the hump are negative discharges due to the needle cathode, whose durations are roughly 2.0 μs and 110 μs, respectively. Originate from corona discharge near the needle tip (This will be revealed by fast photography), the pulses in Ic and Ie are actually Trichel pulses [42, 43]. Compared figure 3(b) with figure 3(a), it can be found that the intensity of the positive discharge decreases with increasing Vb. The positive discharge is absent for the diffuse mode, as revealed in figures 3(c) and (d). From figures 3(c) and (d), it can also be found that the negative discharges including the Trichel-pulse phase and the slower-varying phase (the hump) become more intense with increasing Vb.
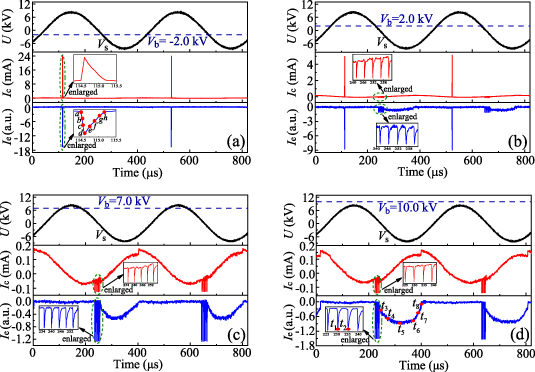
Figure 3. Waveforms of voltage (U), integrated current (Ic), and total emission signal (Ie) from the plasma plume. (a)–(d) correspond to figures 2(a)–(d), respectively.
Download figure:
Standard image High-resolution imageIn combination with figures 2 and 3, it can be inferred with increasing Vb, the positive discharge weakens as the filamentary part shrinks, while the negative discharges strengthen as the diffuse part grows. Hence, it can be speculated that the positive discharge is filamentary, whereas the negative discharges are diffuse. The increasing Vb makes the maximum of positive electric field (directed to the plate) decreases, while the maximum of negative field (directed to the needle) increases due to the constant peak value of Vs. Consequently, the positive discharge weakens and the negative discharges strengthen with increasing Vb. The positive-discharge filaments can be restrained completely under a sufficiently high Vb, resulting in the diffuse mode.
Fast photography is implemented to reveal the spatial and temporal evolution of the filamentary mode, as illustrated in figure 4. The positive discharge initiates in the vicinity of the needle tip at the beginning (moment a). Due to charge separation [17], an emission layer (the front of an ionization wave) is formed at moment b, which propagates downstream as a positive streamer. Besides the propagating streamer, a discharge can also be found near the needle tip, which almost lasts for the whole process of the streamer propagation. At moment c, two or three emission layers can be discerned, indicating that the positive discharge evolves into a branched streamer. Then the branched streamer keeps propagating downstream. During its propagation (moments d, e, f and g), the number of emission layer is stochastic, revealing random bifurcation of the streamer. At last (moment h), the streamer reaches the plate vicinity and quenches. The similar behavior of positive streamers has been reported in [33, 44]. In a word, the positive discharge is filamentary, which results from a positive streamer regime. Besides, the plasma diameter in the filamentary mode is between 0.3 and 1.2 mm, which is within the range of typical streamer diameter [20, 45–47].
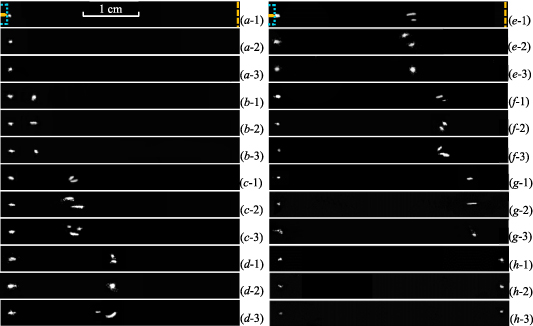
Figure 4. Spatial and temporal evolution of the filamentary mode (figure 3(a)). Due to the randomness of bifurcation, three photographs with texp of 10 ns are given for every delay time ((a)–(h) correspond to 0 ns, 30 ns, 70 ns, 100 ns, 230 ns, 390 ns, 540 ns, and 700 ns, respectively), which are marked in the enlarged Ie waveform of figure 3(a).
Download figure:
Standard image High-resolution imageAt the Trichel-pulse phase of the negative discharges, only a spherical discharge appears at the needle tip (t1 and t2 in figure 5), which can be classified as a corona discharge due to its small volume and short duration. In the corona discharge, maximal gray level is lower than 255, indicating that the picture is not saturated. Hence, the spherical discharge is essentially diffuse during the Trichel-pulse phase. At t3, a diffuse discharge with maximal diameter of 3.0 mm (much bigger than an emission layer in figure 4) appears near the jet nozzle. At t4 and t5, it grows and elongates along the argon stream owing to the increasing absolute value of Vs (abs(Vs)). Then, the diffuse discharge shrinks from t6 to t8 due to the decreasing abs(Vs), which quenches at last.
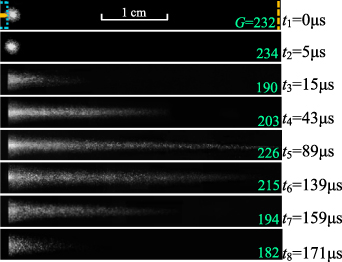
Figure 5. Spatial and temporal evolution of the diffuse mode (figure 3(d)). Delay time (t1 to t8) is shown in figure 3(d). texp is 10 ns from t1 to t2 and 50 ns from t3 to t8. Maximal gray level (G) is also marked on every photograph.
Download figure:
Standard image High-resolution imageFrom figure 5, it can be deduced that the plasma in the diffuse mode develops at a velocity of around 6 × 10² m s−1, which is much lower than that of a streamer discharge [17–20]. The development velocity is mainly determined by electrons due to great mobility difference between ions and electrons. Hence, electron drift velocity is fairly low in the slow-varying phase. In fact, streamer velocity is also equivalent to electron drift velocity (νe) [48]. The enhanced field due to charge separation accounts for the high velocity of streamers [17]. Therefore, the slow drift velocity in the diffuse mode indicates that electric field is fairly low, which suggests that other than a streamer, the discharge in the diffuse mode should be in a Townsend discharge regime. Moreover, the absent emission layer also verifies that a streamer regime fails to set in the slower-varying phase, which can only be attributed to a Townsend discharge regime.
During the Trichel-pulse phase, the needle is the cathode and the plate is the anode because Vs is lower than Vb. Electron avalanches are mainly produced in the strong field region near the needle tip (figure 1(b)). Ions in the strong field region will accelerate towards and collide with the needle cathode to produce secondary electrons through bombardment. At the same time, electrons drift towards the plate anode. These electrons will be multiplied as they drift in the strong field region. After leaving the strong field region, drift velocity turns quite low, leading to electron accumulation. These slow electrons will induce a field, which is opposite to the applied one in the strong field region. As a result, the net field decreases in the vicinity of the needle tip. Resultantly, the corona discharge is suspended when the net field is lower than a critical value, leading to the quenching of a Trichel pulse. On one hand, the applied field increases with time elapsing. On the other hand, the opposite field decreases with the slow electrons drifting to and disappearing on the plate electrode. Hence, net field recovers with time, which will induce the next Trichel pulse.
Although the accumulated electrons induce a opposite field near the needle, the induced field is in the same direction with the applied field in the weak-field region. Hence, the field outside the corona increases with increasing the number of Trichel pulse. Besides, the applied field increases with time. Under the mutual effect of the applied field and the induced field, field threshold for breakdown is satisfied outside the corona region at the end of the last Trichel pulse, leading to the hump discharge in the Townsend discharge regime.
Figure 6 illustrates integrated optical emission spectra from the filamentary mode and the diffuse mode. The two spectra have similar spectral lines, such as  from OH radical, the second positive system of
  ,
,  , and
, and  . From intensity ratios of spectral lines (738.4 nm–763.5 nm, and 763.7 nm–772.7 nm), electron density (ne) and electron excitation temperature (Texc) can be inferred [49, 50], respectively. Moreover, vibrational temperature (Tvib) can be diagnosed by fitting the second positive system of
  [51], and
  of OH radical can be used to determine rotational temperature (Tr) through Lifbase software [52, 53], which approximately equals to gas temperature (Tg) at atmospheric pressure [15, 54]. With varying Vb (other parameters keep constant), a series of spectra are obtained, which can be used to calculate plasma parameters as functions of Vb.
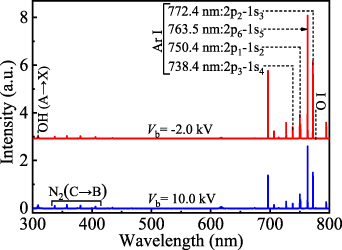
Figure 6. 300 nm to 800 nm scanned optical emission spectra from the filamentary mode and the diffuse mode, respectively. Vs amplitude is 8.2 kV.
Download figure:
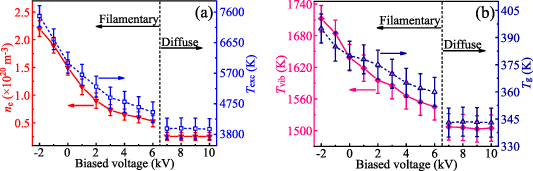
Standard image High-resolution imageFigure 7 presents the plasma parameters including ne, Texc, Tvib, and Tg as functions of Vb. Results indicate that ne Texc, Tvib, and Tg have a similar trend, which decrease from 2.2 × 1014 cm−3 to 2.5 × 1012 cm−3, from 7482 K to 3960 K, from 1720 K to 1500 K, and from 380 K to 340 K with increasing Vb in the filamentary mode. With further increasing Vb, they keep almost constant in the diffuse mode. For a sufficiently low Vb, only positive streamers are set in, as mentioned before. The corresponding ne is 2.2 × 1014 cm−3, which is similar to that of the streamer discharge reported by others [24, 55, 56]. For a Vb high enough, ne is 2.5 × 1012 cm−3 in the diffuse mode, which is much less than that of a streamer discharge [26, 27, 57, 58]. The fairly low ne is another indication of the Townsend discharge regime for both the Trichel-pulse and the slower-varying phases.
Figure 7. Ne, Texc (a), Tvib and Tg (b) as functions of Vb. Vs amplitude is 8.2 kV.
Download figure:
Standard image High-resolution image
As Vb increases in the filamentary mode, the contribution of positive discharge (high ne) decreases, while the contribution of the Townsend discharge (low ne) increases. Therefore, ne decreases as Vb increases in the filamentary mode. For the diffuse mode, the variation of ne is ignorable with varying Vb due to the constant regime. Besides, Texc is positively correlated with ne [15], revealing their similar variation trend with Vb. A decrease in average electron energy (represented by Texc) means that lower vibrational levels are more efficiently excited by electrons [59]. Hence, Tvib and Texc have the similar variation trend with varying Vb. Moreover, Tg reflects the energy transferred from electron to neutral gas molecules [52, 60]. Less energy is transferred with decreasing Texc, leading to the similar variation trend of Tg and Texc.
All in all, a diffuse plume is generated when the metallic plate is connected to a high voltage, which is more desirable in biomedical usage. In fact, lots of medical application including sterilization are usually performed in or in contact with solutions. It is believed that the diffuse plume can be reproduced above a high-conductivity solution if it is connected to a high voltage. In the future, more detailed investigations will be conducted to focus on the generation of the diffuse plume above solution.
4. Conclusions
In conclusion, the diffuse mode of an argon plume is realized in an APPJ through varying Vb applied to the plate electrode. Besides the diffuse mode under a higher Vb, the filamentary mode is produced under a lower Vb. Results indicate that the filament originates from the positive discharge, and the diffuse mode results from the negative discharges that consist of the Trichel-pulse phase and the slower-varying phase. The contribution of the positive discharge decreases, and that of the negative discharges increases with increasing Vb. The positive discharge is completely restrained with increasing Vb higher than a certain value. Spatial and temporal evolutions for the filamentary mode and the diffuse one reveal that the positive discharge is in the positive streamer regime, while the negative discharge belongs to the Townsend discharge regime. By optical emission spectroscopy, plasma parameters including ne, Texc, Tvib and Tr are investigated as functions of Vb. All of the plasma parameters indicate the similar variation trend with increasing Vb, which decrease in the filamentary mode, and keep almost constant in the diffuse mode. All these results mentioned above are qualitatively explained.
Acknowledgments
This work is sponsored by the National Natural Science Foundation of China under Grant Nos. 51977057 and 11875121, the Natural Science Foundation of Hebei province, China under Grant Nos. A2020201025 and A2019201100, the Natural Science Interdisciplinary Research Program of Hebei University under Grant No. DXK201908.
Data availability statement
The data that support the findings of this study are available upon reasonable request from the authors.