

Abstract
Half-Heusler (HH) alloys with an 18 valence electron count have attracted significant interest in the area of research related to thermoelectrics (TEs). Understanding the novel transport properties exhibited by these systems with semiconducting ground state is an important focus area in this field. The large thermal conductivity shown by most of the HH alloys poses a major hurdle to improving the figure of merit (ZT). In addition, understanding the mechanism of thermal conduction in heavy-constituent HH alloys is an interesting aspect. Here, we have investigated the high-temperature TE properties of ZrIrSb through experimental studies, phonon dispersion and electronic band structure calculations. ZrIrSb is found to exhibit a substantially lower magnitude of resistivity and Seebeck coefficient near room temperature due to the existence of anti-site disorder between Ir/Sb and vacant sites. Interestingly, in ZrIrSb, lattice thermal conductivity is governed by a coupling between the acoustic and low-frequency optical phonon modes, which originates due to heavier Ir/Sb atoms. This coupling leads to an enhancement in the Umklapp processes due to the optical phonon excitations near the zone boundary, resulting in a lower magnitude of κL. Our studies point to the fact that the simultaneous existence of two heavy mass elements within a simple unit cell can substantially decrease the lattice degrees of freedom.
Export citation and abstract BibTeX RIS
1. Introduction
Thermoelectric (TE) materials are important since they are used to extract waste heat and convert it into useful electrical energy. This unique property of TE materials has attracted immense attention among researchers in recent years from the viewpoint of interesting electronic band structure and due to their potential technological applications in home heating appliances, temperature sensors, TE cooler for electronic devices, cooling infrared sensors [1–5]. In this respect, semiconducting half-Heusler (HH) alloys have emerged as an important class of materials [6–8]. These materials are also free of toxic elements and have high thermal stability [9, 10]. The HH alloys crystallize in cubic structure (space group F-43m) and typically have the formula XYZ. The elements X, Y and Z occupy the Wyckoff position 4a (0, 0, 0), 4c (0.25, 0.25, 0.25) and 4b (0.5, 0.5, 0.5), respectively, leaving the position 4d (0.75, 0.75, 0.75) vacant. Each occupied site can be tuned independently, through substitutions, in order to optimize the TE system. These alloys are categorized into different groups, depending upon the valence electron count (VEC) [6, 11]. For example, LiMgZ (Z = N, P) have an eight VEC in a primitive unit cell. These alloys are non-magnetic and semiconducting [12]. Based upon the theoretical calculations, Kandpal et al have formulated a rule that the HHs with VEC = 8 or 18 exhibit semiconducting behaviour [11]. Furthermore, depending on the magnitude of band gaps, some of them display exceptional TE properties, such as large Seebeck coefficient (S) and reasonably small electrical resistivity (ρ) at high temperatures [13–15]. However, the presence of high thermal conductivity (κtotal) in these systems limits their capability as a good TE material. Generally, the transport of heat occurs mainly through the lattice degrees of freedom, i.e. there is large contribution from lattice thermal conductivity (κL) [6–8, 13–15]. κL can be effectively reduced by inducing mass fluctuations or strain field effects. These effects can be introduced into the HH systems by substituting or doping heavy elements, such as Sb, Hf, Zr, etc. For instance, in XNiSn-based HH systems, (where X = Ti, Hf, Zr), the substitution of multiple elements with different masses, at X as well as Ni sites, has led to a significant reduction in the magnitude of κL [16]. On the other hand, a similar effect is observed in both ZrCoSb and TiCoSb, where κL is dramatically decreased with increasing Sn and Fe content at the Sb and Co site, respectively [17, 18]. Hence, it can be said that the substitution of different or heavier mass elements can lead to a substantial decrement in κL in HH alloys.
In order to unravel the physics behind the mechanism of thermal conduction, a systematic study of phonon properties of the TE material is crucial [19–23]. The phonon calculations are useful in extracting the information about the stability of the crystal and contributions from the different phonon modes to κL. Hence, computational study of phonon dispersion along with the phonon density of states (P-DOS) is very important for the complete description of the heat transport mechanism in a TE material. In this regard, there have been several studies on semi-conducting HH alloys, focussing on their phonon dispersion and P-DOS. Most of these investigations have been carried out using first principles calculations. From these calculations, it has been determined that the fundamental factors significantly contributing to a lower κL are weak interatomic interactions, heavy element substitution and large Gruneisen parameters [24–26]. It has also been noted that there is a dominant contribution from the acoustic phonon modes due to their relatively higher group velocity in comparison with the optical phonon modes. Furthermore, in some cases it has been observed that there is a strong coupling between the low-frequency optical and acoustic modes, leading to ultralow κL. Large unit cell, blocked crystal structure and heavy mass elements may be possible reasons for the latter observation [24–26]. However, the simple crystal structure of HH alloys poses a major challenge to this. Hence, it is vital to understand the individual contributions from acoustic and optical phonon modes to κL, in a simple unit cell. This, in turn, will be helpful in exploring and designing new low κL-based HH alloys. In view of the above, ZrIrSb HH alloy provides fertile ground for investigation due to its heavy constituent elements and simple crystal structure. Theoretically, this alloy is predicted to have semiconducting ground state and interesting conduction band (CB) structure, which can provide significant thermopower at high temperature [27]. However, to the best of our knowledge, this alloy has not been explored experimentally.
Hence, in this manuscript, we have studied the high-temperature TE properties of ZrIrSb in the temperature regime of 300–950 K using both experimental and computational tools. In spite of a wide band gap in ZrIrSb, our experimental results indicate a lower magnitude of ρ at room temperature. This anomalous observation can be attributed to the presence of anti-site disorder between Ir/Sb and vacant sites. The observed positive S is well understood in terms of the effective mass of the charge carriers. In this alloy, the heat conduction is via a coupling between the low-frequency optical and acoustic phonon modes, arising due to the heavier elements of Ir/Sb. This coupling results in strong phonon–phonon scattering due to the presence of significant Umklapp processes. This leads to a lower magnitude of κL and an improvement in ZT in comparison to its analogous alloys.
2. Experimental and computational details
Polycrystalline alloy ZrIrSb is synthesized by arc melting (in argon atmosphere) the stoichiometric ratio of high-purity constituent elements (>99.9%) procured from Sigma Aldrich (Zr, Sb) and Alfa Aesar (Ir). The ingot is re-melted several times to ensure the homogeneity of the alloy. Due to the high vapour pressure of Sb, an additional amount of 5% Sb is added to compensate for the Sb loss during arc melting. The weight loss after the final melting is <2%. The obtained ingot is crushed into powder using a mortar and pestle. Then, the obtained powdered sample is pelletized and sintered using a spark plasma sintering technique at 1473 K for 5 min under 50 MPa in argon atmosphere. The phase purity and crystal structure are confirmed through room-temperature x-ray diffraction (XRD) performed using a Bruker D8 Advance diffractometer (Cu-Kα source). The compositional analysis is carried out by using electron probe microanalysis (EPMA) (JEOL JXL-8230 electron probe microanalyzer). S and ρ are, respectively, measured using the steady-state method and four-probe measurement technique home-made setups [28]. κtotal measurement is doneusing laser flash analysis (NETZSCH LFA 457 laser flash apparatus). Archimedes principle is used to determine the experimental density of the alloy. Longitudinal and shear sound velocities at room temperature are estimated by using an ultrasonic velocity measurement system (Olympus ultrasonic transducer).
To understand the charge transport behaviour, the electronic structure calculations of ZrIrSb are performed using first-principles density functional theory (DFT) calculations. The generalized gradient approximation (GGA) of Perdue–Burke–Ernzerhof (PBE) is used as the exchange correlation functional, as implemented in WIEN2K code [29, 30]. For the convergence of the electronic total energy, a criterion of 10−4 Ry/cell is selected. For self-consistency field calculations and electronic DOS, a dense k-point mesh of 15 × 15 × 15, and 20 × 20 × 20 points, respectively, is considered [31]. The electronic band dispersion plot is obtained along the high-symmetry k-points corresponding to the space group F-43m (216). An experimental lattice parameter is used to perform the DFT calculations. This parameter is obtained after the Rietveld refinement of the room-temperature XRD pattern of ZrIrSb. The theoretical lattice parameters from both VASP and WEIN2K codes along with Wyckoff positions of Zr, Ir and Sb, used for calculations, are given in table 1.
Table 1. Obtained structural parameters from Rietveld refinement of ZrIrSb.
| Experimental lattice parameter (Å) | 6.292 ± 0.001 | |||
| Theoretical lattice parameter (Å) (WEIN2K code) | 6.3672 Å | |||
| Theoretical lattice parameter (Å) (VASP code) | 6.3520 Å | |||
| Volume (Å3) | 249.45 | |||
| Wyckoff positions | X | Y | Z | Position |
| Zr | 0 | 0 | 0 | 4a |
| Ir | 0.25 | 0.25 | 0.25 | 4c |
| Sb | 0.50 | 0.50 | 0.50 | 4b |
| Vacant sites | 0.75 | 0.75 | 0.75 | 4d |
Phonon calculations are performed within the framework of the force constant method implemented in the PHONOPY code [32]. A unit cell and 2 × 2 × 2 supercell are used for the force calculations. Real-space force constants of the supercell are determined in density functional perturbation theory as implemented in the VASP code. The GGA of PBE is employed for the exchange correlation potential. A plane-wave energy cut-off of 500 eV is used for the calculations. The P-DOS and phonon dispersion are estimated from the force constant. For the P-DOS, a 16 × 16 × 16 mesh is used, whereas phonon dispersion is plotted along the high-symmetry directions. The calculation of κL is executed in PHONO3PY code [33], which is based on the first-principles linearized Boltzmann transport equation (LBTE) in single-mode relaxation time (SMRT) approximation with the same supercell and 11 × 11 × 11 mesh.
3. Results and discussion
3.1. Structural characterization
The room-temperature XRD pattern and crystal structure for ZrIrSb is shown in figures 1(a) and (b). To confirm the structural phase, XRD data of the alloy are analyzed using the Rietveld refinement method implemented in FullProf software, and the crystal structure is obtained using VESTA software [34, 35]. The obtained structural parameters are listed in table 1. The alloy is found to be in single phase, with the presence of two minor unidentified impurity peaks (<2%; marked by an asterisk). The Miller indices of the XRD peaks corresponding to the Bragg reflection positions (shown in figure 1) are associated with the cubic crystal structure phase (space group: F-43m). The obtained lattice parameter (a) is in good agreement with the lattice parameter used in the theoretical calculations and is given in table 1. In these types of alloys, from the intensity of (111), (200) and (220) peaks, one can determine the type of disorder in the unit cell [36]. In our case, the (111) peak is clearly visible. However, the intensity of the (200) peak is found to be negligible compared to the most intense peak (220). This signifies that there is a partial presence of Ir/Sb at vacant sites, which leads to anti-site disorder between the two sites. The density of ZrIrSb obtained from Archimedes principle is ∼10.473 g cc−1. This value is 97% greater than the theortical value. From EPMA analysis, the average composition is found to be Zr1.12±0.02Ir0.98±0.03Sb0.90±0.01, which indicates the non-stoichiometric composition of the ZrIrSb alloy.

Figure 1. (a) Rietveld refinement analysis of room-temperature XRD pattern (asterisks indicate unidentified peaks). (b) Crystal structure of ZrIrSb.
Download figure:
Standard image High-resolution image3.2. Electronic band structure of ZrIrSb
In order to know about the ground state of Heusler alloys, self-consistent field calculations are done. The band structures obtained from these calculations are helpful to understand the role of various elements in the formation of the valence band (VB) and CB. The band structure of ZrIrSb along the directions W-L-Г-X-W-X of the first Brillouin zone (BZ) is presented in figure 2(a). It can be inferred that the VB maxima (VBM) and CB minima (CBM) lie at two different k-points, i.e. Г and X point, respectively. This indicates the indirect nature of the band gap, with Eg ∼ 1.41 eV. Here, it can be noted that Г is triply degenerate and X point is non-degenerate. A similar type of indirect band gap has been reported in other well-known semiconducting HH systems, such as HfIrSb, ZrNiSn and HfNiSn [19, 27]. Lee et al had also investigated the electronic band structure of ZrIrSb and reported a similar value of the band gap [27]. From the figure, it can be seen that the bands, numbered from 1 to 4, contribute to transport properties. As reported in [27], below the Fermi level (EF), bands 1 and 2 are formed due to the hybridization between the d-orbitals of Zr and Ir, whereas band 3 is formed from the d-orbitals of Ir. The most important features of band structure that affect the transport properties, i.e. S and ρ, are (a) the degeneracy of VBM and CBM; (b) effective mass (m*) of the charge carriers at the VBM and CBM and (c) the variation of DOS in the vicinity of the band gap. As noted earlier, VBM at Г point is triply degenerate. This signifies that more states are available for the occupation of charge carriers near the EF at Г point. Above EF, band 4 is also formed due to hybridization between the d states of Ir and neighbouring Zr atoms but has a strong Zr d character near X point [27]. However, this band is non-degenerate, implying contribution from only one electron pocket at X point. This can affect the overall magnitude of S. Figure 2(b) shows the total DOS (TDOS) and partial DOS (PDOS) plotted as a function of energy. From the figure, it can be seen that Zr and Ir are the main contributors to DOS around the Fermi level (figure 2(b)). We have also noted a slow variation in DOS with energy. This implies that this alloy should have a lower magnitude of S, which has been confirmed experimentally (discussed in detail in section 3.3.1).
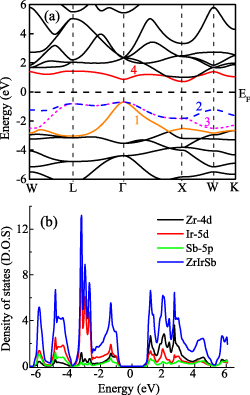
Figure 2. (a) Electronic dispersion of ZrIrSb along high- symmetry k-points. (b) TDOS (in states/eV/f.u) and PDOS in (states/eV/atom) of ZrIrSb.
Download figure:
Standard image High-resolution image3.3. Transport properties
3.3.1. Seebeck coefficient.
Figure 3(a) represents the temperature-dependent S in the temperature regime of 300–950 K. At 300 K, the value of S is found to be ∼34.4 μV K−1. The positive sign indicates the dominance of holes in the charge transport mechanism. With the increment in temperature, a linear increment in magnitude of S is noted till 500 K (denoted by a solid red line in figure 3(a)). Above 500 K, S increases non-linearly with temperature, reaching maximum value (Smax) ∼ 75.5 μV K−1 at 950 K. The observed Smax is smaller compared to the XCoSb (X = Ti, Zr and Hf) series of alloys [17, 37, 38]. Under free electron theory approximation, S and m* of the charge carriers are directly related to each other and are given by the expression [39, 40]:

Figure 3. (a) Temperature-dependent behaviour of S in the temperature regime 300–950 K of ZrIrSb; red solid line represents the linear trend of S. Inset: ρ versus T plot in the temperature regime 550–950 K. (b) Temperature response of ρ in the temperature regime 300–950 K for ZrIrSb; upper inset: ln (T/ρ) versus 1000/T (K−1) plot; red solid line represents the linear fitting. Lower inset: ln (1/ρ) versus 1/T−0.25 plot; red solid line represents the linear fitting.
Download figure:
Standard image High-resolution imagewhere kB is the Boltzmann constant, e is the electronic charge and n is the charge carrier density. As T and n are positive quantities, this implies that the sign of S will be decided by the sign of m*. Generally, m* depends on the band structure of the materials. In addition, in the case of semiconductors, both types of charge carrier (electrons and holes) contribute to S. So, the sign of S will be decided by the charge carriers having larger m*. Thus, m* estimated from figure 2(a) will be useful to gain a qualitative understanding of the sign of the experimentally obtained value of S. Hence, the VBM and CBM near Г and X k-symmetry points are analyzed. The curvature of the energy curve at a k-point decides the value of m* and is given by [40],
From the above equation, it can be inferred that at a given k point, the m* of a charge carrier for a broader energy curve is greater than the narrower energy curve. In order to see the m* contributions of holes and electrons along different high symmetry directions, m* has been estimated at Г point for holes (along K, W, X and L directions) and at X point for electrons (along Г, W, K and L). The calculated m* is given in table 2. In the table, K-Г-K represents the m* calculated at Г point along the Г-K direction. Similar notation is used for other directions as well. It is noted that band 1 is lighter with lesser m*, resulting in higher electrical conductivity of charge carriers in this band. However, bands 2 and 3 being degenerate along Г-X and Г-L directions have the same m* values. The estimated value of m* for holes is 0.6 me (of band 2 and 3) and 0.21 me (band 1) along X direction. Similarly, for electrons the maximum m* ∼ 0.6 me is found along Г direction, indicating higher mobility of electrons in the vicinity of CBM. This indicates that both holes and electrons have similar m* along X and Г directions, respectively. However, due to degeneracy of bands 1, 2 and 3 in the vicinity of Г point, there will be a larger contribution from the m* of holes in S. This is in agreement with our experimental results. In comparison to TiCoSb, ZrCoSb and HfCoSb, a lower S is observed in this alloy. This is due to the fact that there is contribution from only one Г-pocket in the latter case, whereas, for the other alloys four bands (at Г point) contribute to S. In addition, the presence of both anti-site disorder between Ir/Sb atoms and vacant sites may contribute to the lower value of S in ZrIrSb.
Table 2. The effective mass of holes (at Г point) and electrons (at X point) along the high-symmetry direction.
| Effective mass (m*/me) | ||||
|---|---|---|---|---|
| Valence band | Conduction band | |||
| High symmetry point | Band 1 | Band 2 | Band 3 | Band 4 |
| K-Г-K | 0.16 (0) | 0.55 (0) | 4.32 (0) | — |
| W-Г-W | 0.18 (4) | 0.57 (4) | 1.62 (2) | — |
| X-Г-X | 0.21 (7) | 0.6 (0) | 0.59 (1) | — |
| L-Г-L | 0.15 (0) | 1.42 (4) | 1.40 (9) | — |
| K-X-K | — | — | — | 0.36 |
| W-X-W | — | — | — | 0.34 |
| Г-X-Г | — | — | — | 0.60 |
| L-X-L | — | — | — | 0.41 |
3.3.2. Temperature response of resistivity.
The temperature response of ρ of ZrIrSb in the temperature regime 300–950 K is shown in figure 3(b). At 300 K, the value of ρ is noted to be ∼16 mΩ cm. This value is quite small compared to the values noted for other XCoSb (X = Zr, Hf and Ti) HH alloys [17, 37, 38]. However, it is greater than those reported for other well-known TE materials (as given in table 3) [41–43]. It is observed that ρ decreases non-linearly as a function of temperature up to 370 K. Above 370 K, linear behaviour is noted. With further increment in temperature (above 750 K), an increasing trend in ρ value is observed (as shown in the inset of figure 3(a)). Changes in the slope of the resistivity curve indicate that different conduction mechanisms exist in the measured temperature regime. In addition, as discussed in section 3.3.1, an increment in S is noted as the temperature is increased. These observations support the fact that in ZrIrSb, the electrical transportpossibly occurs via delocalization of localized electrons. Therefore, to identify the mode of electronic transport, the obtained data are analyzed with different types of models available in the literature. One well-known mode of conduction is nearest neighbour hopping (NHH) [44]. There is constant activation energy (Ea) in this mechanism, which is responsible for the hopping of charge carriers to the nearest neighbour sites from their initial position. The ρ is expressed as [44],
Table 3. Comparison between ρ300 K of different TE materials.
| Alloy | Value (mΩ cm) | |
|---|---|---|
| ZrCoSb | 80 | [38] |
| HfCoSb | 20 | [37] |
| TiCoSb | 100 | [17] |
| Bi2Se3 | 0.2 | [41] |
| Cu0.1Bi2Se3 | 6.8 | [41] |
| Sb2Te3 | 2.5 | [42] |
| Bi0.9Sb0.1 | 0.01 | [43] |
where ρ0 is the pre-exponential factor and T is the temperature. In the temperature regime of 370–640 K, the curve is fitted well with equation (3) (shown in the upper inset of figure 3(b)). The value of Ea is estimated to be ∼0.1 eV. However, below 370 K, as mentioned before, non-linear behaviour is observed. This suggests the presence of more than one Ea and points towards a different conduction mechanism. Generally, non-linear temperature variation of ρ is expressed as,
where γ can take the value 1/4, 1/2 and 1/3 depending upon the different conduction models, and T0 is the characteristic Mott's temperature. The curve in the regime 300–370 K is best fitted (using equation (4)) for γ = 1/4 (shown in the lower inset of figure 3(b)). This indicates that conduction in this regime is through Mott's variable range hopping (MVRH), where the hopping length decreases with increment in temperature. In addition, above 750 K, ρ displays metallic-type conduction (as shown in the inset of figure 3(a)). Hence, based on our analysis, it can be concluded that there is transformation from MVRH to NHH at around 370 K, followed by metallic-type conductivity above 750 K.
In addition, the lower magnitude of ρ (near 300 K) in comparison to ZrCoSb (given in table 3) can be attributed to the presence of anti-site disorder between Ir/Sb atoms and vacant sites in ZrIrSb. Due to this disorder, there is always the probability of finding Ir/Sb atoms at 4d position (vacant sites). This can alter the hybridization between Co and Ir atoms, which is responsible for the formation of band gap. It can either lead to a reduction in the band gap or the formation of in-gap electronic states near the VB and CB. A similar effect of anti-site disorder on ρ behaviour is also noted in ZrNiSn [19, 45]. The presence of this disorder is likely to reconcile the lower magnitude of ρ of ZrIrSb alloy in comparison with ZrCoSb. This, along with the non-stoichiometry of the alloy (as reported in section 3.1), can result in the formation of impurity bands near the CB, possibly leading to the observed hopping type of conduction.
3.3.3. Thermal conductivity.
The temperature response of κtotal is shown in figure 4(a). Near 300 K, the magnitude of κtotal is ∼9.3 W mK−1. In comparison with XCoSb family (as listed in table 4), a significant reduction in room-temperature κtotal is noted. From figure 4(a), it can be inferred that κtotal decreases with temperature till 500 K. However, a slight increment in κtotal, followed by a hump is noted in 500–650 K temperature regimes. This hump may be due to the presence of bipolar effect, where both majority (holes) and minority (electrons) carriers contribute to κtotal [46, 47]. Interestingly, above 650 K, κtotal varies as a function of 1/T, reaching the minimum value of ∼2.79 W m−1 K near 950 K.
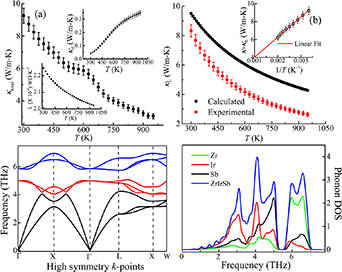
Figure 4. (a) κtotal as a function of temperature. Left inset: temperature-dependent behaviour of L. Right inset: temperature-dependent behaviour of κe in the temperature range 300–950 K. (b) Temperature response of calculated and experimental κL of ZrIrSb in the temperature range 300–950 K. Inset: κtotal − κe as a function of temperature. (c) Phonon dispersion curve of ZrIrSb along high symmetry k-points. (d) Total (in states/eV/f.u) and P-PDOS (in states/eV/atom) of ZrIrSb.
Download figure:
Standard image High-resolution imageTable 4. Comparison of thermal conductivity of XCoSb (X = Ti, Zr and Hf) alloys with ZrIrSb at 300 K.
| Alloy | Value of κtotal (W m−1 K) | |
|---|---|---|
| TiCoSb | 24 | [37] |
| ZrCoSb | 22 | [37] |
| HfCoSb | 12 | [37] |
| ZrIrSb | 9.5 | This work |
Heat transport mechanism in any material is primarily governed by the movement of charge carriers (κe) and through κL. However, in the present case, bipolar effect (κbp) also contributes. Hence, κtotal is defined as,

Each of these components is subtracted from κtotal to obtain the individual contributions to the thermal conductivity. The electronic contribution from κtotal is extracted using:
where L is the Lorentz number. Since ZrIrSb is a non-degenerate semiconductor, variable values of L are used (as shown in the left inset of figure 4(a)), and defined as [48],
The temperature dependence of κe is presented in the right inset of figure 4(a). The value of κe at 300 K is estimated to be around 0.04 W m−1 K, which also increases with temperature, reaching a maximum of ∼0.35 W m−1 K near 950 K. As noted in section 3.3.2, above 750 K, ρ increases with increment in temperature, implying more contribution of charge carriers to κtotal at higher temperatures. In the present case, there is ∼11% contribution of charge carriers to κtotal at 950 K. To estimate the contribution of κbp to κtotal, the method proposed by Kitagawa et al is used [49]. At temperature above Debye temperature (θD), which is ∼297 K for ZrIrSb, the Umklapp phonon scattering mechanism is expected to be dominant, where κL obeys the following relation [48, 50]:
where M is the average mass per atom, V is the average atomic volume and γ is the Gruneisen parameter. From the above equation, it can be said that κL is proportional to T−1. Therefore, κbp can be estimated by subtracting the linear term from κtotal− κe at higher temperatures. This method has been previously used in studying κtotal of CoSb3−x Tex , CoSb3 systems [51, 52]. The κtotal − κe follows the linear behaviour of κL ∼ T−1 quite well up to 500 K (as shown in the inset of figure 4(b)), which confirms the dominance of the Umklapp phonon scattering mechanism. This shows deviation from 500 K, and this temperature can be referred to as bipolar excitation temperature. At high temperature, κL is estimated by extrapolating the linear relationship of the κL ∼ T−1. The resultant curve is shown in figure 4(b). The contributions of κe, κbp and κL to the κtotal are estimated as 11.36%, 2.38% and 86.26% near 950 K, respectively.
Temperature-dependent κL of ZrIrSb is also calculated using anharmonic first-principles phonon calculations. In the calculation, only three phonon processes are considered due to the presence of a negligible separation energy gap between the optical and acoustic phonon branches (discussed in detail in the next paragraph). The κL is estimated under SMRT approximation by solving using the LBTE method [33] and is defined as,
Here, N is the number of unit cells in the crystal, V0 is the volume of the unit cell, cλ
is the mode-dependent specific heat, vλ
is the group velocity of the phonon mode and  is the SMRT of phonon mode λ. Here, λ represents a phonon mode with a wavevector q, branch index j and
  is considered as the lifetime of the phonon mode τλ
. The calculated κL is presented in figure 4(b). It can be observed that the calculated κL decreases with the increase in temperature, which is in agreement with our experimental observations. In the whole temperature range, the calculated value of κL deviates from the observed experimental data. The separation between the curves reduces towards lower temperature. This discrepancy can be due to the presence of defects or anti-site disorder in ZrIrSb.
is considered as the lifetime of the phonon mode τλ
. The calculated κL is presented in figure 4(b). It can be observed that the calculated κL decreases with the increase in temperature, which is in agreement with our experimental observations. In the whole temperature range, the calculated value of κL deviates from the observed experimental data. The separation between the curves reduces towards lower temperature. This discrepancy can be due to the presence of defects or anti-site disorder in ZrIrSb.
As noted above, the transport of heat in ZrIrSb is mainly through the lattice via phonons. Thus, investigation of phonon properties is essential to understand the κL behaviour. Therefore, phonon dispersion along with its electronic structure is calculated using the computational method. This will help us to discern the contribution from the various phonon modes to the κL. The obtained phonon dispersion spectrum along high symmetry directions is presented in figure 4(c). From the figure, it is inferred that all the phonon frequencies are positive, which corroborates that the structural model of ZrIrSb is dynamically stable. For a primitive unit cell containing three atoms, there are three acoustic phonon modes (one longitudinal (LA) + two transverse (TA)) and six optical phonon modes (two longitudinal (LO) + four transverse (TO)) corresponding to those atoms. The phonon modes are classified into three categories: 0–3.5 THz (acoustic modes; black solid lines), 3.5–5.25 THz (low-frequency optical modes; red solid lines) and 5.5–7 THz (high-frequency optical modes; blue solid lines). From figure 4(c), it can be inferred that the separation gap between acoustic and low-frequency optical modes is very small ∼0.64 meV, whereas there is the presence of a large gap between low-frequency and high-frequency optical modes. Due to the presence of a lower energy gap between acoustic and low-frequency optical modes, it is expected that low-frequency optical modes will contribute to κL. The low-frequency optical modes lead to an increment in Umklapp processes, which tends to reduce κL.
In addition, to extract the contribution of different atoms to the acoustic and optical phonon modes, phonon TDOS (P-TDOS) along with the PDOS (P-PDOS) are calculated. P-TDOS per unit cell and P-PDOS per atom are shown in figure 4(d). In analogy to figure 4(c), in the P-TDOS plot, a separation gap between higher-frequency and lower-frequency optical phonon modes can be noted. From the plots of P-PDOS, it can be noted that higher-frequency optical phonon modes (∼5.5–7 THz) are mainly due to lighter Zr atoms. The considerable number of phonon states in the mid-frequency range (∼3.5–5.25 THz) are due to Sb and Ir atoms. However, the main contribution to lower-frequency acoustic phonon modes (∼0–3.5 THz) comes from heavier Ir atoms in the unit cell.
Moreover, based on our experimental results it is noted that the value of κL near room temperature is quite a bit lower [38]. This signifies that the presence of heavier elements has some significant impact on the phonon dispersion of ZrIrSb. The most remarkable difference is noted in the group velocities of acoustic phonon modes. The group velocities of phonon modes are estimated close to Г point. The estimated values are ∼2.6 km s−1/2.6 km s−1/5.2 km s−1 (TA/TA/LA). In addition, flattening of the high-frequency optical phonon branches in the vicinity of Г point is shown in figure 4(c). This signifies that the group velocities (TA/LA) of high-frequency optical phonon modes are negligible. Therefore, the group velocities of acoustic phonon modes can be approximated as sound velocity of the alloy. The calculated values are comparable with the experimentally obtained longitudinal (vL) and transverse (vt) sound velocities (given in table 5). However, as noted from table 5, the values of vL and vt are smaller than those reported for TiCoSb, ZrCoSb and HfCoSb. The reduced sound velocity is due to the fact that, in ZrIrSb, in addition to acoustic phonon modes, the low-frequency optical phonon modes also play a significant role. In addition to this, a distinct variation can be seen in the frequency of optical phonon modes. As noted from figure 4(c), the lowest-frequency optical modes lie near 5 THz, whereas in TiCoSb, ZrCoSb and HfCoSb, they lie near 6.5, 5.9 and 5.2 THz, respectively [53]. Due to the low-lying optical phonon modes, it is expected that there will be strong coupling between optical and acoustic phonon modes, which is absent in the latter alloys. This leads to an increment in Umklapp processes of phonon scattering, which can be observed due to the presence of a large number of optical phonon excitations near the BZ boundary. Hence, it can be concluded that the lower κL noted in this alloy is due to the reduced velocity of phonons and enhancement in the Umklapp process of phonon scattering.
Table 5. Longitudinal and transverse sound velocities of ZrIrSb and XCoSb (X = Ti, Zr and Hf).
| Alloy | Longitudinal (m s−1) | Transverse (m s−1) | ||
|---|---|---|---|---|
| ZrIrSb | Experimental | 4479 | 2486 | This work |
| Calculated | 5203 | 2670 | This work | |
| TiCoSb | Experimental | 5691 | 3230 | [38] |
| ZrCoSb | Experimental | 5488 | 3144 | [38] |
| HfCoSb | Experimental | 4703 | 2709 | [38] |
Ideally, in semiconductors or insulators, the acoustic modes play a significant role in the conduction of heat. However, as discussed above in the present case, the interaction of optical phonon modes with acoustic vibrations cannot be neglected. Hence, the contributions of different phonon modes to κL is analyzed through accumulated lattice thermal conductivity (κC). The accumulated thermal conductivity (κC) is defined as [54],
where κL is given by equation (9). The predicted normalized κC with respect to κL as a function of frequency is presented in figure 5. At 300 K, the contribution of acoustic phonon modes (0–3.5 THz) and lower optical phonon modes (3.5–5.25 THz) is found to be ∼50% and 45%, respectively. However, higher optical phonon modes contribute only 5% to κC. Hence, approximately 95% of the calculated κL is from delocalized low-frequency phonon modes, while higher optical modes contribute insignificantly to κL. This indicates that the phonon modes arising due to heavier elements dominate the heat transport mechanism. It is estimated to be ∼80% at 300 K. Interestingly, as the temperature increases from 300 to 500 K, κC/κL reduces due to the increase in phonon–phonon interactions and higher scattering rates, whereas the contribution from the Ir and Sb phonon modes increases. A similar variation is noted in the 500–700 K and 700–900 K temperature range.

Figure 5. Normalized κC (ω) as a function of frequency (in THz) at four temperatures.
Download figure:
Standard image High-resolution imageIn addition, κL is also sensitive to the magnitude and frequency dependence of relaxation time (τ). Hence, phonon lifetime as a function of phonon frequency at 300, 500, 700 and 1000 K is represented in figure 6. The phonon lifetime is calculated from anharmonic three phonon–phonon scattering mechanisms or Umklapp processes. A sparse distribution of phonon modes can be observed in acoustic and lower optical mode regimes. At 300 K, the longest lifetime (τmax) ∼ 32 ps is noted for phonons belonging to acoustic modes. τ is found to decrease with increment in frequency due to enhancement in phonon scattering events. A similar distribution of modes and trends in τ is noted in lower optical mode regimes. This indicates that phonons from both acoustic and optical modes contribute to κL, which is in agreement with previous observations. However, above 5.5 THz, the rate of decrement of τ is reduced. This behaviour is observed because the phonon number density increases (yellow/orange region) leading to higher scattering rates. Increment in scattering rate subsequently leads to phonon annihilation and ultimately decreases the lifetime of decay. Furthermore, as the temperature increases from 300 to 500 K, τmax decreases, which indicates an enhanced phonon–phonon scattering rate at higher temperature. Hence, a reduced κL is noted. Similar behaviour is noted in the 500–700 K and 700–1000 K temperature regime. Therefore, based onour investigations, it can be said that coupling exists between the acoustic and lower-lying optical phonon modes originating due to Ir and Sb atoms, which plays a critical role in the thermal transport mechanism of ZrIrSb. This behaviour is quite different to raditional understanding of thermal transport. In our case, a lower κL is expected due to contribution from both modes. However, due to the large distribution of phonon modes in this regime (0–5.25 THz), a large κL is observed. In addition, the decrement in κL with increment in temperature can be attributed to decrement in τ of the acoustic and lower optical phonon modes, which is an outcome of enhanced phonon–phonon scattering rate.

Figure 6. Phonon lifetime as a function of phonon frequency at (a) 300 K, (b) 500 K, (c) 700 K and (d) 1000 K. Phonon modes are displayed in black, while the coloured background represents the density of the phonon modes in the corresponding region.
Download figure:
Standard image High-resolution imageFinally, in order to evaluate the TE efficiency of the material, the ZT is estimated using the following equation [48]:
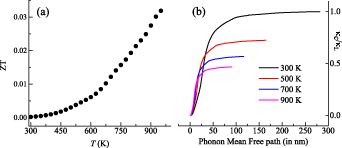
The ZT obtained experimentally for ZrIrSb is shown as a function of temperature in figure 7(a). The ZT value for ZrIrSb is ∼0.032 at 950 K, which is larger than those reported for similar alloys, such asTiCoSb, ZrCoSb and HfCoSb [37, 38]. The large value for ZrIrSb may be due to the lower value of ρ and κL. To enable this alloy to be used for TE conversion, an efficient method is to further decrease its κL. Various strategies, such as nano-structuring, construction of heterojunctions, introducing mass or strain effect, have been employed by researchers [55, 56]. Among these, we have further discussed the possibility of employing nano-structuring as an effective tool to decrease κL. In this strategy, the particle size is reduced, which in turn results in the decrement of the phonon mean free path (MFP). Hence, to explore this possibility, the size effect on κL is evaluated through the summation of contributions from all phonon modes in ZrIrSb. The ratio κC/κL plotted as a function of MFP is shown in figure 7(b). At 300 K, it is noted that 10 nm size crystals can reduce κL by ∼87% compared to the bulk, which in turn may increase the ZT substantially. Similar improvements are achievable at 500 K, 700 K and 900 K operating temperatures. Thus, it would be interesting to explore the TE properties of similar alloys through nano-structuring.
Figure 7. (a) ZT as a function of temperature in the temperature regime 300–950 K. (b) Normalized κC (ω) as a function of phonon MFP (in nm) at four temperatures.
Download figure:
Standard image High-resolution image
4. Conclusion
The combined experimental and theoretical investigation on ZrIrSb reveals that this alloy is a p-type semiconductor. It has been observed that the magnitude of electronic parameters (ρ and S) is adversely affected by the anti-site disorder between heavier elements (Ir/Sb) and vacant sites. Interestingly, in this alloy, κL is dominated by Umklapp processes originating due to the coupling between acoustic and low-frequency optical phonon modes, resulting in a reduction in heat conduction. In addition, the obtained ZT is among the highest as noted for analogue alloys. Our investigation may provide a pathway for researchers to explore the TE properties of heavy-constituent HH alloys through nano-structuring for potential TE applications.
Acknowledgment
KM acknowledges financial support from DST-SERB Project CRG/2020/000073.
Data availability statement
All data that support the findings of this study are included within the article (and any supplementary files).