

Abstract
We present detailed studies on spinel structured Ni0.5CoxZn0.5−xFe2O4 (x = 0.1, 0.2 and 0.3), synthesized by sol–gel combustion method. In addition to the structural properties, we present optical dielectric and magnetic response of this system as a function of x. From x-ray diffraction analysis, a single-phase formation in cubic spinel structure was confirmed with an average crystallite size (Davg) variation of 46–61 nm. X-ray diffractograms were analyzed to evaluate the lattice constant (a), x-ray density (ρx) and porosity (P) in percentage. Energy dispersive x-ray spectroscopy was used to delimit the compositional mass ratios. Terahertz (THz) time-domain spectroscopy measurements were performed to investigate the refractive index ( ) of the samples at room temperature in a frequency range from 0.2 to 2.5 THz. Real and imaginary components of complex optical dielectric constant (
 ) with the increase of Co2+ content were deduced using THz spectroscopy data. The complex optical dielectric constant for the substitution of Co2+ content at x = 0.1, 0.2 and 0.3, was determined within 5% error ∼9.6 + i0.07, ∼10.9 + i0.2 and ∼11.7 + i0.5, respectively. The magnetic measurements were performed at a temperature range of 300–50 K using a superconducting quantum interference device vibrating sample magnetometer under an applied magnetic field of ±5 tesla. We found the highest saturation magnetization (Ms) of about 86.7 emu g−1, 83.5 emu g−1 and 80.4 emu g−1 for the substitution of Co2+ content at x = 0.1, 0.2 and 0.3, respectively at room temperature.
Export citation and abstract BibTeX RIS
1. Introduction
Spinel ferrites are compounds with a generic formula MFe2O4, where M is a divalent cation and Fe is a trivalent cation. These ferrites exhibit a cubic crystal structure which can be considered as an interlocking network of both positively and negatively charged metal ions. The unit cell of spinel ferrites consists of eight formula units of AB2O4, where A and B are the respective tetrahedral and octahedral sites in the spinel structure. The ideal spinel structure has a cubic crystal symmetry of Fd-3m (227) space group. Based on the cation distribution, the mixed spinel structure can be categorized by (M1−x
Fex
)[Mx
Fe2−x
]O4, where 'x' is an inversion factor. The () and [] brackets indicate tetrahedral site (A-site) and octahedral site (B-site) of the spinel structure respectively [1]. NiCoZn ferrite belongs to this category whose cation distribution can be explained by the Neel's two sub-lattice model. The A-site is occupied by (Fe3+Zn2+) ions and B-site is occupied by [Fe3+Co2+Ni2+] ions. Spinel ferrites are in focus of current research due to their fascinating physics and potential applications. The substitution of different cations in the ferrite materials synthesized by dissimilar methods has attracted significant interest from application and fundamental physics point of view. A change in cation distribution at tetrahedral and octahedral sites is an essential step to modify the electric, dielectric, optical and magnetic properties of the ferrite materials. As a matter of fact, this distribution depends on various factors like the method of preparation, substitution of different cations, chemical composition and sintering temperature [2, 3]. NiCoZn ferrite is the soft magnetic ceramic mostly used in numerous fields such as magnetic cores, memory storage devices, electronic devices, magnetic drug delivery, humidity sensors, microwave absorbers and antenna materials [4–8]. Souriou et al reported dielectric parameters of NiCoZn ferrites for antenna miniaturization in the frequency range of 0.1–0.7 GHz and found that the permittivity and tangent loss were about ∼4 − j0.2 and ∼0.02, respectively. The novelty reported in this paper is the extended frequency studies of Ni0.5Cox
Zn0.5−x
Fe2O4 (x = 0.1, 0.2 and 0.3) in the terahertz (THz) frequency regime. These ferrites with sufficiently low dielectric (tanδ = ''/') and magnetic (tanδμ
= μ''/μ') losses, and a higher refractive index (n= √'/μ') could be promising candidates for antenna miniaturization. For the low loss requirement, it is necessary that the resonant frequency must be far from the desired frequency band of the material [9, 10]. The required condition for the reduction of antenna size also depends on the material preparation, calcination and sintering temperatures. The purpose of our work is to improve the dielectric constant and reduce dielectric loss in THz frequency range by partially substituting Co2+ content in NiZn ferrite for designing of miniaturized antennas. In this regard, we focused to synthesize Ni0.5Cox
Zn0.5−x
Fe2O4 (x = 0.1, 0.2 and 0.3) using the sol–gel combustion method, however, many researchers have synthesized NiCoZn ferrites by physical and chemical routes such as solid-state reaction [11], self-sustaining [3], auto-combustion [12], chemical co-precipitation [13], sol–gel [2], double-sintering technique [14], etc. The main advantages of the sol–gel combustion are; fast synthesis process, low energy consumption and high purity of product [15]. Therefore, it is one of the best approaches for material synthesis. This paper is organized as follows. In section 2, we present the material synthesis details followed by results and discussion section covering the structural, optical dielectric, and magnetic properties of the synthesized material with different compositions.
= ''/') and magnetic (tanδμ
= μ''/μ') losses, and a higher refractive index (n= √'/μ') could be promising candidates for antenna miniaturization. For the low loss requirement, it is necessary that the resonant frequency must be far from the desired frequency band of the material [9, 10]. The required condition for the reduction of antenna size also depends on the material preparation, calcination and sintering temperatures. The purpose of our work is to improve the dielectric constant and reduce dielectric loss in THz frequency range by partially substituting Co2+ content in NiZn ferrite for designing of miniaturized antennas. In this regard, we focused to synthesize Ni0.5Cox
Zn0.5−x
Fe2O4 (x = 0.1, 0.2 and 0.3) using the sol–gel combustion method, however, many researchers have synthesized NiCoZn ferrites by physical and chemical routes such as solid-state reaction [11], self-sustaining [3], auto-combustion [12], chemical co-precipitation [13], sol–gel [2], double-sintering technique [14], etc. The main advantages of the sol–gel combustion are; fast synthesis process, low energy consumption and high purity of product [15]. Therefore, it is one of the best approaches for material synthesis. This paper is organized as follows. In section 2, we present the material synthesis details followed by results and discussion section covering the structural, optical dielectric, and magnetic properties of the synthesized material with different compositions.
2. Material synthesis
2.1. Materials used
We have used analytical grade reagents; Ni nitrate [Ni(NO3)2·6H2O] (purity: ⩾97.0%, Sigma Aldrich), Co nitrate [Co(NO3)2·6H2O] (purity: ⩾98%, Sigma Aldrich), Zn nitrate [Zn(NO3)2·6H2O] (purity: 98%, Sigma Aldrich), ferric nitrate [Fe(NO3)3·9H2O] (purity: ⩾98%, Sigma Aldrich) as oxidizing agents, and glycine [NH2CH2COOH] (purity: ⩾99%, Sigma Aldrich) as a reducing agent and deionized water.
2.2. Synthesis of Ni0.5Cox Zn0.5 −x Fe2O4 ferrites
The compositions of Ni0.5Cox Zn0.5−x Fe2O4 (x = 0.1, 0.2 and 0.3) are synthesized using the chemical sol–gel combustion route as shown in figure 1. In this method, the high purity metals; Ni, Co, Zn and Fe nitrates are used. Glycine is selected as a reducing agent to drive the combustion reaction due to its more cost-effectiveness and greater combustion rate (−3.24 kcal g−1) compared to urea (−2.98 kcal g−1) and citric acid (−2.76 kcal g−1) [16, 17]. Stoichiometric ratio of fuel to nitrate (1:1.25) for sol–gel combustion is calculated based on the total reducing and oxidizing valencies of the fuel and oxidizer. Initially, a homogenous solution is prepared by dissolving the metal nitrates and glycine in a minute volume of deionized water. The resultant solution is poured into a beaker and heated at 100 °C for 4 h under constant stirring to form a viscous gel. Afterwards, the beaker is kept in a muffle furnace at 350 °C for auto-ignition. The whole combustion process is completed within 30 min whereas the actual time of ignition is small (nearly ⩽5 s). During the combustion, a huge amount of gases; N2, CO2, and O2, and H2O vapors are emitted and a loose-brownish powder is formed as a product. These powders are crushed and ground manually and calcined at 800 °C for 15 min in a microwave furnace. Subsequently, the powders are mixed with 2 wt% polyvinyl alcohol and pressed them into disc-shaped pellets (10 mm dia) by using hydraulic press which is used to apply a uniform pressure of 6 tons. Finally, the pellets are sintered at 1250 °C for 2 h under an ambient air atmosphere in a high-temperature muffle furnace. The furnace temperature is ramped at a rate of 5 °C min−1.

Figure 1. Schematic for synthesis of NiCoZn ferrite.
Download figure:
Standard image High-resolution image2.3. Sol–gel combustion reactions
Based on propellant chemistry to prepare stoichiometric redox mixtures, the ratio of net reducing valency of the fuel to the net oxidizing valency of metal nitrates should be one [18, 19]. Normally, in the case of ferrites, the divalent and trivalent metal nitrates have the oxidizing valencies as 10− and 15−, respectively and the glycine has the reducing valency as 9+. The net oxidizing valency of the individual nitrate should be balanced by the net reducing valency of glycine. In our experiment, the redox reactions for Ni0.5Cox Zn0.5−x Fe2O4 at x = 0.1, 0.2 and 0.3 can be expressed as follows:
where (c) = crystalline, (g) = gas.
2.4. Material characterizations
The ferrite powders are calcined in a microwave muffle furnace (CEM Phoenix). X-ray diffractograms of Ni0.5Cox Zn0.5−x Fe2O4 (x = 0.1, 0.2 and 0.3) are recorded on Rigaku Smart Lab x-ray diffractometer with CuKα (λ = 1.5406 Å) radiation in 2θ range from 10° to 80° with a step size of 0.01° at room temperature. The elemental compositions of the samples are obtained using a field emission‐scanning electron microscope (FEG-SEM: JEOL, JSM-7600F) equipped with an Oxford Instruments EDS Microanalysis X-Max-80 mm2 system.
THz-TDS measurement is performed using a homemade THz time-domain spectroscopy (TDS) setup in a frequency range from 0.2 to 2.5 THz. The setup has a mode locked Ti:sapphire laser (Femtosource Synergy) having ultrashort pulses of duration 10 fs, wavelength centered at 800 nm and a repetition rate of 78 MHz. These pulses are focused on low temperature-GaAs (LT-GaAs) based THz source (BATOP GmbH) to generate THz pulses. The THz spectra are experimentally obtained by transmitting THz through the fabricated NiCoZn ferrite samples at room temperature. The transmitted THz radiation is obtained using ZnTe based electro-optic technique. In our THz measurement, we use NiCoZn ferrite disc-shaped pellets with a thickness of 500 μm of each. A THz signal passing through the polycrystalline sample with two flat and parallel sides at a normal angle of incidence, assuming that there are no reflections, can be considered as a sample signal, that is given below [20, 21],
where η is the transmission factor of the free space surrounding the sample, the complex refractive index,  = ns + iκs, where ns is the index of refraction, κs is the extinction coefficient, ω is the angular frequency, t is the sample thickness, c is the speed of light in vacuum and E0(ω) is the incident wave. The spectral component of the electric field of the THz signal passes in the absence of the sample can be considered as a reference signal,
The magnetic measurement is carried out using superconducting quantum interference device (SQUID) magnetometer (Quantum Design, USA) at a different temperature range from 300 to 50 K.
3. Results and discussion
3.1. Structural analysis
X-ray diffractograms of Ni0.5Cox Zn0.5−x Fe2O4 (x = 0.1, 0.2 and 0.3), samples sintered at 1250 °C are shown in figure 2(a). The x-ray diffraction (XRD) data of these samples are matched with the standard patterns (ICDD: 01-078-6781, ICDD: 01-074-6403, and ICDD: 01-071-4920) of NiFe2O4, CoFe2O4 and ZnFe2O4, respectively. The main reflections are observed at hkl values of (111), (220), (311), (222), (400), (422), (511), (440), (620), (533), (622) and (444) and labeled them. The XRD results of the samples have confirmed the formation of FCC single-phase spinel structure at room temperature and revealed that the samples are polycrystalline. In figure 2(b), it is showed that there is a continuous shift in 2θ towards the higher angle side with the increase in Co2+ content in NiZn ferrite. Therefore, this angle shift towards the higher values is ascribed to decrease in lattice constant. The lattice constants of the samples are obtained from the highest intensity-indexed reflection (311) to minimize the error in lattice constant-calculation using equation (4). The crystallite sizes of the samples are determined from the peak-broadening, detected in the XRD patterns using the Debye–Scherrer formula (equation (5)) [22],

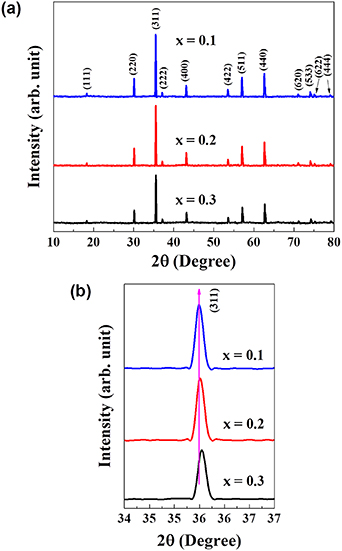
Figure 2. (a) XRD pattern of Ni0.5Cox Zn0.5−x Fe2O4 (x = 0.1, 0.2 and 0.3), sintered at 1250 °C for 2 h, (b) shift in 2θ with the increase in Co2+ content.
Download figure:
Standard image High-resolution imagewhere λ is the wavelength of x-rays (1.5406 Å), β is the full-width at half-maxima in radian and θ is the angle of diffraction. The x-ray density (ρx) of the pellets is calculated using equation (6) given by Smith and Wijn [23],
where M is the molecular weight of the sample, n is the number of formula units present in a unit cell (for NiCoZn ferrite, n = 8) and NA is the Avogadro's number.
In Archimedes' method, the experimental density (ρexp) of the samples is measured by using the formula,  where ws,a is the weight of sample in air, wl is the weight of liquid displaced by the sample and ρl is the density of liquid (distilled water). The weight of displaced liquid can be extracted by measuring the weight of sample in air (ws,a) and in liquid (ws,l) and considering the difference between them, as described below [24],


Thus, the obtained densities of the samples were around 90%–93% of that estimated by x-ray method. This 7%–10% loss of densities could be due to the presence of binder, possible porosity in the pellets and other anomalies arising from the material synthesis process. The porosity in percentage of the samples is then determined by using the experimental density and x-ray density. That is given by [25],
The lattice constants, lattice volumes, x-ray densities, experimental densities, percentage of porosities and the average crystallite sizes of the samples as a function of x are tabulated in table 1.
Table 1. Structural parameters of Ni0.5Cox Zn0.5−x Fe2O4 (x = 0.1, 0.2 and 0.3).
| Sample | x = 0.1 | x = 0.2 | x = 0.3 |
|---|---|---|---|
| Lattice constant, a (Å) | 8.3867 | 8.3820 | 8.3746 |
| Lattice volume, V (Å3) | 589.91 | 588.91 | 587.35 |
| X-ray density, ρx (g cm−3) | 5.34 | 5.33 | 5.33 |
| Experimental density, ρexp (g cm−3) | 4.87 | 4.83 | 4.97 |
| Porosity, P in percentage | 8.69 | 9.50 | 6.87 |
| Average crystallite size, Davg (nm) | 54 ± 7 | 51 ± 6 | 46 ± 5 |
3.2. Energy dispersive x-ray spectroscopy (EDX)
In energy dispersive x-ray spectroscopy (EDX) analysis, a bulk amount of these samples are mounted on conductive paint-coated aluminum stubs and then coated with 10 nm thick iridium layer. EDX spectra of the samples are displayed at 10 keV in figures 3(a)–(c). The compositional results (in wt% and at%) for all the elements present in the samples at x = 0.1, 0.2 and 0.3 are given in the tables insets of figures 3(a)–(c), respectively. The spectra of the samples specified the presence of C, O, Fe, Co, Ni, Zn and Ir elements as the major elements elucidated with the non-appearance of other impurities. The presence of C and Ir are due to the conductive paint (carbon tape) and iridium-coating, respectively, which are applied before the measurement. However, the x-ray emission from the conductive layer and conducting paint as well as from the stub itself obstructs an accurate detection of Ir, C and Al [26, 27].
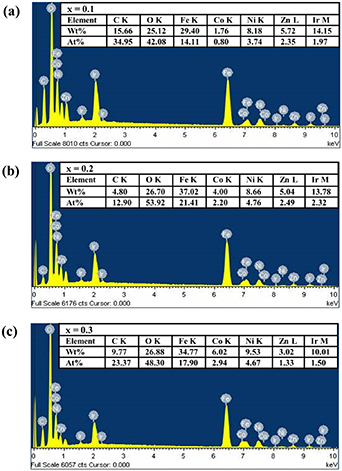
Figure 3. EDX spectrums of Ni0.5Cox Zn0.5−x Fe2O4 at (a) x = 0.1, (b) x = 0.2 and (c) x = 0.3.
Download figure:
Standard image High-resolution image3.3. Terahertz time-domain spectroscopy
3.3.1. Optical parameter extraction: complex transmission coefficient, refractive index and optical dielectric constant.
The optical properties of Ni0.5Cox
Zn0.5−x
Fe2O4 (x = 0.1, 0.2 and 0.3) compositions are characterized by the frequency dependent complex transmission coefficient (T), refractive index ( ) and optical dielectric constant (
 ). The parameter extraction process of the material necessitates two spectra, Es(ω) and Eref(ω) which are the Fourier transforms of time-domain measurements. The complex transmission coefficient of the samples in frequency domain is obtained by dividing the sample signal Es(ω) to the reference signal Eref(ω) which is expressed as,
where nair is the refractive index of air. Considering a weakly absorbing medium in which  (ω) ≫ κs(ω), the complex transmission coefficient without Fabry–Perot term is given by replacing
  (ω) with ns(ω). In equation (10), the real and imaginary parts of the complex transmission coefficient are dispersive and are given by ns(ω) and κs(ω). The transmission amplitude of Ni0.5Cox
Zn0.5−x
Fe2O4 (x = 0.1, 0.2 and 0.3) samples as a function of frequency is shown in figure 4. It is found that at longer frequencies, the transmission decreases in the polycrystalline samples. The maximum transmission amplitude is observed for the minimum substitution of Co2+ content at x = 0.1 in NiZn ferrite. Accordingly, as the Co2+ content is increased, the transmittance decreases. Now it is a well-known fact that the conduction in ferrites occurs due to the electron hopping between Fe3+ and Fe2+ at octahedral sites [28]. In the case of spinel ferrites, beyond a certain frequency of electric field, an electronic exchange, Fe3+ ↔ Fe2+ cannot follow the alternating field of THz radiation, decreasing the response to the incident field, due to which the resulting polarization decreases with increasing frequency when there is no cobalt present. Based on Rezlescu model, the conduction mechanism can be attributed to the presence of combined contribution of p-type (holes) and n-type (electrons) charge carriers [29]. The substitution of cobalt in NiZn ferrite results in hopping of holes between Co2+ and Co3+ and hopping of electrons between Fe2+ and Fe3+ that can be expressed as, Co2+ + Fe3+ ↔ Co3+ + Fe2+. Thus the increasing amount of Co2+ content would cause an increase in the number of charge carriers that lead to the increase of conduction and the decrease of transmission of THz radiation thereby causing increase in polarizability and optical dielectric constant [30].
(ω) with ns(ω). In equation (10), the real and imaginary parts of the complex transmission coefficient are dispersive and are given by ns(ω) and κs(ω). The transmission amplitude of Ni0.5Cox
Zn0.5−x
Fe2O4 (x = 0.1, 0.2 and 0.3) samples as a function of frequency is shown in figure 4. It is found that at longer frequencies, the transmission decreases in the polycrystalline samples. The maximum transmission amplitude is observed for the minimum substitution of Co2+ content at x = 0.1 in NiZn ferrite. Accordingly, as the Co2+ content is increased, the transmittance decreases. Now it is a well-known fact that the conduction in ferrites occurs due to the electron hopping between Fe3+ and Fe2+ at octahedral sites [28]. In the case of spinel ferrites, beyond a certain frequency of electric field, an electronic exchange, Fe3+ ↔ Fe2+ cannot follow the alternating field of THz radiation, decreasing the response to the incident field, due to which the resulting polarization decreases with increasing frequency when there is no cobalt present. Based on Rezlescu model, the conduction mechanism can be attributed to the presence of combined contribution of p-type (holes) and n-type (electrons) charge carriers [29]. The substitution of cobalt in NiZn ferrite results in hopping of holes between Co2+ and Co3+ and hopping of electrons between Fe2+ and Fe3+ that can be expressed as, Co2+ + Fe3+ ↔ Co3+ + Fe2+. Thus the increasing amount of Co2+ content would cause an increase in the number of charge carriers that lead to the increase of conduction and the decrease of transmission of THz radiation thereby causing increase in polarizability and optical dielectric constant [30].
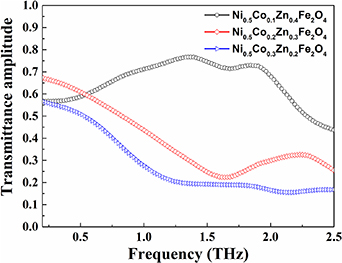
Figure 4. Terahertz transmission spectra of Ni0.5Cox Zn0.5−x Fe2O4 (x = 0.1, 0.2 and 0.3) samples at room temperature.
Download figure:
Standard image High-resolution imageThe real and imaginary parts of refractive index of the samples are extracted by taking the argument and logarithm of the complex transmission coefficient in thick-sample approximation, that is given by,


Figure 5 shows the refractive index of Ni0.5Cox
Zn0.5−x
Fe2O4 (x = 0.1, 0.2 and 0.3) samples in the frequency range 0.2–2.5 THz. It is observed that the index of refraction (ns) and the extinction coefficient (κs) are slightly varied between about 3.1–3.4 and 0.01–0.1, respectively, for the increasing amount of Co2+ content. After extracting the refractive index, we obtain the optical dielectric constants of the samples by using the relation,  These ferrites reveal almost constant complex optical dielectric constants ∼9.6 + i0.07, ∼10.9 + i 0.2 and ∼11.7 + i0.5 within 5% error for the substitution of Co2+ content at x = 0.1, 0.2 and 0.3, respectively. Based on Lorentz model, the frequency dependent complex optical dielectric constant is expressed as [31–33],
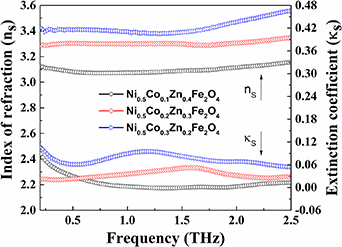
Figure 5. Frequency dependent refractive index: index of refraction (left y-axis) and extinction coefficient (right y-axis) of Ni0.5Cox Zn0.5−x Fe2O4 (x = 0.1, 0.2 and 0.3) samples.
Download figure:
Standard image High-resolution imagewhere ∞ is the high frequency dielectric constant, gj
(=Δjωj
2
) represents the oscillator strength for the jth resonance, Δj
is the dielectric contribution, ω (=2π f) is the angular frequency, ωj
is the resonance frequency and γj
is the damping factor
As per the Lorentzian expressions, the real and imaginary components of the optical dielectric constant for the ferrites sintered at 1250 °C for j= 1 and 2, are used to obtain the optical dielectric parameters using equations (16) and (17). The damping factor obtained from the fit to the complex optical dielectric constant describes the scattering time (τj or dielectric relaxation constant) of the modes present. The fitting parameters for Ni0.5Cox Zn0.5−xFe2O4 (x = 0.1, 0.2 and 0.3) samples are tabulated in table 2. The theoretical curves of the complex optical dielectric constant are used to fit the real and imaginary parts of experimentally observed optical dielectric constant.
Table 2. Optical dielectric parameters of Ni0.5Cox
Zn0.5−x
Fe2O4 (x = 0.1, 0.2 and 0.3) extracted from fitting the experimental data of 's (ω) and ''s (ω).
| Sample | x = 0.1 | x = 0.2 | x = 0.3 |
|---|---|---|---|
|
∞
| 9.6 ± 0.5 | 10.7 ± 0.6 | 11.1 ± 0.6 |
| Δ1
| 1.4 ± 0.1 | 2 ± 0.1 | 2.6 ± 0.1 |
| Δ2
| 0.01 ± 0.001 | 0.2 ± 0.01 | 0.6 ± 0.03 |
| ω1/2π (THz) | 0.3 ± 0.01 | 0.4 ± 0.02 | 0.9 ± 0.04 |
| ω2/2π (THz) | 1.9 ± 0.1 | 1.7 ± 0.1 | 1.7 ± 0.1 |
 (ps) (ps) | 1.2 ± 0.1 | 0.1 ± 0.01 | 0.06 ± 0.003 |
 (ps) (ps) | 1 ± 0.1 | 0.7 ± 0.03 | 0.5 ± 0.02 |
Figure 6 shows that the experimental data is fitted well for the substitution of Co2+ content at x = 0.1 and 0.2, however, we find some deviation of the fit curve at x = 0.3 of the real component (left; y-axis) of the optical dielectric constant. This is due to the low signal to noise ratio as we go towards high THz frequency limit. Excellent fits are obtained for the substitution of Co2+ content at x = 0.1, 0.2 and 0.3 to the imaginary component (right; y-axis). The complex optical dielectric constants are expressed in terms of high frequency dielectric constant (∞), two distinct values of dielectric contribution (Δ1) and (Δ2), resonance frequencies (f1) and (f2), and the dielectric relaxation constants (τ1) and (τ2) are listed in table 2.
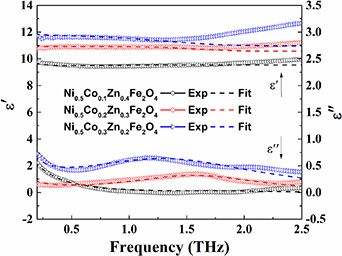
Figure 6. Frequency dependent optical dielectric constant: (left y-axis) real and (right y-axis) imaginary parts of Ni0.5Cox Zn0.5−x Fe2O4 (x = 0.1, 0.2 and 0.3) measured by THz time-domain spectroscopy, sintered at 1250 °C.
Download figure:
Standard image High-resolution imageWe experimentally find that the substitution of Co2+ content in NiZn ferrite enhances the conduction in the samples due to the additional charge carriers. This reduces the transmission of THz through the samples. From the parameters obtained in table 2, we find that the substitution of Co2+ content leads to the decrease in the higher mode frequency and increase in the lower mode frequency in the dielectric response of the samples. The strength of these modes also becomes higher with the increase in the substitutional Co2+ content due to availability of more carriers. This is consistent with the more carriers, decreasing the tight binding in the lattice. It is also evident from the lower mode gaining more strength and blue shifting while higher mode is red shifting as seen in the table.
3.4. Magnetic analysis
Magnetic hysteresis loops of Ni0.5Cox Zn0.5−x Fe2O4 (x = 0.1, 0.2 and 0.3) samples are presented in figures 7(a)–(c). These are obtained at a temperature range from 300 to 50 K under an applied magnetic field of ±5 tesla. It is found from the figures that M-H loops are S-shaped and ferromagnetic. Low values of coercivity (or narrow-shaped curves) confirm the soft magnetic nature of the ferrites which are depicted in the insets of M-H plots. The experimental values of magnetic parameters; saturation magnetization (Ms), remanent magnetization (Mr) and coercivity (Hc) of the samples are summarized in tables 3(a)–(c). The saturation magnetization as a function of the applied field has been found to decrease significantly with increasing Co2+ content at room temperature as revealed in figure 8.
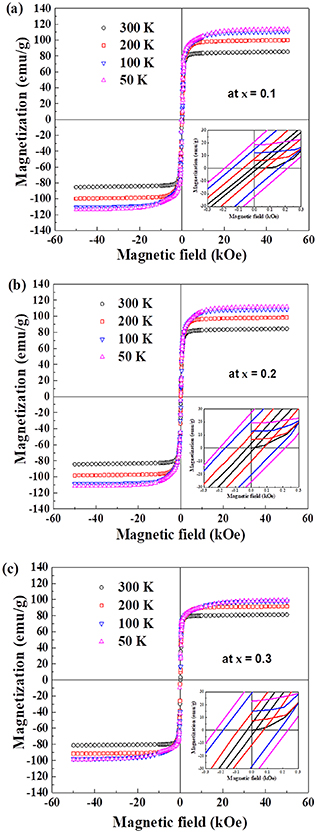
Figure 7. Magnetic hysteresis loops of Ni0.5Cox Zn0.5−x Fe2O4 samples at; (a) x = 0.1, (b) x = 0.2 and (c) x = 0.3, measured at 300 K, 200 K, 100 K and 50 K sintered at 1250 °C for 2 h.
Download figure:
Standard image High-resolution image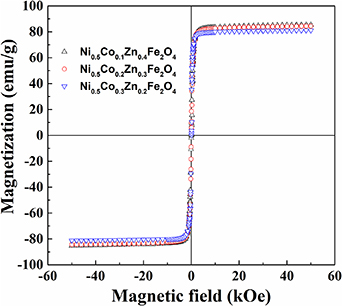
Figure 8. Room temperatures hysteresis of Ni0.5Cox Zn0.5−x Fe2O4 samples at; (a) x = 0.1, (b) x = 0.2 and (c) x = 0.3.
Download figure:
Standard image High-resolution image
Table 3. Magnetic parameters of Ni0.5Cox Zn0.5−x Fe2O4 (x = 0.1, 0.2 and 0.3) samples.
| (a) | x = 0.1 | T (K) | 300 | 200 | 100 | 50 |
| Ms (emu g−1) | 86.7 | 102.1 | 112 | 114.8 | ||
| Hc (Oe) | 17 | 71 | 148 | 202 | ||
| Mr (emu g−1) | 1.71 | 7.46 | 15.56 | 21.86 | ||
| (b) | x = 0.2 | T (K) | 300 | 200 | 100 | 50 |
| Ms (emu g−1) | 83.5 | 100.6 | 111.7 | 112.5 | ||
| Hc (Oe) | 24 | 77 | 164 | 208 | ||
| Mr (emu g−1) | 3.1 | 10.3 | 20.4 | 26.6 | ||
| (c) | x = 0.3 | T (K) | 300 | 200 | 100 | 50 |
| Ms (emu g−1) | 80.4 | 93.9 | 97.3 | 99.2 | ||
| Hc (Oe) | 28 | 81 | 182 | 236 | ||
| Mr (emu g−1) | 4.6 | 12.5 | 29 | 37.4 |
Generally, the Ms depends upon several factors; superexchange (A-B exchange) interaction, moment of atoms, anisotropy constant of magnetic crystals, size of grains, temperatures and a technique for material synthesis [34, 35]. The superexchange interaction between the metal ions at A- and B-sites in the spinel structure plays an important role for magnetic order [1]. In NiCoZn ferrite, Zn2+ often occupies tetrahedral site (A-site) due to its electronic configuration (orbital orientations) that favors tetrahedral bonding with the oxygen ions and Ni2+ often occupies octahedral site (B-site) because of higher crystal field stabilization energy [36, 37]. Fe3+ and Co2+ contents can occupy both the sides; either the A- or the B-sites. Based on lattice constant variation, it is concluded that Co2+ content prefers octahedral site [7]. The cationic distribution depends upon the ionic radius of the cations and the method for material preparation [38, 39]. Neel had proposed a two sub-lattice model of collinear spin arrangement. According to this model, the net magnetic moment (M) in ferrites is given by [1, 6],

where MA and MB are the magnetic moments on A- and B-sites in Bohr magneton (μB), respectively. In the experimental design, Co nitrate decomposes into Co3O4 (Co3+) during the pre-sintering process. Further decomposition of Co3O4; Co3O4
 3CoO +
  O2, leads to the formation of CoO (Co2+) at the sintering temperature of 1250 °C. As a result, Co3+ transforms to Co2+ because of the reducibility of Fe2+ as indicated by the reaction, Co3+ + Fe2+
 Co2+ + Fe3+. Therefore, the number of Fe3+ content increases due to the replacement of Fe2+ content by the small amount of Co3+ content at B-site. When the reduction reaction is completed, the more number of Co2+ content are added meanwhile the resultant magnetic moment decreases. The decreasing trend of magnetic moment is due to the magnetic moment at A-site is constant while the magnetic moment at B-site decreases at the same time. This decrease of magnetic moment is led by the magnetic moment of Co2+ content that replaced Fe3+ content at B-site [40–42]. According to equation (18), the theoretical values of magnetic moment per formula unit in Bohr magneton of the samples at room temperature are calculated 5.3 μB, 4.6 μB and 3.9 μB for x = 0.1, 0.2 and 0.3, respectively, using the cation distribution and their estimated room temperature magnetic moments of Ni2+ (2 μB), Co2+ (3 μB), Zn2+ (0 μB) and Fe3+ (5 μB). On the other hand, the measured values of the magnetic moment per formula unit in the Bohr magneton are estimated around 3.68 μB, 3.53 μB and 3.50 μB using equation (19) for x = 0.1, 0.2 and 0.3, respectively [23],
where M is the molecular weight of the sample, and  . Thus according to equations (18) and (19), the variation in lattice constant (a) with increasing Co2+ content results in decrease of the saturation magnetization. So this decreasing behavior of Ms depends upon various factors such as; nonmagnetic ions, composition, crystal structure and defects [43]. The magnetic parameters for nickel–cobalt–zinc ferrites prepared by dissimilar methods and sintered at different temperatures are reported in table 4.
Table 4. Magnetic properties of nickel–cobalt–zinc ferrites reported in literature.
| Composition | Technique of synthesis | Sintering temperature (°C) | T (K) | Ms (emu g−1) | Hc (Oe) | References |
|---|---|---|---|---|---|---|
| Ni0.5Cox Zn0.5−x Fe2O4 (x = 0.1, 0.2 and 0.3) | Sol–gel combustion | 1250 | 300 | 86.7–80.4 | 17–28 | Present work |
| Ni0.25Co0.5Zn0.25Fe2O4 | Solid state reaction | 1250 | 300 | 90.5 | 20.1 | [44] |
| Ni0.5Co0.5−x Znx Fe2O4 (0 ⩽ x ⩽ 0.5) | Citrate based sol–gel | 1200 | 300 | 57.12–64.89 | 250.1–2.8 | [2] |
| Ni0.5Zn0.5Cox Fe2−x O4 (0.00 ⩽ x ⩽ 0.25) | Solid state reaction | 1050 | 5 | 133.5–120.32 | 584–602.6 | [42] |
| 300 | 81.137–71.138 | 115.3–79.0 | ||||
| Ni0.5Co0.2Zn0.3Fe2O4 | Solid-state reaction | 800 | 3 | 86.8 | 556.2 | [11] |
| 300 | 57.1 | 99.4 | ||||
| Ni0.8−x Co0.2Znx Fe2O4 (x = 0.2, 0.4 and 0.6) | Chemical coprecipitation | 600 | 300 | 45.55–30.86 | 59.08–0.20 | [45] |
4. Conclusions
Ni0.5Cox
Zn0.5−x
Fe2O4 (x = 0.1, 0.2 and 0.3) samples have been successfully synthesized by using the sol–gel combustion method. XRD analysis confirmed single-phase formation of the spinel structure. The stoichiometry of the samples was explored using EDX analysis. THz-TDS was used to measure the refractive index of the samples at room temperature in a frequency range from 0.2 to 2.5 THz. The complex optical dielectric constant was deduced from the equation,  =
=  . It was found ∼9.6 + i0.07, ∼10.9 + i0.2 and ∼11.7 + i0.5 within 5% error for the substitution of Co2+ content at x = 0.1, 0.2 and 0.3, respectively. The M-H hysteresis curves revealed that the saturation magnetization, coercivity and remanent magnetization vary from ∼86.7 to 80.4 emu g−1, ∼17 to 28 Oe and ∼1.71 to 4.6 emu g−1 for the substitution of Co2+ content at x = 0.1, 0.2 and 0.3, respectively, at room temperature. A significantly low ''s promotes these ferrites could be suitable for antenna miniaturization in the THz (0.2–2.5 THz) region.
Acknowledgments
Authors would like to express their gratitude to Professor A Thamizhavel for SQUID VSM measurement, Tata Institute of Fundamental Research (TIFR), Colaba, Mumbai. The authors also wish to thank Mr. Suraj Singh for the XRD measurement, Department of Energy Science and Engineering, Mrs Princy Denis Varghese for the EDX analysis and Mr Ravi Poojari for his kind assistance in sample preparation, Sophisticated Analytical Instruments Facilities and Centre for Research in Nanotechnology and Science, IIT Bombay. The authors would like to thank the Department of Atomic Energy (DAE), Government of India, and TIFR Mumbai for the resources, and the work is supported by DAE Grant ID RTI4003.
Data availability statement
The data that support the findings of this study are available upon reasonable request from the authors.