
Abstract
Applying structured instead of plane illumination in widefield optical fluorescence microscopy can improve the spatial resolution beyond what is known as the Abbe limit. In general it is not only the resolution of an imaging system that is of interest but also its field of view (FOV). These two parameters are expressed in the space-bandwidth product (SBP). Here we introduce a modified structured illumination microscopy (SIM) approach that offers a larger SBP than any other available implementation. This is achieved through a transillumination geometry instead of the typical epifluorescent configuration. Compared to conventional SIM, the illumination path is decoupled from the objective lens by using a multi-mirror setup to generate the sinusoidal interference pattern for structured illumination in transmission mode. The spatial frequency of the illumination pattern can be controlled by changing the angle of the mirrors, achieving comparably fine patterns over a large FOV. In this work simulation results demonstrate the potential resolution improvement to be expected by the suggested implementation. Preliminary experimental results demonstrate phase-shifting ability and the stability of fringe frequencies over a large FOV of ( 16 mm2) at different numerical apertures, fulfilling the prerequisites for SIM acquisition.
Export citation and abstract BibTeX RIS

Original content from this work may be used under the terms of the Creative Commons Attribution 3.0 licence. Any further distribution of this work must maintain attribution to the author(s) and the title of the work, journal citation and DOI.
1. Introduction
In general the resolution of a light microscope is limited due to the wave-like nature of light and the objective's finite aperture. This is commonly known as the Abbe resolution limit and lies around half of the wavelength of the collected light [1, 2]. Different fluorescence techniques have been implemented to overcome the resolution limit [3–6] and they provide what is called super-resolution microscopy or nanoscopy. Structured illumination microscopy (SIM) [5, 7, 8] is one among those super-resolution methods, typically providing around two-fold resolution improvement to the classical limit in the widefield linear optical regime. Instead of uniform illumination as in a conventional microscope, a sinusoidal light pattern is used to illuminate the fluorescently labeled object. The acquired image then consists of a superposition of the illumination pattern and the sample structure, containing previously unobservable information through frequency mixing in the form of Moiré structures. Expressed in the Fourier domain it means that high-frequency sample information that lies outside the support region of the system's optical transfer function (OTF) is shifted into that region by structured illumination [9]. It is this down conversion of frequency components and computational unmixing and relocation of shifted components that can be used to reconstruct the image with improved resolution. Various realizations as laterally modulated excitation microscopy by Heintzmann et al [7] or SIM by Gustafsson et al [5] have been reported. Frohn et al proposed harmonic excitation light microscopy [8], a transillumination type implementation where the illumination pattern is generated using prisms (glass blocks) on the backside of the sample. Plasmonic structured illumination microscopy was introduced by Wei et al [10] where surface plasmons are utilized to generate structured excitation of fluorescent beads.
A typical epifluorescent implementation of SIM, using a single objective lens for sample illumination and imaging acting in the linear optical range has a maximum achievable resolution that is limited to approximately half the conventional resolution limit. Since the objective lens does not only limit the image resolution but also the resolution of the illumination pattern on the sample, the achievable image resolution lies around  , where
  is the wavelength of the collected light and NA is the numerical aperture of the objective lens. As conventional SIM may not be able to resolve features with a size smaller than the described resolution, the nonlinear response of fluorescent molecules to excitation at high power can be used to introduce higher harmonics in the illumination pattern and thus increase the achievable resolution [11–13]. However, photodamage introduced by the high excitation power to the biological structure as well as photobleaching of the fluorescent dyes may prohibit the application of this technique. In addition to the enhancement of the optical resolution, the SIM technique also benefits from an excellent optical sectioning property [14–16]. Optical sectioning removes out of focus blur light, enhancing the contrast and thus image quality. Already only this effect, without resolution enhancement, has been demonstrated as interesting for large specimens such as tissue samples [17, 18].
The motivation of this work is to propose a new method that is capable of acquiring images at higher resolution over large areas (cm2 scale). A low magnification objective lens, such as 10×/0.45 NA as used in [18], is desirable to use for imaging large areas at high-speed. However, low magnification/NA objective lenses reduce the achievable optical resolution of SIM. One way to avoid this limitation is to decouple the illumination light path from the imaging objective lens. The transmission geometry is the suitable method to do so. Frohn et al [8] used a prism for illumination at a similar setup and a transmission-based large FOV implementation has been recently demonstrated for periodic samples [19], but a sample independent pattern generation with comparably high spatial frequencies over a large FOV was not investigated yet.
Here we propose transillumination SIM to decouple the illumination from imaging path. A multi-mirror setup [20] generates illumination patterns with higher spatial frequencies than can be achieved using a low magnification/NA imaging objective lens. While a low magnification/NA objective lens enables imaging a large FOV, an independent multi-mirror mount enables to push the resolution limit beyond what is supported by the NA of the objective. The multi-mirror mount is placed beneath the sample stage such that two plane waves interfere at the sample plane generating closely spaced interference fringes. It is demonstrated that the proposed setup generates high-visibility and stable interference pattern over very large areas (cm2 scale). The proposed transillumination SIM setup is also shown to be capable of generating illumination patterns with different fringe periods (different spatial frequency) and thus supporting isotropic resolution enhancement by filling the Fourier space. Furthermore the capability to introduce well defined phase steps is demonstrated.
2. Transillumination SIM using mirrors
In order to decouple the illumination from the imaging objective and to improve the resolution of conventional SIM we have developed a new transillumination type configuration. Here a set of mirrors [20] is used to generate a sinusoidal interference pattern for SIM imaging.
By making use of a multi-mirror mount to direct a pair of coherent beams to interfere in the sample plane, the spatial frequency of the interference pattern will depend on the reflecting angle of the mirrors  . The half-angle of interference
  can be expressed as the illumination's numerical aperture (NA), where a larger interference angle realizes a higher NA and thus a higher pattern frequency. Especially numerical apertures larger than the NA of the objective lens are of interest as they provide a resolution improvement. Similar to Fourier ptychography [21], the Fourier space can be filled piece-wise by using different pattern orientations and different interference angles mimicking different NAs. Since the illumination pattern does not depend on the imaging objective's NA anymore, a low NA objective with a large FOV can be used.
The basic concept of high-frequency information collection over a large FOV through a low NA objective using SIM is described in figure 1. As depicted in figure 1(a), given an imaging objective with  and an excitation and emission wavelength of
  (
( ), the OTF support is limited to
  (red circle). For illumination patterns generated by interfering the excitation light under an angle of
  , and 54°, mimicking NAs of 0.39, 0.59 and 0.81, which again correspond to pattern frequencies of
  , and
, and  , all respectively indicated by NA1 (blue), NA2 (green), NA3 (magenta) are generated. Images acquired using the mentioned illumination patterns contain additional information at higher frequencies in the Fourier space in form of the shifted copies of the conventional OTF. Here only the information gain in one direction, along the y -axis and only the positive direction is shown. In figure 1(b) the acquisition of additional spectral components along three different directions d1, d2, and d3 is illustrated. These orientations are distributed in even 60° steps with an offset to present a more realistic case. The dash-dotted, the dashed and the dotted circles indicate the pattern frequencies of NA1, NA2, and NA3 respectively, colors as in figure 1(a). For each of the represented pattern orientations one set of spectral components acquired using one pattern frequency is illustrated. To fill the Fourier space isotropically, the imaging acquisition is repeated for all three pattern spacings at up to six orientations. The increase in the number of necessary images is thus the cost for the advantages of this approach.
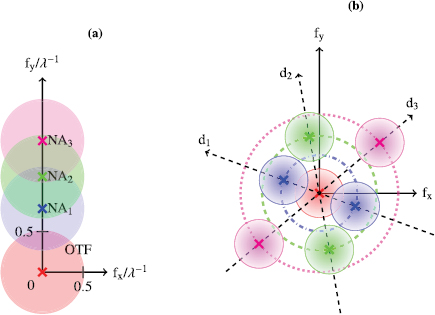
Figure 1. Illustration of the collection of high frequency information through a low NA objective in transillumination SIM. (a) Given an imaging objective with  the OTF support is limited to
  (red). For illumination patterns generated by interfering the excitation light under different angles, NA1 (blue), NA2 (green), NA3 (magenta) are generated, giving additional information at higher frequencies in the Fourier space in the form of the shifted copies of the conventional OTF. Whereas a positive and negative term are always created, here only the information gain in one direction, along the positive y -axis, is shown. (b) In order to fill the Fourier space gapless and isotropically, not only the frequency shifts have to be varied, but the process has also to be repeated for different orientations (d1, d2, and d3).
Download figure:
Standard image High-resolution image2.1. Space-bandwidth product of transmission SIM
The space bandwidth product (SBP) is a measure to characterize an imaging system, providing the total number of significant samples in the image (pixels) required to represent an image from that system [22]. It can be defined as
with  as the system's resolution, and the factor 0.5 stemming from the Nyquist–Shannon sampling theorem. For a conventional widefield epifluorescent system, the maximum achievable resolution is

SIM achieves a resolution improvement corresponding to a shift of the OTF in the frequency space as illustrated in figure 1. In conventional SIM, where this shift is limited by the resolution of the generated illumination pattern, and the NA is the same for illumination and collection, theoretically the resolution  is half of
  . Considering a constant FOV in the imaging process and the fact that
  this yields

The spatial frequency of an illumination pattern generated by a conventional imaging objective lens is limited by the objective's NA. For imaging a large FOV it is desirable to use a low magnification and low NA objective lens, e.g. 10 0.25 NA, rather than using high-magnification and high NA, e.g. 60-100× 1.4 NA. In the proposed transmission setup as outlined later in section 3.2, we have experimentally obtained illumination fringes with an effective NA of 0.8 over centimetre scale. Thus, when comparing this with an imaging objective lens of 10× 0.25 NA the proposed set-up allows generation of an illumination pattern with spatial frequencies three times higher than this imaging objective lens (10×, 0.25 NA) In such a case, the shift of the OTF and thus the reach towards higher spatial frequencies will be three times as large as well. The final support in the Fourier domain is given by how far the OTF is shifted and its size. Thus shifting the OTF e.g. three times in one direction by its radius (size) will reach to four times its original extent (once for each shift plus once for its size). For this example, the SBP yields:

Thus the SBP can be increased to four times as compared to a conventional SIM approach if the generated illumination pattern corresponds to three times the NA of the imaging objective. This is 16 times the SBP of conventional wide-field imaging. Both the resolution ( ) and the SBP of the proposed transmission SIM are functions of the imaging objective lens' NA and the highest interference angle (equivalent to the highest NA of the illumination side) formed at the sample stage. Thus, for a given experimental setup, i.e. fixed
  and imaging objective lens, the proposed transmission SIM approach supports scalable resolution and SBP simply by altering the interference angles of the multi-mirror setup. However, when it comes to amount of information required to fill the space in the Fourier domain, the larger the shift in the OTF the more orientations will be necessary, as indicated in figure 1. The increase in SBP or resolution can thus be seen as a trade-off with the additional number of necessary images.
3. Experimental methods and results
In this section we expose the experimental results that endorse our transmission-based SIM approach. In the first two sections we demonstrate the capability of the mirror mounts to generate uniform high frequency illumination patterns over a large FOV. In the third part we show the controlled shifting of phase necessary for the SIM method.
3.1. Experimental setup
A schematic of the proposed experimental setup is presented in figure 2. It consists of a diode-pumped solid-state laser source (BlueMode, TOPTICA photonics, Germany) emitting at a vacuum wavelength of 405 nm. The spatially filtered/cleaned beam is collimated and widened using a telescope. A region with an approximately flat beam profile is selected with a diaphragm and subsequently projected onto a reflective phase only spatial light modulator (Holoeye LETO). The light is divided into the zeroth and two first diffraction orders by a grating pattern displayed on the spatial light modulator (SLM). Figure 2(a) displays how the zeroth order beam is blocked, while the two 1st order beams are reflected at the mirror mounts crossing at the sample plane. By rotating the pattern on the SLM, each pair of opposing mirrors can generate a sinusoidal illumination pattern according to their orientation. The period of the interference pattern  depends on the wavelength and angle of mirror pair analogue to the resolution:
  , with
  . By changing the angle of mirrors
  the period can be manipulated. Here three angles of interference corresponding to three different numerical apertures (NA1, NA2, and NA3) are proposed and studied. Further, by introducing a phase shift to the pattern on the SLM the sinusoidal interference pattern obtains a phase shift (lateral shift) as well. This way the illumination pattern's orientation, periodicity, and phase are controlled.

Figure 2. Illustration of transmission type SIM setup. (a) First, the laser beam is expanded using a telescope. Subsequently, a diaphragm is used to select an approximately flat beam profile for a homogeneous intensity over the large illumination area. The light is then directed onto a spatial light modulator (SLM). A grating profile on the SLM is used to split the illumination into different diffraction orders. The two first diffraction orders are guided to the mirror mount while the central beam is blocked. The mirrors on the mount lead the pair of beams to interfere in the sample plane. Different mirror angles  provide interfering beams at angles
  , mimicking different numerical apertures (NA1, NA2, and NA3), and generating interference patterns with varied frequencies. The objective captures the fluorescent response to image the sample in the microscope. (b) Design of a mirror mount. Different mirrors around the mount provide the rotated orientation patterns necessary for SIM.
Download figure:
Standard image High-resolution image3.2. Patterns in photoresist
To study the illumination pattern achieved with the presented system, interference patterns are generated and recorded photolithographically so that they can be characterized in a scanning electron microscope (SEM). A glass substrate is spin-coated with a layer of about 1  m photoresist (AZ 1505, Microchemicals) and placed at the sample plane, where the interference pattern generated by the mirror mount is inscribed. The diameter where the interference fringes are formed and thus ultimately the FOV of this approach can be increased by adjusting the beam diameter. Three different mirror angles, 23°, 36° and 54°, corresponding to NA1 = 0.39, NA2 = 0.59, NA3 = 0.8, respectively, are utilised for different samples. By rotating the beam, three pattern orientations are also inscribed at different photoresist samples. After laser exposure, the pattern is developed and analyzed under an SEM. The diameter of over 4 mm where the sinusoidal pattern was generated is seen in figure 3(a). Figures 3(b)–(d) display zoomed in sections from the upper left corner, the central region and the lower right corner of figure 3(a) respectively, suggesting a homogeneous pattern. The Fourier spectrum of SEM images as in figures 3(b)–(d) is utilized to determine the pattern period. In figure 4(a), the exemplary Fourier spectrum of such a SEM image is shown. The delta peaks closest to the DC peak in the center stem from the sinusoidal pattern, with their distance to the DC peak indicating the grating period. This analysis rendered values of 510, 330 and 250 nm for NA1 to NA3, respectively. Figure 4(b) depicts the results for different NAs and orientations at different regions of the samples. The results show homogeneity of the pattern with minor variations which may be attributed to the photoresist coating. These variations are likely the cause for the higher order peaks seen at figure 4(a). Despite providing a limited comparison with no quantitative information to the visibility of fluorescent fringes, since the exposure time in the photolithographic application is fairly large compared to fluorescence imaging (several seconds versus 10–100 s of milliseconds), the sharpness of the patterns in the photoresist suggests a high temporal stability of the fringes. Further, the sinusoidal pattern is demonstrated without paying attention to polarization. For optimization of the modulation depth, the polarization of a beam could be controlled by, e.g. a waveplate and a Pockels cell [23]. An alternative would be to provide elliptical polarization, which would ensure 50% modulation depth [24].

Figure 3. SEM images of photoresist patterned with the transmission type setup. (a) Low magnification image shows exposed area of over 4 mm, with (b)–(d) being higher magnified regions approximately indicated in (a). The images suggest a homogeneous structured pattern over the exposed region.
Download figure:
Standard image High-resolution image
Figure 4. SEM images of photoresist samples taken at different regions with different NAs and orientations are used to determine pattern uniformity through Fourier analysis. (a) Fourier transform of examplifying SEM image as in figures 3(b)–(d). The peaks closest to the DC component are localized and the frequency is determined. (b) shows these results demonstrating the uniformity of the pattern period. Variations may be attributed to photoresist and not illumination-related effects.
Download figure:
Standard image High-resolution image3.3. Phase shift
Phase shifting of the structured illumination is necessary for the targeted SIM implementation, in order to gather complete information of the sample area. The ability to maintain a stable phase is demonstrated by the fact that the pattern can actually be recorded in photoresist. Since repeated imaging using a shifted pattern is required, the control over the phase shift using the SLM is characterized. For this purpose an interference pattern is generated a low NA and directly projected on a CMOS camera. By introducing phase shift on the SLM, an equivalent phase shift of the pattern on the camera is achieved as presented in figure 5. In figure 5, four phase steps and the intensity profiles are shown, demonstrating the capability of phase control over the extent of the modulation frequency.

Figure 5. Demonstration of phase control at the transmission setup. (A)–(D): Low NA interference directly projected onto a camera and shifted in  phase steps introduced by the SLM. The plot displays line profiles of these images.
Download figure:
Standard image High-resolution image4. Simulating the imaging performance
In this section the imaging performance of a SIM setup of the proposed type is assessed by reconstructing simulated raw data. First, the theoretical background of SIM as it is used in the presented work is explained. In the second part, the expected results of SIM using different parameters are shown.
4.1. Theoretical formulation of the imaging process
Following the notation of Wicker et al [25, 26], the image formation in two-dimensional widefield fluorescence microscopy using a sinusoidal illumination pattern can be formulated as

The acquired image D is the dye distribution of the fluorescence labeled sample S multiplied with the illumination intensity I and convolved ( ) with the microscopes point spread function or PSF (h);
  refers to the spatial coordinate. In Fourier space this expression becomes

Tilde (∼) indicates the Fourier transform, and  is the Fourier space coordinate or spatial frequency. The extend of the optical transfer function (OTF)
  is limited to a cutoff frequency
  . This is a basic property of the imaging objective and results in a limited resolution in the image. If the fluorescence in the sample is excited using a sinusoidal illumination pattern
with a modulation depth am, a wave vector  and a phase
  , the Fourier transform of an acquired image can be written as
The Fourier transforms of the acquired images  contain bands
  that are shifted by
  with respect to their original position in Fourier space before they are multiplied with the OTF. This way frequency components of the sample that actually lie outside the OTF support are now transmitted into image space. Taking N images of the sample with different phases
  with
with  , the resulting Fourier transforms of the images
  can be written as

with the acquired images in the vector ![$\tilde{\mathbf{D}} = [\tilde{D}_{1}, \cdots, \tilde{D}_{N}]^\intercal$](https://content.cld.iop.org/journals/0022-3727/53/4/044006/revision1/dab4e68ieqn043.gif) , the matrix
, the matrix  and a vector
 ![$\tilde{\mathbf{C}}(\mathbf{k}) = [\tilde{C}_{-1}, \tilde{C}_0, \tilde{C}_+1]^\intercal$](https://content.cld.iop.org/journals/0022-3727/53/4/044006/revision1/dab4e68ieqn045.gif) . If the inverse of
. If the inverse of  (
( ) exists, the different components can be separated by

The final image is the inverse Fourier transform of  , the final estimate in the Fourier domain. It is obtained by shifting each band to its original position and recombining them using a generalized Wiener filter
The Wiener filter reduces the degrading influence of the OTF and weights the bands in regions where they overlap according to their expected SNR. The Wiener parameter w is determined empirically,  is an apodization function decreasing linearly from unity at the center to zero near the end of the extended OTF support, shaping the overall spectrum in order to prevent ringing artifacts in the final image, and the asterisk (
 ) indicates the complex conjugate. Since the resolution improvement only takes place in the direction of
  , the process of image acquisition and band separation is repeated for different orientations d to obtain isotropic resolution enhancement.
4.2. Simulations
For the presented simulations, an imaging objective with a numerical aperture of  is assumed. The excitation and emission wavelength is set to be equal
  px in the sample space. In figure 6(a), the sample (Siemens star) for the simulations is introduced. Figure 6(b) shows a simulation of the widefield deconvolution and figure 6(c) shows the corresponding Fourier spectrum. The simulated result for plain illumination is generated in the same way as results for structured illumination, just with an interference angle of
  generating plane illumination. For the simulation of the raw data for SIM, three interference angles of 23°, 36° and 54° (referred to as NA1, NA2, and NA3) for the generation of the illumination pattern can be used. These interference angles determine the fringe spacing of the sinusoidal illumination pattern. For the orientations, three or six evenly distributed angles with a random overall offset are used. For each direction, a set of three evenly distributed phases, also with a random overall offset, is generated. The raw data images are then simulated according to equations (5) and (7) using a modulation depth of am = 1. The PSF is simulated using a 2D distribution based on the Bessel function of first kind and first order [27]. The reconstruction results as presented in figures 7–9 show the resolution improvement that is to be expected in comparison to figure 6.
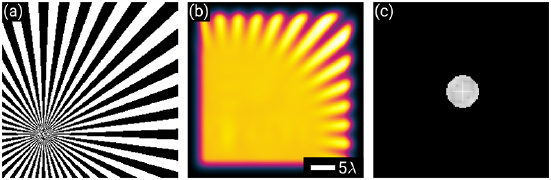
Figure 6. The Siemens star sample (a) of size  px. In (b) the widefield image as obtained with an
  objective at a wavelength of
  px, after deconvolution is simulated. In (c) the Fourier spectrum of (b) is shown. For best possible contrast the color map 'Morgenstemning' [28] is used to represent the intensity here and in the following figures.
Download figure:
Standard image High-resolution image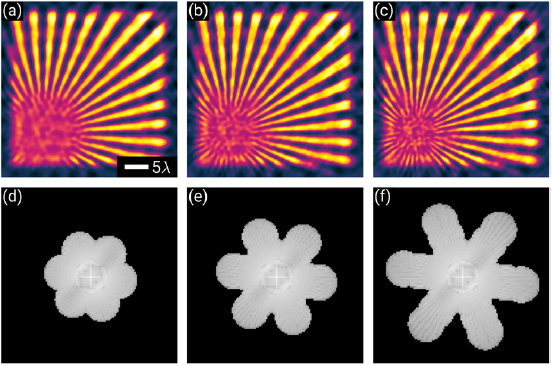
Figure 7. If the Fourier space is filled successively but only three pattern orientations are used, the Fourier space is not filled isotropically anymore. In (a) and the corresponding Fourier spectrum (d) the reconstruction is done with simulated data using illumination patterns generated with NA1. This way three pattern orientations with three phase steps each equals nine raw data images are required. In (b) and (e) the raw data set is simulated with NA1 and NA2. An additional set of nine raw data images, 18 in total, are required. In (c) and (f) all three suggested NAs NA1, NA2 and NA3 are used. A third set of raw data images, in total 27 images, are needed.
Download figure:
Standard image High-resolution image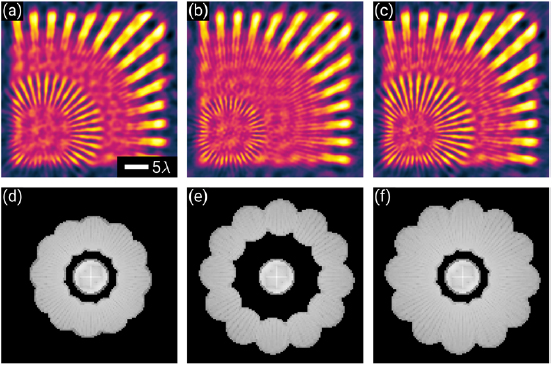
Figure 8. This figure illustrates what happens if the Fourier space is not filled successively. (a), (d) The image reconstruction based on raw data simulated with patterns of NA2 only. Since images of six pattern orientations with each three phase steps are required, a total of 18 raw data images is required for the proposed reconstruction. (b), (e) The raw data is simulated using NA3 only, requiring 18 raw data images as well. (c), (f) A reconstruction based on raw data using NA2 and NA3. This way twice as many raw data images (36) are needed.
Download figure:
Standard image High-resolution image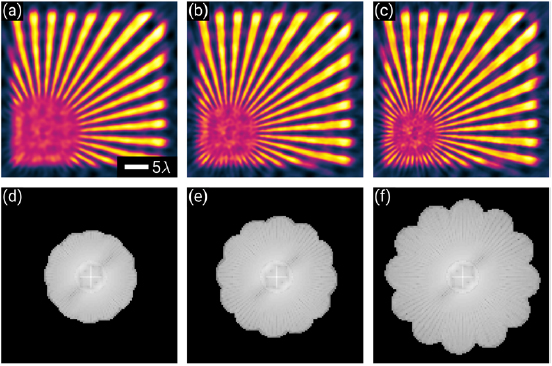
Figure 9. Simulated SIM reconstruction using six orientations. In (a) and the corresponding Fourier spectrum (d) the reconstruction is done with simulated data using illumination patterns generated with NA1. This way six orientations times three phase shifts equals 18 images are needed. (b), (e) The raw data set is simulated with NA1 and NA2. An additional set of 18 images, 36 images in total, is needed. (c), (f) All three suggested NAs NA1, NA2 and NA3 are used. Here three sets of 18 images, 54 raw data images, are used.
Download figure:
Standard image High-resolution image
Different NAs and orientations for the illumination pattern result in different pattern frequencies and wave vectors  in the description above. Since the data is acquired consecutively, the different frequency components can be separated one at a time and joined as described in equation (11) with additional terms d in the sum. In order to generate raw data for the reconstructions in figures 8(a) and (b), simulated data only based on NA2 is used. In figures 8(c) and (d) only NA3 and in figures 8(e) and (f) only NA2 and NA3 are used. This leaves a gap between the low and the high frequency components. This gap results in artifacts in the reconstruction and is clearly visible in the figure. Furthermore, figure 7 shows the reconstructions using only three pattern orientations instead of six in order to create the raw data. This leads to an anisotropic filling of the Fourier space of the reconstruction. Figure 9 shows the expected reconstruction results using only NA1 (figures 9(a) and (b)), NA1 and NA2 (figures 9(c) and (d)) and finally NA1, NA2, and NA3 (figures 9(e) and (f)). The Fourier space of the images is expanded successively and the resolution improves accordingly. There are no gaps in the Fourier space, neither is the Fourier space filled anisotropically.
5. Conclusion and summary
A mirror based transillumination SIM setup is proposed that increases the SBP by maintaining a large FOV while illuminating the sample with a sinusoidal illumination with comparably high spatial frequency. The generation of stable fringe illumination over a large FOV is experimentally demonstrated and the ability for precise phase shifts is shown. The unique characteristic of the presented implementation is not only to decouple the pattern generation from the imaging path, but also the exploitation of the ability to generate uniform interference patterns over a centimeter sized FOV. Simulation work shows the possible resolution enhancement in SIM imaging of fluorescent labeled samples using three different illumination NAs. The approach is flexible towards larger or smaller differences between illumination angles. Larger illumination NAs could be used towards higher resolution or SBP, coming however at the cost of more images and possibly less optical sectioning. This is not a constraint when the sample is thin, e.g. pathologically relevant cryo-tissue sections which are usually few hundred nanometers thick. This technique is expected to be useful for applications in biomedical fields such as pathology, hematology, immunohistochemistry and neuroanatomy, where it is strongly necessary to image large numbers of histology slides for analysis.
The illumination path of the transillumination setup is similar to conventional SIM, but the collection light path is different. Here, the flurorescence light is collected by an upright microscope, which could be adversely affected by the aberration from the mounting media and especially for thick samples. This would be a lesser problem for thin samples, e.g cryo-tissue sections as outlined above. Finally, if the illumination of a fluorescent sample still turns out to be more challenging to control or estimate, SIM reconstruction algorithms such as blind-SIM are able to perform without ideal and pre-determined fringe patterns [27, 29].
In future work, the proposed mirror based transillumination SIM setup will be employed for high-resolution imaging of pathological tissue samples [30]. 3D SIM can also be pursued by making use of the zeroth order diffracted beam [31].
Funding and acknowledgments
BSA acknowledges the funding from the European Research Council, (project number 336716) and Norwegian Centre for International Cooperation in Education, SIU-Norway (project number INCP-2014/10024). JJ acknowledges University Grant Commission (UGC) India for joint funding.
Disclosures
All authors have jointly applied for a patent application to protect the invention related to the transmission SIM.