

Abstract
In order to enhance the applicability and functionality of DNA-based complexes, we introduced hydroxyl (–OH) group-modified multi-walled carbon nanotubes (MWCNT–OH), which can aid the dispersion and adsorption in the DNA template. Herein, we fabricated MWCNT–OH-combined DNA and cetyltrimethyl-ammonium chloride-modified DNA (DNA-CTMA) layers using the solution-processed method. The distinct chemical and physical characteristics of the MWCNT–OH-combined DNA and DNA-CTMA layers were examined through various characterisation techniques. For instance, the elemental and surface characteristics were analysed by energy-dispersive x-ray spectroscopy, field emission scanning electron microscopy, and atomic force microscopy. The charge transfer was examined by x-ray photoelectron spectroscopy. In the x-ray photoelectron spectra, a negative peak shift was observed, indirectly indicating that the charge transfer from MWCNT‒OH to DNA occurred. The vibrational and rotational modes were analysed by Raman spectroscopy, and the characteristic functional group and molecular interaction were examined using Fourier transform infrared spectroscopy. As expected, we observed four major characteristic Raman bands of MWCNT–OH in the DNA and DNA-CTMA layers which corresponded to the D-, G-, and G'-bands as well as the strain-induced band. Finally, the light absorption, photoluminescence, and electrical characteristics were examined using UV–vis–NIR spectroscopy, a photoluminescence mapper, and a probe station, respectively. The absorption in the full spectral range, photoluminescence quenching, and current enhancement of DNA and DNA-CTMA layers combined with MWCNT–OH were influenced by the electrostatic and van der Waals interactions between MWCNT–OH and DNA (DNA-CTMA). Our results will provide a simple protocol for constructing composite layers made of organic and inorganic materials which show novel characteristics with easy controllability.
Export citation and abstract BibTeX RIS
1. Introduction
Recently, researchers have begun to recognise the advantages of combining biomaterials (e.g. nucleic acid, lipid, and protein) with nanomaterials (such as ions, nano particles, dyes, and carbon-based materials) to enhance and control physical, chemical, and biological properties [1–9]. Among the various biomaterials, DNA molecules have been shown to provide the most stable and sequence programmable platform with well-established various chemical modifications on strands. DNA, which is a naturally available polymer (for instance, it can be extracted from salmon by the enzyme isolation procedure), has attracted substantial attention due to its accessibility, biocompatibility, adaptability, scaffolding capability, and applicability in physical and biological sciences [10–12]. We introduced DNA dissolved in water and cetyltrimethyl-ammonium chloride-modified DNA (DNA-CTMA) in organic solvents and observed the solvent dependency of measured physical quantities for usage in organic and inorganic based device and sensors applications. Notably, intrinsic DNA and DNA-CTMA characteristics, such as being close to the insulator, poor absorption in the visible region, and high dielectric constant, have inspired researchers to consider DNA as one of the promising candidates to be used in nanotechnology and bio-nanotechnology [13–15].
Over the last few decades, multi-walled carbon nanotubes (MWCNTs) have attracted great interest due to their intrinsic characteristics, such as high electrical and thermal conductivities, mechanical strength, and light-emitting capability. These properties have allowed CNTs to be used in various applications, including conductive coatings, fabrics, energy storage, catalysis, bio-imaging, and cell culture [16–20]. However, the inherent hydrophobic nature of MWCNTs (they are hard to disperse in aqueous solution) hinders any potential applications involved with water. In order to overcome this dispersion problem, a hydroxyl group (–OH) attached by the surface modification of MWCNTs has been adopted [21, 22]. The hydroxyl group-modified MWCNT (named MWCNT–OH) provided the additional characteristics of –OH in MWCNTs. The elevated properties and designated applications of MWCNT–OH greatly motivated us to conduct a systematic investigation on the development of new composite structures made of MWCNT–OH and DNA (DNA-CTMA). Although individual properties of DNA, DNA-CTMA, as well as MWCNT-OH are well established, novel characteristics of a MWCNT–OH-combined DNA layer (i.e. DNA+MWCNT–OH) and a MWCNT–OH-combined DNA-CTMA layer (DNA-CTMA+MWCNT–OH) caused by interactions between DNA (DNA-CTMA) and MWCNT–OH are rarely discussed. The layer complexes might be useful in construction of self-assembled nanotube field-effect transistors, stabilization of colloidal nanoparticles, chemical and biological sensing, and telecommunication (owing to their large absorption range) [23–33]. Thus, we have focused on developing 2D DNA+MWCNT–OH and DNA-CTMA+MWCNT–OH layers.
Given the growing importance of the combined MWCNT–OH and DNA (DNA-CTMA) complexes, facile fabrication methods of DNA+MWCNT–OH and DNA-CTMA+MWCNT–OH with appropriate ingredient concentrations and systematic evaluations of their chemical and physical characterisations are critical. In this paper, we report on the design and development of 2D DNA+MWCNT–OH and DNA-CTMA+MWCNT–OH layers and explore their complex properties, such as composition, morphology, and chemical, optical, and electrical characteristics by controlling the concentration of MWCNT–OH ([MWCNT–OH]). Experiments with field emission scanning electron microscopy (FESEM) attached with energy dispersive x-ray spectroscopy (EDS) as well as atomic force microscopy (AFM) were performed in order to analyse the elemental composition and morphological characteristics of the samples. X-ray photoelectron spectroscopy (XPS), Raman spectroscopy, and Fourier transform infrared (FTIR) spectroscopy were used to study the spin states, vibration/rotation modes, and interactions of DNA+MWCNT–OH (DNA-CTMA+MWCNT–OH), respectively. Finally, UV–vis–NIR spectroscopy, a photoluminescence (PL) mapper, and a probe station were used to analyse the optical absorption, PL emission, and electrical measurements, respectively.
2. Experimental section
2.1. Materials and methods
We prepare the MWCNT–OH (Cat. #: 0552CA-OH, Skyspring Nanomaterials, Inc., Houston, USA) stock solution with 1 wt% in both de-ionised (DI) water and 1-butanol. In order to prepare the homogenous solutions of DNA (GEM Corporation, Shiga, Japan) and DNA-CTMA (which can be prepared by the ion-exchange process) with different concentrations of MWCNT–OH (0, 0.05, 0.10, 0.15, 0.20, and 0.30 wt%), 0.05 g of DNA (DNA-CTMA) fibers are dissolved in 5 ml of DI water (1-butanol), followed by magnetic stirring. Next, 20 µl of the MWCNT–OH-combined DNA and DNA-CTMA solutions are solution-processed (=drop-casted) on the O2 plasma-cleaned substrates (glass for EDS, FESEM, AFM, XPS, current measurements and fused silica for Raman, FTIR, absorption, PL measurements), followed by drying at room temperature for 24 h.
2.2. EDS, FESEM, and AFM measurements
EDS-attached FESEM (JSM–7600F, JEOL Inc., Tokyo, Japan) and Multimode Nanoscope (Veeco Inc., CA, USA) in an air intermittent contact mode are used to examine the compositions and surface features of the MWCNT–OH-combined DNA layers.
2.3. XPS measurement
XPS (ESCALAB 250Xi, Thermo Scientific, Winsford, UK) is conducted to analyse the spin states, composition, and functional groups associated with the binding energies of the MWCNT–OH-combined DNA and DNA-CTMA layers. The XPS spectrum is acquired in the binding energies between 0 and 1200 eV using an excitation Al Kα x-ray source with a radiation energy of 1486.6 eV.
2.4. Raman, FTIR, UV–vis–NIR, and PL spectroscope measurements
A confocal Raman microscope (Alpha 300 R, WITec, Ulm, Germany) with a laser wavelength of 532 nm, an FTIR spectrometer (TENSOR 27 FTIR spectrometer, Bruker Inc., MA, USA) with a detector MIR_ATR (ZnSe), a UV–vis–NIR spectrophotometer (Cary 5G, Varian, CA, USA), and a PL mapper (Accent RPM2000, Nanometrics, CA, USA) with a laser excitation wavelength of 266 nm are used to study the Raman modes, functional groups, light absorption, and PL characteristics of the MWCNT–OH-combined DNA and DNA-CTMA layers, respectively.
2.5. Electrical measurement
Semiconductor parameter analyser connected with a 2-terminal probe station (4200–SCS, Keithley Instruments Inc., CA, USA) is used to measure the electrical transport properties of the MWCNT–OH-combined DNA and DNA-CTMA layers with an applied potential range between 0 and 5 V in dark at room temperature.
3. Results and discussion
The simplified illustrative structures of DNA, DNA-CTMA, and MWCNT–OH, as well as the fabrication method of the MWCNT–OH-combined DNA layers (DNA+MWCNT–OH) and DNA-CTMA layers (DNA-CTMA+MWCNT–OH) are shown in figure 1(a). Appropriate quantities of MWCNT–OH at a fixed [DNA] ([DNA-CTMA]) were suspended in DI water (1-butanol) followed by stirring to obtain a homogeneous mixture of DNA (DNA-CTMA) and MWCNT–OH. The homogeneous solution photographs of pristine DNA (highly transparent) and DNA combined with MWCNT–OH (well-distributed throughout the solution without aggregation by the hydrophilic propensity of –OH) are also displayed. In order to prepare the MWCNT–OH-combined DNA and DNA-CTMA layers, 20 µl of the sample solution was dropped on an O2 plasma treated substrate. The final thickness of each layer was about 2 µm.
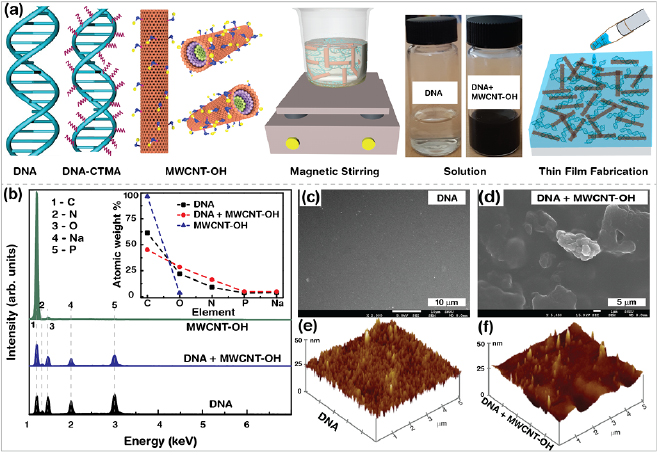
Figure 1. Schematic diagrams of sample preparation, elemental, and morphological characteristics of hydroxyl group-modified MWCNT (MWCNT-OH) combined DNA and DNA-CTMA layers. (a) Simplified representations of DNA, DNA-CTMA, hydroxyl group-modified MWCNT (MWCNT–OH), preparation of sample solution, and fabrication of layers made of them. (b) EDS spectra and elemental analysis (inset) of DNA, DNA layers combined with MWCNT–OH, and MWCNT–OH powder. (c)–(f) Typical FESEM and AFM images of DNA and MWCNT–OH-combined DNA layers.
Download figure:
Standard image High-resolution imageThe EDS spectra and elemental analyses of the DNA layers without and with MWCNT–OH (0.3 wt%) and pristine MWCNT–OH powder are shown in figure 1(b). EDS was used to evaluate the compositions of the samples such as pristine MWCNT–OH (i.e. C and O) and DNA (C, N, O, Na, and P) without and with MWCNT–OH. The EDS spectra of the samples revealed sharp peaks around 0.26 (for C), 0.38 (N), 0.52 (O), 1.04 (Na), and 2.02 keV (P). As expected, all of the samples exhibited C and O as the main elements. The inset in figure 1(b) displays the atomic weights (in %), which reflect the relative amounts of the major elements in each sample. In order to check the roughness values of the surface morphologies of the DNA layers without and with MWCNT–OH, we performed SEM (figures 1(c) and (d)) and AFM (figures 1(e) and (f)) measurements. Although we observed morphological differences using SEM images, the average root mean square displacements of DNA (3.9 nm) and DNA+MWCNT–OH (4.0 nm) analysed through AFM images did not show substantial differences.
We elucidated how the embedding of MWCNT–OH in DNA layers manipulates the chemical features. Figure 2 shows the spin orbital states (e.g. P 2p and C 1s) and functional groups (e.g. C–H/C–C, N–C=N/C–O/C–N, N–C=O, and N–C–O/N–C=N) in the DNA, DNA-CTMA, and DNA+MWCNT–OH layers, as well as in MWCNT–OH powder as measured by the XPS. The full-scan XPS survey spectra as a function of binding energy (BE) are displayed in figure 2(a). The survey spectrum of a DNA layer (DNA+MWCNT–OH) revealed the spin orbital states of C 1s, O 1s, N 1s, P 2p, and Na 1s at BE of 284.8, 532.1, 399.2, 133.3, and 1071.2 eV (284.8, 530.9, 398.5, 131.7, and 1069.5 eV) [34–38]. A DNA-CTMA layer (MWCNT–OH powder) showed the spin orbital states of C 1s, O 1s, N 1s, and P 2p (C 1s and O 1s) at BE of 284.8, 532.2, 402.4, and 132.7 eV (284.8 and 533.1 eV), respectively. The strong (which corresponded to C 1s) and weak (which corresponded to O 1s) peaks in MWCNT–OH powder indicated relatively larger and smaller amounts of C and O, respectively, which were consistent with the results of EDS analysis.
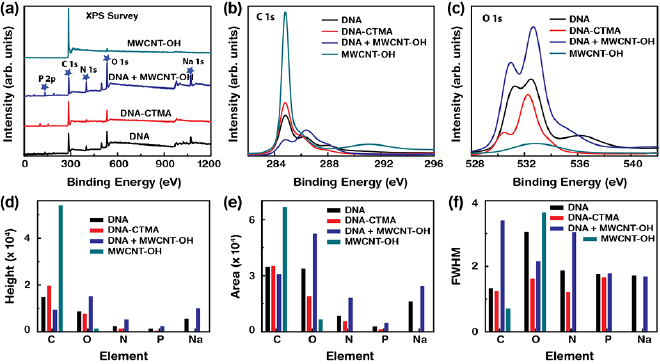
Figure 2. XPS survey, high-resolution XPS spectra, and analysis of the MWCNT–OH-combined DNA and DNA-CTMA layers. (a) XPS survey spectra of the DNA, DNA-CTMA, and DNA layers combined with MWCNT–OH, and MWCNT–OH powder. (b) and (c) XPS high-resolution spectra of the C 1s and O 1s regions of the DNA combined with MWCNT–OH. (d)–(f) Variations in peak height, area, and FWHM of the core elements in the layers.
Download figure:
Standard image High-resolution imageThe high-resolution XPS spectra of the characteristic C 1s and O 1s spin orbital states are depicted in figures 2(b) and (c). The spin orbital state of C 1s in DNA was deconvoluted into four peaks placed at BEs of 284.8, 286.3, 288.0, and 290.0 eV, which corresponded to C–H/C–C, N–C=N/C–O/C–N, N–C=O, and N–C–O/N–C=N, respectively. The peaks of DNA-CTMA showed the functional groups of C–H/C–C, N–C=N/C–O/C–N, and N–C–O/N–C=O at BEs of 284.8, 286.0, and 287.8 eV, respectively. The peaks of MWCNT–OH powder at BEs of 284.8, 285.6, and 291.1 eV were associated with the chemical configurations of sp2, C–O, and π–π*, respectively. Finally, the peaks produced by the DNA+MWCNT–OH layer showed the chemical groups of sp2, C=C/C–C, and C=N/C–N/C–O at BEs of 283.2, 284.7, and 286.3 eV, respectively (figure 2(b)). Similarly, the spin orbital state of O 1s in a DNA layer was deconvoluted into three peaks at BEs of 531.1, 532.6, and 536.2 eV which were associated with P=O/C–O–C/C=O, C=O/P=O, and P–O, respectively. The orbital peaks of the DNA-CTMA layer showed the functional groups of C–O–C, P=O/C=O, and C–O–C/C–O–P at BEs of 530.4, 532.3, and 533.7 eV, respectively. The peaks in the MWCNT–OH powder showed the functional groups of –OH and C–O–C at BEs of 531.8 and 533.4 eV, respectively. The orbital peaks of the DNA+MWCNT–OH layer were obtained at 529.3, 531.1, and 533.1 eV, which were associated with –OH, C=O/P=O, and C–C–P/C–C–C, respectively (figure 2(c)).
We observed suppressed C 1s (placed at BEs of 288.0 and 291.0 eV) and O 1s (536.2 eV) orbital peaks in DNA+MWCNT–OH as compared to the pristine DNA, which were attributed to the presences of the MWCNT and –OH group in MWCNT, respectively. Consequently, the distribution of peaks (which corresponded to specific functional groups) in a given element varied with the compositions of the samples. In addition, negative peak shifts were observed due to the accumulation of MWCNT–OH in DNA. This indirectly indicated the charge transfer from MWCNT–OH to DNA. Figures 2(d)–(f) show the variations in the peak height, area, and full width at half maximum (FWHM) with the existing elements in the measured samples. As expected, the peak height, area, and FWHM of the spectral characteristics of DNA+MWCNT–OH were most enhanced as compared to pristine DNA and DNA-CTMA.
Raman spectroscopy was used to measure the wavelength and intensity of Raman scattering of radiation from the sample. The difference between the incident and scattered light frequencies corresponded to the either vibrational or rotational energies of the sample. The change in the polarisability of the sample was responsible for the transition of energy. The Raman spectra of the DNA and DNA-CTMA layers combined with various [MWCNT–OH] are shown in figure 3. The Raman peaks with assigned corresponding vibrational or stretching modes have been discussed previously [39–41]. The Raman spectrum of DNA was divided into four regions i.e. nucleobases in 400–800 cm−1 and 1200–2000 cm−1, sugar and phosphate backbone groups in 800–1200 cm−1, and hydroxyl groups in 2100–3200 cm−1. The DNA-CTMA Raman spectrum showed additional Raman bands at 1290, 1430, 2890, 2935, and 3040 cm–1, which served as evidence for CTMA modification into DNA molecules.
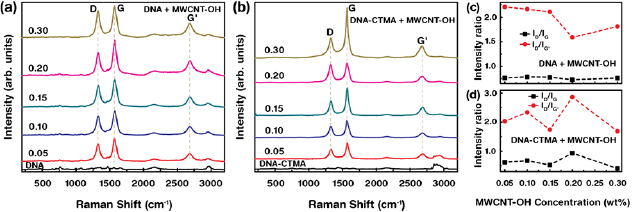
Figure 3. Raman spectra and analyses of the MWCNT–OH-combined DNA and DNA-CTMA layers. (a) and (b) Raman spectra of the DNA and DNA-CTMA layers combined with distinct [MWCNT–OH] (i.e. 0, 0.05, 0.1, 0.15, 0.2, and 0.3 wt%). (c) and (d) Variations in characteristic D-band to G-band and D-band to G'-band intensity ratios with various [MWCNT–OH].
Download figure:
Standard image High-resolution imageWe observed the four major characteristic Raman bands of MWCNT–OH in the DNA (DNA-CTMA) layers at 1327, 1465, 1574, and 2682 cm−1, which corresponded to the sp3 carbon (D-band), strain-induced band, sp2 carbon (G-band), and graphitic sp2 (G'-band), respectively [42]. With increasing [MWCNT–OH], the characteristic bands of MWCNT–OH in DNA (DNA-CTMA) were significantly enhanced. Because of the relatively larger characteristic band intensities of MWCNT–OH, DNA (DNA-CTMA) bands were hardly identified. The G-band exhibited a higher peak intensity than the D- and G'-bands in all Raman spectra. The intensities of the D-band (related to the defect of MWCNT‒OH) with respect to the G-band (i.e. ID/IG) and D-band to G'-band (ID/IG') indicated the degree of MWCNT‒OH purity, as shown in figures 3(c) and (d). We noted that the numerical values of ID/IG for DNA showed less fluctuation (roughly independent) with [MWCNT–OH] than with DNA-CTMA. This indicated that MWCNT–OH in DNA was relatively stable (with less defects) than in DNA-CTMA.
The FTIR spectroscopy was conducted for MWCNT–OH-combined DNA and DNA-CTMA layers in order to demonstrate the chemical interaction in molecules. The FTIR–attenuated reflection spectra of comparative DNA and DNA-CTMA as well as DNA layers combined with various [MWCNT–OH] are shown in figure 4. The absorbance bands at around 3360, 1700, 1653, 1603, 1488, 1420, 1370, 1220, 1082, 1050, 1015, 963, 835, and 780 cm−1 indicated the typical DNA characteristic bands and band assignments as they were previously reported [43, 44]. The DNA-CTMA layer showed additional absorbance bands at 2850 and 2920 cm−1, revealing that cationic surfactant (CTMA) was properly functionalised on DNA duplexes. The FTIR spectra of the DNA+MWCNT–OH layers showed suppression in their absorbance bands with increasing [MWCNT–OH]. A slight peak shift in their characteristic absorbance bands with varying [MWCNT–OH] was also observed, which was attributed to the interaction between DNA and MWCNT–OH. It was difficult to differentiate the absorbance bands of MWCNT–OH due to the overlapping chemical bonds of MWCNT–OH with DNA at particular wavenumbers, e.g. 1130, 1700, and 3340 cm−1 for the C–O, C=O, and OH bond stretching modes, respectively.
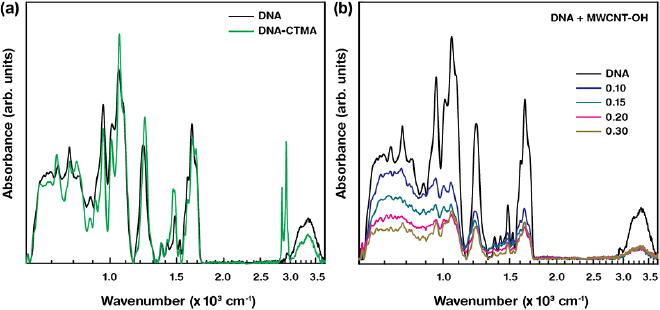
Figure 4. Comparative FTIR spectra of the DNA and DNA-CTMA, and MWCNT–OH-combined DNA layers. (a) Illustrative FTIR graphs of the pristine DNA and DNA-CTMA layers. (b) FTIR graphs of DNA layers combined with distinct [MWCNT–OH].
Download figure:
Standard image High-resolution imageThe absorption of the DNA (DNA-CTMA) layers combined with various [MWCNT–OH] in the spectral wavelength range of 190–2700 nm was measured in order to analyse the light optical characteristics (figure 5). Based on the absorption spectra, we verified the MWCNT–OH dispersion in DNA (DNA-CTMA) and analysed the interaction between them. It was clear that the principal absorption bands of pristine DNA (DNA-CTMA) layers were placed at wavelengths of 210 and 260 nm, as has been previously reported [45, 46]. With the addition of MWCNT–OH into DNA (DNA-CTMA), the absorption band intensity and position were changed. Due to the band shift towards a higher wavelength with increasing [MWCNT–OH] (i.e. red shifted, bathochromic), the optical band gaps of DNA+MWCNT–OH (DNA-CTMA+MWCNT–OH) layers were decreased as compared to those of the pristine DNA (DNA-CTMA). At relatively higher [MWCNT–OH] (above ⩾0.15 wt%), the characteristic peaks of MWCNT–OH in the DNA (DNA-CTMA) layers were clearly seen in the wavelength range of 850–2500 nm [47]. The absorption of characteristic MWCNT–OH in DNA (DNA-CTMA) indicated increasing (hyperchromic) intensities with increasing [MWCNT–OH]. This meant that the hydrophilic –OH modification into MWCNT aided the interaction between MWCNT and DNA (DNA-CTMA) via electrostatic and van der Waals forces. Due to their wide spectral range of absorption (from UV, Vis, telecommunication window, to far-infrared), DNA+MWCNT–OH and DNA-CTMA+MWCNT–OH can be used in many applications, such as telecommunication and therapeutic devices [48].

Figure 5. Absorption spectra of the MWCNT–OH-combined DNA and DNA-CTMA layers. (a) and (b) Absorption spectra of the DNA and DNA-CTMA layers combined with distinct [MWCNT–OH].
Download figure:
Standard image High-resolution imagePL spectra and analysis results (i.e. peak shift, area, quenching, and height evaluated by the Gaussian fitting) of the DNA (DNA-CTMA) layers combined with distinct [MWCNT–OH] at a fixed excitation wavelength of 266 nm are shown in figure 6. The PL emission peak of DNA+MWCNT–OH (DNA-CTMA+MWCNT–OH) was shifted towards the lower wavelength side, i.e. a blue shift as compared to pristine DNA (DNA-CTMA). Here, pristine DNA (DNA-CTMA) showed the broad blue emission peak centered at ~480 nm. This suggested that the progression of the PL spectra was heavily dependent on [MWCNT–OH]. Interestingly, PL quenching was observed with increasing [MWCNT–OH] in DNA (DNA-CTMA) layers, which was attributed to the photon energy transfer between DNA (DNA-CTMA) and MWCNT–OH. The PL quenching was increased up to ~66% (~98%) in DNA+MWCNT–OH (DNA-CTMA+MWCNT–OH) as evaluated at [MWCNT–OH] of 0.3 wt%. These results suggested that the MWCNT–OH acted as an effective PL quencher in the DNA (DNA-CTMA) layers, which caused the different emitting centers and blocked the photoemission. As expected, the PL emission area and height were monotonically decreased with increasing [MWCNT–OH], because they were shown to be proportional to PL peak intensity. We noted slight differences in the PL spectra and analysis quantities (i.e. peak shift, area, quenching, and height) between DNA+MWCNT–OH and DNA-CTMA+MWCNT–OH due to the different solvents present in the samples [13].

Figure 6. PL spectra and analyses of the MWCNT–OH-combined DNA and DNA-CTMA layers. (a)–(c) PL spectra and analyses (i.e. peak shift, area, quenching, and height) of the DNA layers combined with distinct [MWCNT–OH]. (d)–(f) PL spectra and analyses of the DNA-CTMA layers combined with various [MWCNT–OH].
Download figure:
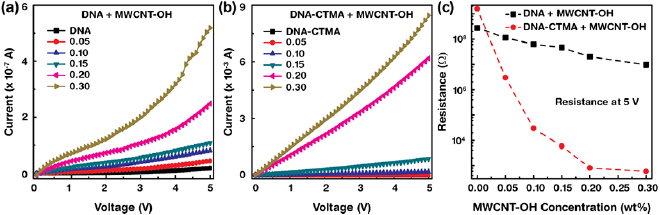
Standard image High-resolution imageThe current–voltage graphs of the DNA and DNA-CTMA layers combined with various [MWCNT–OH] are shown in figures 7(a) and (b). The current increased with increasing [MWCNT–OH], and could be easily controlled in the range of 10−9 A to 10−7 A (10−10 A to 10−3 A) in DNA+MWCNT–OH (DNA-CTMA+MWCNT–OH) through [MWCNT–OH]. The enhancement of the current was caused by the electrically metallic nature and inter-connection of MWCNT–OH in DNA (DNA-CTMA) layers. We observed a significance enhancement of current by the addition of MWCNT–OH into DNA (DNA-CTMA), and the ratio of current between DNA (DNA-CTMA) with [MWCNT–OH] of 0.3 wt% and DNA (DNA-CTMA) without MWCNT–OH was ~100 (~107) as measured at 5 V. The resistance of DNA+MWCNT–OH (DNA-CTMA+MWCNT–OH) as a function of the [MWCNT–OH] obtained from the current at a fixed voltage of 5 V is shown in figure 7(c). As expected, the resistance (inversely proportional to current) decreased with increasing [MWCNT–OH] from 280 MΩ to 10 MΩ (1.5 GΩ to 600 Ω) for DNA+MWCNT–OH (DNA-CTMA+MWCNT–OH) [13, 15].
Figure 7. Current–voltage properties of the MWCNT–OH-combined DNA and DNA-CTMA layers. (a) and (b) Current behavior of the DNA and DNA-CTMA layers combined with distinct [MWCNT–OH]. (c) Variation of resistance as a function of [MWCNT–OH] in DNA and DNA-CTMA layers obtained at a fixed potential of 5 V.
Download figure:
Standard image High-resolution image
4. Conclusions
Because of the limitations of the absorption and conductivity of DNA molecules, there is a need for a method to develop and enhance the chemical and optoelectronic characteristics of complexes made of DNA. For enhancing the optical spectral range and conductivity of DNA, the MWCNT–OH was one of the best nanomaterials to embed into DNA due to its wide range absorption, highly conductive, and hydrophilic nature. In consideration of this, we fabricated the MWCNT–OH-combined DNA and DNA-CTMA layers, measured their absorptions in the full spectral range from UV, Vis, telecommunication window, and IR regions, and enhanced the current significantly. The significantly enhanced optoelectronic properties suggested that MWCNT–OH-combined DNA and DNA-CTMA layers may be beneficial in applications of the physical devices and chemical sensors.
Acknowledgment
This work was supported by the National Research Foundation (NRF) of Korea (2016R1D1A1B03933768, 2017R1A2B4010955 and 2018R1A2B6008094).