

Abstract
In this review, we present nonlinear optical methods, based on the second and third order nonlinear polarization, especially in the context of material characterization tasks outside the area of life sciences—for which these techniques are mostly designed. An overview of application studies reported to date is given, together with a discussion on the advantages and limits of the individual methods. Furthermore, new ways of experimentally combining different optical concepts are introduced, and their potential for characterisation and inspection tasks is evaluated in the context of various case studies, including the investigation of semiconductor surfaces, metals and related corrosion products, as well as of organic materials.
Export citation and abstract BibTeX RIS
1. Introduction
Throughout history, mankind has successfully discovered and designed new materials with unique properties, by making use of increasingly sophisticated technologies. However, the design of new materials requires suitable analytical approaches for the investigation of their structure and physico-chemical properties. A multitude of techniques has been invented, with optical ones having gained a prominent place among all characterisation and diagnostic methods. Until the middle of the Twentieth Century, the basis for understanding light–matter interaction was formed. With the invention of a unique new light source—the laser—by Maiman in 1960, the interest in unusual effects of light–matter interactions began then to grow rapidly, and led to the discovery of new nonlinear optical (NLO) phenomena. In 1961, optical second harmonic generation (SHG) [1] was developed; shortly after that, in 1962, sum-frequency generation (SFG) [2] and third harmonic generation (THG) [3] were experimentally demonstrated. These new techniques were then soon actively applied in material and life sciences as unique diagnostic tools.
Due to the (mostly) non-destructive, contact-free and often monolayer surface sensitive nature of NLO methods, they have gained great importance in characterization tasks in disciplines ranging from research fields in physics and chemistry, e.g. [4, 5], to life science [6] and modern electronics [7–9]. Monitoring the change of physico-chemical properties of media in real time (in situ) is equally possible, and beneficially adds to the other unique characteristics of NLO methods, like surface selectivity and sensitivity. Often the investigation of materials in reflection geometry is the only feasible way of studying the surface of highly reflective, absorbing or scattering media, rendering NLO methods especially suitable. Furthermore, the opportunity to investigate buried interfaces in materials without causing damage represents another advantage of these methods over other probing techniques. However, the development and application of NLO methods for general and (routine) analysis tasks, especially in materials research outside the biomedical field or for non-destructive testing, as well as in industrial production and for quality control, is to date less common, and seldom reported. Nevertheless, the potential of NLO methods is equally present in these areas, and will thus be highlighted in the current review.
In short, light–matter interaction induces a polarisation  which is a complex function of the incident electric field E. For the simple linear case it can be written as

where  is the vacuum permittivity and
  is the linear optical susceptibility, which is characterised by the optical properties of the medium. If the intensity of the incoming electromagnetic wave is sufficiently high (the magnitude of the incident electric field is in the range of the atomic electric field), the optical properties of the medium are changed, and nonlinear distortions of the wave propagating in the medium occur. Consequently, the polarisation gets a nonlinear component, and can be represented as a power expansion of the electric field components
where  and
and  are the second and third order nonlinear optical susceptibilities [10]. In general, the nonlinear terms in equation (2) describe manifold optical phenomena besides SHG and THG (e.g. self-focusing, frequency mixing processes, etc).
In this review, we present several optical methods based on the second and third order of polarisation, and evaluate their potential for applications in material characterisation, where these techniques cannot yet be regarded as established. We first discuss the advantages and limitations of different techniques, and also introduce experimental configurations in which several optical methods are combined for characterization tasks providing complementary information. Specific case studies carried out by us, including also new data, shed light on the potential of these techniques by focusing on the investigation of technical materials. Mostly, aspects addressing structure and composition in the view of non-destructive testing are of concern here, in contrast to applications linked to the development of novel nonlinear optical materials and the determination of their optical properties, which is a whole research field on its own—see e.g. [11–13].
2. Overview of nonlinear optical characterization methods
2.1. Techniques exploiting second-order nonlinear polarisation
We focus first on methods based on nonlinear phenomena involving the second order susceptibility  , namely SHG and SFG, and give in the following only a short introduction into the theoretical background, since there are already many papers, review articles and books on these topics available [14–18].
SFG is a NLO process which can be represented in the photon description as depicted in figure 1. According to this diagram, two photons with different frequencies  and
and  are coherently scattered by a medium resulting in the creation of a photon at the sum of their frequencies
  . If we tune the frequency of the incoming photon
  (e.g. in the infra-red optical range), and fix the frequency
  of the second incoming photon (e.g. in the visible range), the SFG signal at different vibrational transitions (S1) of the medium can be resonantly enhanced. By recording the dependence of the intensity of the SFG signal
  on the tunable frequency

where  and
and  are the intensities of the two incident beams, we can obtain information about vibrational modes of molecules in the medium of interest [15, 19]. This is the essential principle of SFG investigations of surface and interfacial systems by the so-called SFG vibrational spectroscopy (SFG-VS) technique [20]. The SHG process is intrinsically a special case of SFG; instead of two incoming photons at two different frequencies, for SHG two photons of the same frequency (
 ) are coherently scattered by the medium to produce a photon at doubled frequency
  .
.
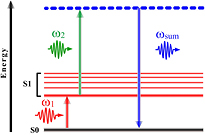
Figure 1. Jablonsky diagram of resonance SFG. The following notations are used: S0—ground state; S1—vibrational states; dashed line—virtual state;  —incoming photons;
  —resulting photon.
Download figure:
Standard image High-resolution imageIt is worth noting that the process of the second-order polarisation significantly depends on the structure of the medium that defines the dominant source of the nonlinear response. One important property of the structure, determining SFG/SHG activity of media, is centrosymmetry. Only in media with a non-centrosymmetric structure are SFG/SHG processes allowed in the electric-dipole approximation ( ). Since the surface or interface layers with a thickness of only a few interatomic distances are always non-centrosymmetric by definition, they contribute to a dipole surface nonlinear response [21]. Therefore, in centrosymmetric materials, an interatomic distance represents a more crucial spatial scale for SFG/SHG processes than the wavelength of the pump radiation. Due to this circumstance, investigation techniques based on SFG/SHG provide the unique possibility to supply surface selectivity and sensitivity for the investigation of materials. It should also be noted that centrosymmetry in media can be broken by electric fields, either applied externally (in electrochemical cells, in metal-insulator-semiconductor structures, etc) [22] or being of internal nature (e.g. created due to the redistribution of charge carriers in the surface layer) [23].
SFG/SHG experiments can be performed in transmission or in reflection geometry. For SFG/SHG experiments in transmission geometry, the bulk contribution is generally not negligible, even for centrosymmetric media, as a result of multipole interactions (electric quadrupole and magnetic dipole contributions). In that case, the interpretation of experimental results for the investigations of surfaces and interfaces can be difficult. On the other hand, in the case of SFG/SHG experiments in reflection geometry, the effective length of interaction (NLO coherence length) is significantly shorter than in transmission. Consequently, a contribution of SFG/SHG radiation generated in the bulk can be several thousand times smaller than in transmission geometry [10]. For the above reasons, SFG/SHG experiments in reflection, as schematically depicted in figure 2, are preferable for the investigation of surfaces and interfaces. It is also worth noting that for transparent materials, the bulk contribution to the nonlinear response can be estimated from measurements of the SFG/SHG signals in both transmission and reflection geometry [24]. In general, the second order NLO response depends on the following parameters:
- the wavelength of the incident beams (
 and );
 - the polarisation state of the incident beams ( and );
- the incidence angle of the incoming beams ( and );
- the azimuthal orientation of the medium ();
- the tensor of the second-order nonlinear susceptibility , where the number of independent (nonzero) components of the tensor is determined by the symmetry of the medium;
- the linear optical properties of the medium.


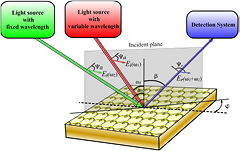
Figure 2. Typical optical scheme for the investigation of media in reflection geometry. The following notations are used:  —angles of polarisations of the incident and reflected radiation,
  —incident and reflected electric fields,
  —angles of incidence and reflection,
  —azimuthal angle of sample.
Download figure:
Standard image High-resolution imageBy setting the parameters of the incoming beam(s) in the experiment, and by analysing the characteristics of the re-radiated waves (polarisation  , azimuthal dependence of the amplitude of the electric field
  , etc), it is possible to extract information about the structure, symmetry and chemical composition of an investigated medium.
In particular, investigation of surfaces by rotation anisotropy (RA)-SHG is based on the measurement of the azimuthal dependence of the SHG signal for different combinations of polarisation states. In [25] and [26], the strong anisotropic dependence of the reflected SHG response from (1 0 0) and (1 1 1) faces of crystalline silicon on the orientation of the crystal relative to the plane of incidence was demonstrated for the first time. Numerous works then showed that RA-SHG opens wide possibilities for the diagnostics of morphological properties of the surface structure of crystalline materials. In particular, it was successfully demonstrated that RA-SHG is sensitive to: the microgeometry of surfaces [27]; the degree of vicinality of crystal surfaces [28]; surface reconstructions and surface phase transformations [29]; inhomogeneous mechanical stress (stress-induced) in interfaces (e.g. during annealing [30, 31]); mechanical stress inducing strains [32]; or to the optical (Casimir) nonlocality at, e.g. the SiO2/Si interface [33].
The potential of material investigations using NLO methods is significantly extended by studying in addition the dependence of the NLO response on the wavelength of the incident radiation (SHG/SFG spectroscopy). In particular, SFG/SHG spectroscopy was used for the investigation of interfaces of centrosymmetric structures— [34], non-centrosymmetric ones—ZnSe/GaAs(0 0 1) and heterostructures [35]. The further development of SFG-based techniques has led to several new applications, e.g. electronic SFG spectroscopy (ESFG), which makes it possible to reveal significant changes of the band gap and electronic structures of an organic thin film on silicon [9]. Using high-resolution broadband SFG-VS, the chirality can be characterized at molecular interfaces [36]. The combination of SFG/SHG-based techniques with interferometric ones offers further advantages: the complete measurement of the complex spectra of surface nonlinear response coefficients by phase-sensitive SFG-VS [37], or the direct measurement of the complex second-order nonlinear susceptibility by heterodyne-detected vibrational SFG [38], a frequency domain interferometric SHG spectroscopy technique based on the principles of Fourier spectroscopy [39].
As briefly laid out above, spectral and anisotropic SFG/SHG techniques can serve as sensitive instruments for the investigation of lattice perfection and ordering at surfaces and interfaces. Nevertheless, information about the lateral distribution of nonlinear active regions in a medium is often necessary and important in the investigation of materials, guiding the attention to nonlinear microscopy. The first authors to present an SHG imaging technique for materials characterisation were Hellwarth and Christensen [40]. In this work, the authors could monitor and localise grain structures and defects in thin films of polycrystalline nonlinear materials (ZnSe, GaAs, CdTe). Further early investigations were directed towards the principle of providing a strong focus for three-dimensional imaging (as used in linear confocal microscopy) by adding e.g. an optical resonator [41].
A schematic picture of a nowadays common SHG microscope (SHGM) is depicted in figure 3. As a light source, a high power pulse laser is mostly used, because the efficiency of the SHG process in reflection geometry is rather low. Usually, the light is directed through a dichroic mirror and a microscope objective onto the sample. The generated SHG response is then guided by the dichroic mirror to the detection unit. As detectors for the weak SHG signal, mainly photomultiplier tubes, photon counters or intensified CCD cameras (also in conjunction with multifocus scanning systems) are applied; the latter, however, with some limitations, as they are only suitable for optically thin samples [42].

Figure 3. Optical scheme of a laser-scanning SHG microscope (reflection geometry). Please note the difference of the focal excitation volumes:  ,
,  .
.
Download figure:
Standard image High-resolution imageThe SHGM provides several advantages due to the unique properties of the SHG process itself, such as: better resolution—the intensity of the SHG radiation depends quadratically on the incident intensity having a Gaussian distribution in the cross-section of the beam that leads to the decrease of the focal excitation volume  by a factor of
  [43] as schematically depicted in the inset of figure 3; selectivity—a significant SHG signal is generated only within media with a broken centrosymmetry; deep penetration—there is less scattering, since the wavelength of the pump radiation is typically in the NIR spectral range; polarisation sensitivity—SHG is highly sensitive to the orientation, birefringence and local symmetry properties of a medium. Due to the above facts, SHGM is actively used for the investigation of various materials and structures, as particularly demonstrated for: monitoring the corrosion products found below a painted metal surface [44], probing the interplay of nanoscale structures [45], non-invasive detection of strain fields around through-silicon-vias conducting rods in Si(0 0 1) [46], direct 3D visualization of the electric field in integrated circuits [47], etc.
At the same time as the list of investigated materials by SHGM is expanding, many groups are dedicating their efforts to further development of the SHGM technique. For instance, an improvement of the imaging ability of SHGM could be reached by a modification of the incident beam shape from Gaussian to Bessel, allowing rapid probing of nonlinear properties of thick samples [48]. The spatial resolution was enhanced up to 26% by a subtractive imaging method which is based on the intensity difference between two SHG images obtained with circularly polarised Gaussian and doughnut shaped beams [49]. An improvement of the efficiency of the SHG process up to 3.7 times was obtained by using a radially polarized incident beam [50], and up to 12 times by using a metal tip, e.g. to obtain a signal from single nanocrystals (NaNbO3) [51].
In parallel with the development of NLO microscopy, further progress has been made in linear optical imaging, which has led e.g. to optical coherence microscopy (OCM) by including principles of interferometry [52]. OCM combines the low-coherence imaging properties of optical coherence tomography (OCT) [53] and the high spatial resolution of confocal microscopy, and unites their unique properties in order to obtain three-dimensional structural information from below the surfaces of materials. OCM allows high speed imaging with micron resolution, and was mainly improved for biological and medical sciences, but applications in the field of material characterization and non-destructive testing started to emerge, similarly to the situation for OCT [54, 55]. The light sources used are typically at wavelengths in the 800–1030 nm spectral range, due to light absorption by water in biological tissue. For material characterisation, this limitation is not in general relevant, and for longer wavelengths an increased penetration depth can be reached, as demonstrated for various polymers (from 2 mm for 840 nm up to 4 mm for 1550 nm) [56].
As seen above for linear optics, the combination of techniques has led to the development of new microscopy techniques. The same is true for nonlinear optics. In [57], an interferometric SHG microscope (iSHGM) was presented, combining the unique properties of OCM and SHG microscopy. The working principle is explained in the following on the example of a Mach–Zehnder type interferometer, as depicted in figure 4. A nonlinear crystal is placed in the reference arm, which is irradiated by a portion of a broadband laser source. The remaining light is guided onto the sample and SHG waves are reflected from SHG active layers within the material (S, 1 or 2). The movable mirror in the reference arm allows one to change the optical path l2. Therefore, when the optical paths of the reference arm and an SHG active region within the sample arm are equal ( ), interference of SHG light can be observed on the detector. The interferogram contains a set of distinct interference fringes with a width determined by the coherence time of the light source, which are centred at the corresponding time delays (
 ) when moving the reference mirror backwards, as illustrated in figure 4. The obtained interferogram is detected by a photodetector, and a mathematical extraction of the peak envelope |gtc| of the interferogram can be performed by a Hilbert transform. Hence, the depth scanning results in a sequence of peaks corresponding to the distribution of the SHG active layers within a sample. In this way, depth scanning is implemented in the time domain (TD). However, depth scanning can also be performed by an alternative interference method in the spectral (or Fourier) domain (SD, FD) [58, 59], keeping the path length of the reference arm fixed (
 ) and by evaluating the Fourier transform of recorded spectra. This type of depth scanning offers an improvement of the imaging speed, because information on the optical structure of a material can be detected over the entire depth by one shot. However, dynamic focusing—i.e. adjusting the focus within the sample to the actual measurement position—is not possible, which leads in general to a worse lateral resolution than for TD imaging. Nevertheless, registration of the signal in SD-iSHGM gives an increase of the signal-to-noise ratio compared to TD-iSHGM [60]. Furthermore, in [61] an increase of the axial (depth) resolution in a frequency-domain iSHGM was shown by using the spectrum of the incident light broadened by continuum generation in an optical fiber. Other developments included the detection in iSHGM by a heterodyne technique, and showed potential to increase the imaging depth in scattering media [57]. As an extension, in [62] it was demonstrated that polarisation sensitivity can be added to iSHGM, and serves as an additional source of information about the structural properties of a sample.

Figure 4. Optical scheme of a time-domain laser-scanning interferometric SHG microscope (reflection geometry). The following notations are used: BS1, BS2, BS3, BS4—beamsplitters, MO—microscope objective, DM—dichroic mirror.
Download figure:
Standard image High-resolution imageAs to combinations of several existing techniques, in 2004 the possibility of using linear OCT with nonlinear iSHGM was introduced for medical biology research [63]. In this work, the authors demonstrated the simultaneous collection of information by a linear interferometric optical channel (the topography and internal optical structure of the material) and by a nonlinear interferometric (SHG) one, offering an additional molecular-contrast imaging mechanism, protected from the influence of multi-photon fluorescence.
It should be pointed out in particular that an SFG process can also be the result of a third-order NLO process in two ways—namely, as a four-photon interaction with two possible combinations at the output:  ,
,  (third-order sum frequency generation, TSFG) [64, 65], or by mixing of the two incident light fields
  ,
,  with an applied external electric field at the investigated surface [66]. Such TSFG processes provide the opportunity to image electronic states of molecules, e.g. in living cells or tissues. Since TSFG is similar to the THG process—see below—the contrast mechanism in imaging is also basically the same.
2.2. Third harmonic generation microscopy
With increasing intensity of the incident radiation, higher order terms of the nonlinear polarisation give a more and more significant contribution to the nonlinear response. In the case of the third order nonlinear polarisation  , three photons of identical wavelength
  (typically in the infra-red optical range 900–1500 nm) are coherently scattered by a medium creating a photon with
  , as depicted in the diagram of figure 5. THG radiation can be induced in media in several ways, such as resonance enhancement or by interfaces within the specimen. An interface sensitivity of THG process appears when a medium is inhomogeneous, either in the refractive index or in the nonlinear third-order susceptibility
  , resulting in a significant THG signal [67].

Figure 5. Jablonsky diagram of THG. The following notations are used: S0—ground state, dashed lines—virtual states.
Download figure:
Standard image High-resolution imageAccording to equation (2), THG has a third-order dependence on the incident electric field, therefore a THG signal is even more restricted to the focal region, serving as a basis for sectioning in nonlinear 3D microscopy. When the phase-matching condition is fulfilled, emitted THG waves constructively interfere in transparent media with fundamental waves mostly in the forward direction; therefore, THG signals are better detected in a transmission geometry. In the case of nontransparent media, THG waves can also be backscattered, so that the signal can be detected in reflection geometry, similarly to the case for SHG. Consequently, the intensity of the backscattered THG signal is increased in dense scattering media. Nevertheless, the intensity of a backscattered THG signal is usually weak, so that highly sensitive detectors are required. However, in [68] it was theoretically and experimentally demonstrated that backward-directed THG waves can be directly induced in nanostructures, and that their magnitude can be comparable to forward THG.
Third harmonic generation microscopy (THGM) was demonstrated to date for the investigation of different materials, taking advantage of the following characteristics: long-wavelength excitation—gives the capability of deeper penetration even in turbid media [69]; polarisation sensitivity—delivers additional contrast mechanism, e.g. for non-invasive characterization of microstructures fabricated using photopolymerization [70]; coherence nature—allows interferometric THGM, as used for the measurement of height variations or changes of layer thicknesses with an accuracy of up to 5 nm [71]; enhanced localisation—since the intensity of the THG signal depends cubically on the incident radiation, precise three-dimensional (3D) imaging is possible, as shown e.g. for multilayer painting artworks in [72].
These favorable properties linked to the THG process stimulated further improvements of the THGM technique. Namely, plasmon-resonance-enhanced THGM was demonstrated with a molecular specificity [73], a cylindrical focused beam enabled imaging of individual metal nanocones [74], the usage of Bessel beams facilitated rapid probing of large volumes [75], and the control of the spatial profile of the focal field polarisation state was shown to improve spatial resolution [76].
3. Experimental
In the following, individual experimental set-ups, which were to a certain extent specifically developed by us for the application examples presented in the main section of this paper, are briefly described.
3.1. Combined linear and nonlinear optics set-up (SHGM, iSHGM and OCM)
In order to take advantage of the individual characteristics of linear and nonlinear imaging, a combined set-up has been realised in our lab. This set-up includes a scanning SHGM, with the possibility also to perform iSHGM measurements, and an OCM unit for simultaneous coherent detection of the linear and nonlinear response, as illustrated in figure 6 and described in detail in [77]. With the help of the flippable mirror M5, one can easily switch between the two modes (SHGM and OCM or iSHGM and OCM). As a source of radiation, a compact broadband fs fiber laser with a central wavelength of 1560 nm, pulse duration of 86 fs and repetition rate 80 MHz is used, providing an average output power of 350 mW (Toptica, Femtofiber pro IR) and an increased penetration depth within scattering materials. For the detection of the SHG signal centered at 780 nm, a highly sensitive, IR-enhanced and cooled photomultiplier tube (PMT) (R9110p, Hamamatsu) is installed. The incident beam is focused onto the sample with a microscope objective Epiplan 50×, NA = 0.7 (ZEISS). For the detection of the interference signal in the OCM and iSHGM modes, a heterodyne technique is applied, using a piezoelectric transducer (PZT) for periodic path length variations of the reference arm. The back reflected interferometric signal at the fundamental wavelength is detected with a two-channel balanced amplified InGaAs/PIN photodetector (Thorlabs). In the SHGM mode a transversal resolution of ≈2 μm and an axial resolution of 7.5 μm can be achieved. Due to the extended bandwidth of the light source (62 nm), a low coherence sectioning effect with a resolution of 20 μm in depth is obtained in the linear case. However, due to the confocal characteristics of the set-up, the axial resolution is improved to 6 μm in the OCM mode, with a sensitivity of 92 dB at an incident average power of 75 mW on the sample. In the iSHGM mode of the combined set-up, a beta barium borate (BBO) crystal with a thickness of 1 mm and oriented for type I phase matching is situated in the reference arm, in order to obtain a reference SHG wave at the wavelength of 780 nm. A maximum sensitivity of 103 dB could be achieved (in the limit of perfect conversion efficiency for SHG) with an incident average power of 80 mW on the sample and an integration time of 1 ms for the lock-in amplifier. In real samples, the efficiency of the SHG process is significantly lower; therefore, the value of SNR for iSHGM is correspondingly smaller [62]. An axial resolution of 6 μm is also achievable for this mode of the combined set-up.
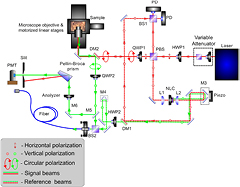
Figure 6. Optical scheme of the experimental TD laser-scanning interferometric SHG and OCM microscope (reflection geometry). The following notations are used: BS1, BS2, BS3, BS4—beamsplitters; DM1, DM2—dichroic mirrors; HWP1, HWP2,—half-wave plates; L1, L2—lenses, NLC—nonlinear crystal, PD—photodetector; PMT—photomultiplier tube; QWP1, QWP2—quarter-wave plates.
Download figure:
Standard image High-resolution image3.2. SFG-VS and RA-SHG experimental set-ups
The SFG set-up used in this work, and schematically depicted in figure 7, is based on a Nd:YAG pump laser at a wavelength of 1064 nm with a pulse duration of 25 ps and a frequency of 50 Hz (EKSPLA). Within the laser system, the beam is frequency doubled using a potassium dihydrogen phosphate (KDP) crystal. The fundamental and the frequency doubled beam are then passed into an optical parametric generator based on barium borate and AgGaS2 crystals, to generate tunable laser radiation in the range from 680 nm to 10 μm. SFG spectra are obtained by spatially and temporally overlapping the IR beam ( , tunable) and the fixed beam
  , 532 nm) in reflection geometry. The IR beam impinges at an angle of 55°, and the VIS beam at 60° onto the surface, resulting in an angle of 59.7° for the SFG beam. This leads to a convenient spatial separation of the SFG signal beam from the reflected fundamental beams. Additional spectral filtering is achived by a notch-filter and a monochromator, which is moved in a synchronous way to the wavelength of the tunable IR beam. The SFG signal is detected by a PMT (R7899, Hamamatsu), and 200 laser pulses are usually averaged per data point (wavenumber increments of 2 cm−1 in the spectra) for a reasonable SNR. The spectra are recorded either in ssp- (s-polarised SFG, s-polarized visible and p-polarized IR beam) or ppp-polarization combination. For the application examples shown below, the spectra were obtained by tuning the IR beam in the region of interest, which—in our case—was from 2800 cm−1 to 3000 cm−1 (C–H stretch region of methyl and methylene groups). The spectral resolution is determined by the bandwidth of the IR beam, which is <6 cm−1. All spectra were normalized to the intensities of the IR and the fixed visible beam, which were measured simultaneously in order to compensate for fluctuations in the laser intensity.

Figure 7. Experimental set-up for SFG experiments. The infrared beam (tunable) and the visible one (fixed) are temporally and spatially overlapping on the sample to generate light at wSFG. A notch filter (F) is placed before the monochromator, equipped with a photomultiplier tube as detector. All three beams are linearly polarized (direction adjustable with half wave plates HWP1, HWP2 and Glan–Taylor (G–T) prism as analysator).
Download figure:
Standard image High-resolution imageThe SFG set-up can also be used for RA-SHG measurements with the tunable picosecond laser system, in order to obtain RA-SHG data at different fundamental wavelengths in the range between 750 nm and 1000 nm (limited by the PMT system).
In a similar way, we also used the 1.56 μm fs laser system (described above for the combined microscopy set-up) for RA-SHG experiments. For extremely weak signals on some crystal surfaces, a photocounting system in combination with the cooled PMT equipment had to be used.
3.3. THG microscope
The THG microscope was configured in transmission geometry as depicted in figure 8. Since THG processes are highly sensitive to the quality of focus, a deformable mirror is incorporated for correction of the optical aberrations induced in the sample and by imperfections of the optical components of the microscope system. A chromium forsterite laser (Mavericks, DelMar Photonics) delivering optical pulses with a duration of 65 fs at a repetition rate of 100 MHz, with a central wavelength of 1235 nm and an output power around 200 mW was used as light source in the experiments. The expanded beam can be steered by the two-axis galvanometer mirrors M1, M2. After passing the deformable membrane mirror (MIRAO 25e, Imagine Eyes), the incident radiation is focused onto the specimen by the objective lens (Olympus UApo/340 water immersion, 40×, NA = 1.15) having a high transmission of up to 60% at the central wavelength of 1235 nm. The power of the incident radiation in the focus was approximately 30 mW. The THG radiation generated is collected by an oil immersion condenser (NA = 1.4), and separated from the fundamental light by a dichroic mirror before being detected by a photomultiplier tube. Specimen scanning in the axial (z) direction is enabled by a PZT attached to the sample stage. The axial resolution was determined to be approximately 1.3 μm, while the lateral resolution was better than 500 nm. A more detailed description of the THGM experimental set-up can be found in [78, 79].

Figure 8. Optical scheme of the experimental THG microscope in transmission geometry.
Download figure:
Standard image High-resolution image4. Results and discussion
Nonlinear optical methods are, as described above, powerful and versatile tools for surface and interface studies, providing information and contrast even on a molecular level. In this section, we present a range of applications in the field of material characterisation and testing of semiconductors, metals and polmyers.
4.1. Semiconductors
First, RA-SHG results of experimental and theoretical investigations of gallium arsenide (GaAs) crystal wafers are presented, since they can serve as an instructive example of how to model the observed SHG response. This semiconductor compound is often used in e.g. photodiodes, light emitting devices (due to the direct bandgap) and high mobility transistors. Here, a GaAs single crystal wafer with a (1 0 0) surface was investigated. Since GaAs exhibits a non-centrosymmetric zinc blende crystal structure, as depicted in the inset of figure 9(a), a strong SHG response is to be expected. For the RA-SHG measurements, the femtosecond fiber laser at a central wavelength of 1560 nm was used as a source of radiation.

Figure 9. Experimentally obtained (a) and theoretical (b) RA-SHG responses of a GaAs(1 0 0) sample for different combinations of polarization (pp, ps, sp, ss). © [80] 2016, Optical Society of America.
Download figure:
Standard image High-resolution imageAs shown in figure 9(a), the shape of the azimuthal SHG response reflects well the structural (four-fold) symmetry, with peaks at every 90° for all polarization combinations (e.g. sp meaning s-polarized fundamental and p-polarised SHG radiation), except for the case of ss, where the SHG signal is neglegible. The experimental SHG data of the GaAs(1 0 0) sample were then used for the first time to theoretically model the SHG response from a non-centrosymmetric bulk material in the frame of the so-called simplified bond hyperpolarizability model (SBHM), as reported in [80, 81]. This model takes the orientation of the bonds into account, and assumes that SHG radiation is originated by anharmonically moving charges along the bond directions. The simulation, with the result depicted in figure 9(b), was performed by accounting for the Fresnel coefficients, which are incorporated in the standard phenomenological theory of SHG, and by using only one free parameter—the effective bulk hyperpolarizability. Comparing the results of the performed simulation with the experimental data, shown in figure 9(a), we can conclude that the model as a whole correctly reproduces the symmetry and relative intensities of the SHG response from GaAs(1 0 0) for the pp, ps, sp, ss polarization combinations, and that therefore the dipolar SHG contribution from the bulk is the dominant source of radiation.
The most widely used semiconductor is silicon Si, with a lattice that exhibits in contrast to the above case of GaAs a center of inversion, thus effectively forbidding a SHG contribution from the bulk in the electric dipole approximation. Consequently, for Si the sensitivity for surface related phenomena should be reflected in the SHG response, which is promising for the investigation of physical properties and for the understanding of processes at the surface, which have great practical significance. As an example, Si(1 1 1) wafers, as e.g. used in the fabrication of bipolar junction transistors (BJT), exhibit a C3v symmetry.
In the experiment, the RA-SHG response of a Si(1 1 1) sample investigated with an incident radiation at a wavelength of 800 nm reflects the underlying bond symmetry. As seen in figure 10(a), the shape of the angular SHG response is six-fold for ps, ss and three-fold for pp, sp polarization combinations, and the pattern could succesfully be explained in the context of the SBHM introduced above, including only surface dipole contributions [82].
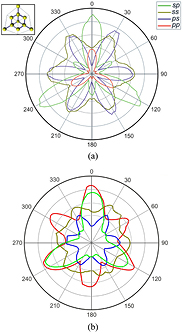
Figure 10. RA-SHG measurement of a Si(1 1 1) surface at a fundamental wavelength of 800 nm (a) and 1560 nm (b).
Download figure:
Standard image High-resolution imageInterestingly, when switching to longer wavelengths, the symmetry of the SHG response changes, as depicted in figure 10(b) for the RA-SHG response from a Si(1 1 1) surface measured at a fundamental wavelength of 1560 nm. This is best seen for the case of pp polarization, which is now six-fold, instead of three-fold as in figure 10(a) for 800 nm. In this context, it was shown that the SHG response for the pp polarization combination is a result of interference between bulk and surface nonlinear contributions [83]. With the help of the SBHM, the different contributions originating from dipolar surface and quadrupolar bulk contributions could successfully be separated, also by evaluating measurements at arbitrary polarization orientations of the input raditation, exemplified for a fundamental wavelength of 890 nm in [82, 84]. In figure 11, the RA-SHG response from Si(1 1 1) for the pp polarization combination is plotted, for the first time, for several different wavelengths of the fundamental radiation in the range between 750 nm and 1050 nm. Interestingly, with change of the incident wavelength, the azimuthal SHG response evolves as described above from a three-fold symmetry at 750 nm to fully six-fold at 950 nm. However, the six-fold symmetry is not maintained up to 1560 nm as expected (figure 10(b)), but changes back to a three-fold one when reaching 1050 nm. A theoretical description of this cycling behaviour of the pp polarized SHG component is still in progress. Nevertheless, it seems likely to be able, by simply varying the wavelength of the incident radiation, to distinguish and separate the signal originating from the surface from the bulk one, providing in this way selective information on the different regions of the sample.
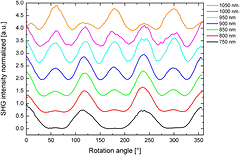
Figure 11. RA-SHG response of Si(1 1 1) at different fundamental wavelengths for pp-polarization combination. The data are normalized and for better visualization the plots are shifted vertically.
Download figure:
Standard image High-resolution imageAs a practical example, the effect of plasma treatment on such Si surfaces is shown in the following. In recent years, the interest in multilayer silicon wafers has grown rapidly. The production of such multilayer silicon wafer structures is based on direct bonding and subsequent annealing of the wafers, which need to be connected [85]. Generally, the substrate surfaces are held together by van der Waals and hydrogen bonds [86]. Surface treatment and annealing help to increase the bonding strength further, reaching bulk strength with optimized treatment parameters. Normally, the bonding process has to be performed at high temperatures—above 800 °C—which is not possible if microelectronic circuits are present on the wafers. Low temperature bonding—below 300 °C—calls for activated wafer surfaces in order to reach high bond strengths, which is achieved by, e.g. surface plasma treatment [87]. However, the surface structure and chemistry of the silicon wafers is changed during such processes. Theoretical and experimental investigations of chemically modified Si(1 1 1) surfaces have already been presented in [88]. In particular, a possibility of the identification of changes between thermally grown and plasma-oxidized interfaces were reported using the differences between the RA-SHG responses. Thus, changes of the surface chemistry of the silicon wafer can be monitored by the changes of the anisotropic and isotropic contributions of the SHG response before and after treatment of the surface.
In the frame of our investigations, Si(1 1 1) wafers activated by nitrogen or oxygen plasma and an untreated reference Si(1 1 1) were used as samples. At first, the RA-SHG response from the reference Si sample was obtained. As seen from the data depicted in figure 12(a), the reference sample shows an unusual SHG response in comparison with the measurements of Si(1 1 1) presented above and depicted in figure 10(b). Such a change of the symmetry of the RA-SHG response, as visible in figure 12(a), is induced by the vicinal structure of the surface, which was confirmed by x-ray diffraction measurements giving a miscut of  . The RA-SHG response from the surface of the treated Si(1 1 1) wafers, activated by nitrogen and oxygen plasma, exhibit a changed pattern, nearly recovering to the symmetry obtained from uncut surfaces.
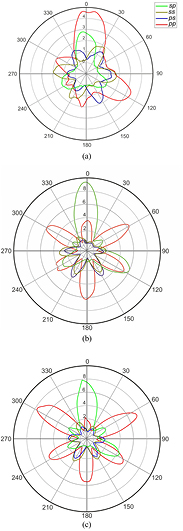
Figure 12. RA-SHG response for the different combinations of polarization of an untreated vicinal Si(1 1 1) reference sample (a), and for samples activated by nitrogen (b) and oxygen (c) plasma. The wavelength of the incident radiation is 1560 nm.
Download figure:
Standard image High-resolution imageIn detail, from the data shown in figure 12 the following observations can be made:
- The intensity of the SHG signal from the Si(1 1 1) wafers activated by nitrogen and oxygen plasma is significantly increased in comparison with the RA-SHG response from the untreated reference Si(1 1 1) sample shown in figure 12(a). According to conclusions published in [27], the growth of the maxima of the SHG intensity of the isotropic and anisotropic contributions for the pp-polarization combination can be interpreted as a decrease of Ångstrom-scale microroughness of the surface. Such behaviour could also be confirmed in our case with the help of AFM measurements [87].
- The re-appearance of the conventional three- and six-fold symmetries of the RA-SHG responses indicates a potential reorganisation/randomisation of the steps of the miscut surface in comparison with the reference sample. This is confirmed by the growth of the anisotropic contribution of the SHG response, reflected in an equalisation of the maxima of the six-fold symmetry for the pp-polarization combination, as seen in figure 12.
A comparison with the literature cited above and the new data given here confirms, for the RA-SHG technique, that changes induced by plasma treatment, which promotes the increase of the bonding strength, can efficiently be followed, and that this method can serve in the future for in situ monitoring during plasma processing, to obtain a more substantial understanding of the studied phenomena.
4.2. Metal surfaces
In this section, results of selected investigations on metal surfaces and their oxides or on corrosion products formed are presented. The focus is put on industrially relevant surfaces; thus, microscopy techniques are the methods of choice for these heterogeneous sample structures.
4.2.1. Zn-based galvanic coatings on steel.
Zn-based coatings on steel, produced e.g. by hot dip galvanizing, serve for corrosion protection, and are still under development to enhance their performance. Alloying with additional elements like Al or Mg are recent concepts aimed to improve the degree of protection. At the same time, surface sensitive methods like x-ray photoelectron spectroscopy (XPS) have to be used in order to elucidate the underlying corrosion mechanism for the various coating structures, as shown in e.g. [89]. In the following, we present the results of investigations on a steel surface coated with a Zn-based layer, which was exposed to a salt spray test for several hours.
As a result of the exposure, corrosion features have formed on the surface, which were initially investigated by XPS, representing a rather complex and expensive analysis method requiring ultrahigh vacuum (UHV) conditions.
The distribution of corrosion products obtained is shown in figure 13(b), revealing areas covered mainly by hydrozincite  , ZnMgAl double layered hydroxides (DLH) and simonkolleite
  . However, it is not possible to determine a potential fraction of ZnO on the surface unambiguously from the XPS data alone. With the help of SHGM, a corresponding mapping was performed, covering the same area as indicated by the red rectangle in figure 13(a). The mapping itself shows that ZnO had preferentially formed within the detected regions of simonkolleite, as depicted in figure 14 (green spots). In this context, all relevant chemical components were experimentally tested previously, and only ZnO was seen to form SHG-active wurtzite crystals with a 6 mm point group symmetry. In the simultaneously acquired OCM image, the overall reflectivity of the sample is responsible for the contrast. The brighter and shinier regions appear less corroded, and are found outside the areas covered by simonkolleite and ZnO. For such heterogeneously corroded surfaces, the spatial resolution of XPS, being in this case several tens of microns, as well as the sensitivity and selectivity required to detect the small ZnO crystals, is obviously not sufficient, and requires additional input—which can be obtained by OCM and SHG.
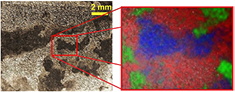
Figure 13. (a) Image of the surface of a Zn-based corrosion protection sample after a salt spray test; the red rectangle indicates the investigated region. (b) XPS mapping of the indicated area on the coating, exhibiting regions with hydrozincite, double-layered hydroxides and simonkolleite (red, green and blue regions, respectively).
Download figure:
Standard image High-resolution image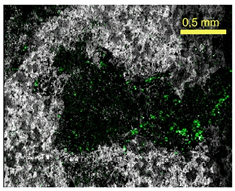
Figure 14. In-plane SHG image (green) overlapped with an OCM image of the Zn-based coating on steel, indicating regions of formed ZnO as a corrosion product. The images were obtained in the SHGM and OCM mode of the combined optical set-up.
Download figure:
Standard image High-resolution image4.2.2. Filiform-like corrosion features.
Under certain environmental conditions (elevated humidity), so-called filiform corrosion features, which advance in a worm-like manner on the surface, can form on Zn-based coatings containing Al. In the context of the current investigations, such features were first artificially produced with the help of an electrochemically induced corrosion process. Also in this case, the surface was investigated by XPS and SHG. Among potential candidates for corrosion products formed were zinc carbonate  , as well as a mixture of ZnO and zinc acetate dihydrate
  . Since zinc carbonate
  is isostructural to calcite, forming a centro-symmetric crystal structure in the rhombohedral space group R3c, and known to exhibit no bulk SHG signal, and since, in the same way, the most common form of zinc acetate dihydrate (zinc acetate with two crystal water molecules) also has an inversion center and forms monoclinic crystals with space group C2c, again only ZnO is built in as SHG-active wurtzite crystallites; this was confirmed by SHGM (green regions in figure 15).
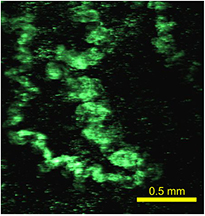
Figure 15. In-plane SHG image of the surface of a galvanic coating containing large amounts of ZnO crystals in the observed filiform corrosion features.
Download figure:
Standard image High-resolution imageWith this knowledge, real filiform corrosion features, formed on such galvanic coating surfaces, were investigated. The formation of such features is facilitated when a further dense overlayer covers the surface. In the case presented here, an overlying organic protection coating with a thickness of 50 μm was deposited on the galvanic coating. Direct detection of the corrosion features by XPS below an additional coating is in such a case obviously not possible. Nevertheless, with the help of SHG microscopy we could at least directly determine the distribution of the SHG-active corrosion products under the thick organic covering layer, which also appears transparent in the near IR spectral range. The images obtained, which were recorded simultaneously in the OCM and iSHGM modes of the combined optical set-up, are shown in figure 16. Most interesting is the fact that the distribution is not homogeneous: e.g. the middle filiform structure exhibits far less SHG active material than the outer two ones. This might be caused by a compositional gradient along the feature, which advances under the coating, when going from the cathodic tail to the anodic headlike part [77]. Obviously, the tip of the anodic head of the middle feature is situated in the upper third of the image. Additionally, a 3D-SHG image was obtained in the scanning SHGM mode, and is shown in figure 17. Correspondingly, it is also even better visible, here, that the corrosion feature in the middle exhibits far less SHG-active crystals.

Figure 16. (a) In-plane and (b) cross-sectional SHG images (green) overlapped with linear optical images (grey) taken from a corroded metal surface covered by a thick organic coating. The yellow-dotted line indicates the position where the cross-sectional image was obtained. The images were simultaneously acquired in the iSHGM and OCM modes of the combined optical set-up. Reproduced from [77]. © Astro Ltd. All rights reserved.
Download figure:
Standard image High-resolution image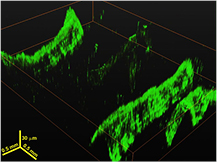
Figure 17. 3D-visualization of SHG data obtained from the filiform corrosion features situated below an organic top-coating on the metal surface. The data were obtained in the scanning SHGM mode of the combined optical set-up.
Download figure:
Standard image High-resolution imageFinally, it should also be noted that during the measurements a bright (greenish/whitish) light was visually observed on the metal surface. Presumably, the nature of this light stems from multiphoton luminescence, which can be caused by the interaction of the high-intensity incident radiation with the organic coating or with the high density of conduction band electrons in the surface layer of the metal [83]. However, due to the coherent property of the SHG process, the influence of the multiphoton luminescence on the detection of the SHG radiation can be fully suppressed in the interferometric SHGM mode, which guarantees that only the SHG radiation in the wavelength region of 780 nm is recorded. It is worth noting that the high level of multiphoton luminescence, observed by us during the experimental investigations, also raises questions about the origin of the detected light reported in other cases, as e.g. for the investigation of corrosion features monitored beneath a paint layer with a conventional laser scanning SHGM technique [44]. Furthermore, it is also important to mention here that the materials are not changed during the optical investigations, when the intensity of the incident light is below the damage threshold. In contrast, the impinging x-rays can cause degradation, as e.g. observed for zinc hydroxide during XPS analysis [90].
4.2.3. ZnO nano-rod formation on galvanic coatings.
Unlike the above case, where corrosion changes the surface in an undesired way, deliberate surface modifications are often induced in order to obtain a different chemistry and/or topography for subsequent processing steps, or to tailor the overall properties of the material. For galvanic Zn-based coatings on steel, a novel chemical procedure was developed, which produces a large scale homogeneous overlayer of ZnO nanorods, as seen in the example of figure 18. Such surface layers could serve in the future to tailor the surface chemistry and topography so that, e.g. adhesion and bonding of organic coatings is promoted, or corrosion resistance properties are further enhanced.
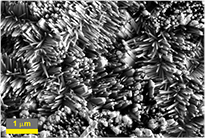
Figure 18. Scanning electron microscopy image of a ZnO nanorod layer on a electrogalvanized Zn coating.
Download figure:
Standard image High-resolution imageIn order to directly compare the linear and nonlinear optical responses from the samples with nanorod-like structures and a pristine Zn reference surface, they were arranged side by side and imaged simultaneously with the same experimental settings. The resulting in-plane OCM and SHG images of the surfaces are depicted in figure 19.

Figure 19. In-plane OCM (top) and corresponding SHG image (bottom) of a reference surface (left) and a treated one with ZnO nanorods on top (right). The images were obtained in the scanning SHGM and OCM modes of the combined optical set-up.
Download figure:
Standard image High-resolution imageFrom the appearance of the OCM images alone, figure 19 (top), a difference between the surfaces is not clearly evident. However, in the SHG images, the modified surface provides intense SHG radiation, which is easily detected. In order to take the contrast arising from the topography into account (regions out of focus because of tilted or bent surface), cross-sectional images were also obtained, as presented in figure 20, showing a homogeneous intensity distribution along the surface.

Figure 20. Cross-sectional OCM (top) and SHG (bottom) images of the reference and a ZnO nanorod sample. The images were obtained in the scanning SHGM and OCM modes of the combined optical set-up.
Download figure:
Standard image High-resolution imageSeries with differently treated surfaces, leading to varying amounts of ZnO nanorods, were subsequently evaluated. These measurements showed the intensity of SHG signal to be directly proportional to the height of the ZnO nanorods (thickness of the rod layer). Consequently, a rather simple method for the in situ detection and control of the formed nanostructures even during production seems reasonable: a fiber optic system guiding and collecting the fundamental and SHG radiation from a point on the surface of such a coated steel strip as it moves continuously in the production plant during processing.
4.3. Organic materials
Organic materials are more similar to biological tissue than the materials presented above, albeit different characteristics are also here of interest, with selected applications presented in the following.
4.3.1. Polymers joined by tetrapodal ZnO linkers.
In the task of reliably joining polymers of different type, difficulties are encountered: the chemical and physical properties of the individual polymers are often incompatible for conventional bonding methods. In [91], a new approach was introduced to achieve strong bonding between polytetrafluorethylene (PTFE), well known as Teflon and being a prime example of a non-sticky polymer, and cross-linked polydimethylsiloxane (PDMS). It was shown that tetrapodal ZnO crystals can be used as powerful mechanical adhesion promoters in a straightforward and easily applicable way, as depicted in the sketch of figure 21. Since these polymers have different chemical and physical properties, tetrapodal linkers are differently embedded, and the question of how such linkers are distributed at the interface between the two polymers arises. Up to now, investigations have mostly been carried out in a destructive way in an electron microscope. Here, the polymer samples were at first investigated with the linear OCM method. As can be seen in figure 22(a), OCM is only capable of revealing the surface with its uneven topography. The tetrapodal ZnO crystals seem not to be sufficiently backscattering in order to be detected. Also, the interface could not be resolved, due to the small differences in the refractive indices at the interface. Only by an additional gold coating is the reflectivity of the tetrapods sufficiently increased: they finally appear in the OCM image, as shown in figure 23(b). However, since the tetrapodal ZnO crystals are SHG active their distribution can be evaluated directly from the SHG image (in-plane image of figure 22(b)). The presence of the SHG signal for the coated tetrapods in figure 23(a) indicates only a very thin layer of gold. The combination of the simultaneously acquired OCM and SHGM images, as depicted in figure 22(c), helps to explain the structure of the joined polymers even better, showing that elevations of the surface occur where the crystals are emedded directly below.
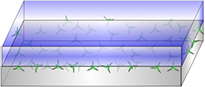
Figure 21. Schematic illustration of bonded polymer layers with the help of the tetrapodal ZnO crystals, mechanically linking the layers.
Download figure:
Standard image High-resolution image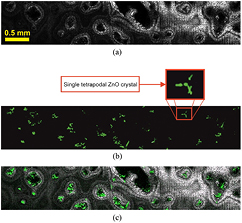
Figure 22. In-plane images of two different polymer layers bonded by tetrapodal ZnO crystals, simultaneously obtained in different microscopy modes: (a) OCM, (b) scanning SHGM; (c) overlay of OCM and SHGM images. In the inset of (b) the SHG image of a single tetrapodal ZnO crystal is shown.
Download figure:
Standard image High-resolution image
Figure 23. In-plane images of polymer layers joined by tetrapodal ZnO crystals covered with Au, simultaneously obtained in different microscopy modes: (a) scanning SHGM and (b) OCM.
Download figure:
Standard image High-resolution image4.3.2. Stretchable Polydimethylsiloxane-based devices.
Polydimethylsiloxane (PDMS) is currently under consideration to serve as basis for stretchable optical components. Depending on the degree of crosslinking, different elastic moduli can be realised. In another context, samples of PDMS have previously been investigated by SFG in order to monitor surface modifications caused by UV irradiation for an increase in hydrophilicity [92]. It was shown that the contribution of Si–OH groups after irradiation increased, whereas the peak intensities of CH3 and crosslinking CH2 groups simultaneously decreased. UV irradiation is now also being considered as one way to laterally structure the stiffness of the material used for the above mentioned envisaged optical parts, with SFG spectroscopy being a suitable method to directly monitor the changes. This is successfully demonstrated in the following on samples exhibiting different degrees of crosslinking. The elastic modulus of the PDMS material is optically accessible via the strength of the symmetric and antisymmetric CH3 stretch contributions in the spectral region between 2850 and 3000 cm−1, as shown in figure 24 for the ssp polarization configuration. In this example, the elastic modulus covers a range of nearly three orders of magnitude. With proper calibration curves, a quantitative evaluation seems now at hand. It is envisaged to extend this approach further, to alternative candidates and materials for stretchable devices.

Figure 24. SFG spectra in ssp polarization configuration of PDMS samples with different Young's modulus.
Download figure:
Standard image High-resolution image4.3.3. Anti-adhesion layers on different substrates.
With respect to the study of metallic substrates, thin films of an organosilane-based release agent on steel were studied. Such release agents are of interest for efficient de-moulding of fiber-polymer composite parts. However, they hamper adhesion and subsequent bonding processes of the de-moulded composite parts themselves. By minimizing the applied amounts of release agents (going in the direction of ultrathin films), it is expected to improve the bonding performance of the composite parts, and at the same time efficiently de-activate the metal surface of the mould. Initial SFG spectra of such release agent films (fabricated by dip-coating) were initially obtained on smooth reference glass surfaces. The spectra show the appearance of additional resonances of CH3-stretching vibrations from the methyl groups attached to silicon atoms at 2910 and 2964 cm−1 [92], besides the usually present CH2 and CH3 resonances at 2850, 2875 and 2937 cm−1, most probably stemming from surface contaminations containing hydrocarbons. The additional resonances of these organosilanes, presented on glass in figure 25, can now exclusively be detected on steel surfaces for moulding tools, which were treated with the release agent (figure 26). In such a way, SFG can serve as an ultrasensitive tool to study the formation and endurance of release agent films, and to determine the necessary amount and threshold for successful de-moulding.
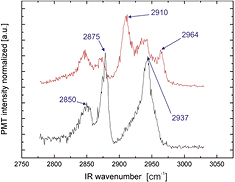
Figure 25. SFG spectra in ssp polarization configuration of a reference glass surface (black) versus a surface coated with a organosilane-based release agent (red). The wavenumbers of the individual resonances are indicated.
Download figure:
Standard image High-resolution image
Figure 26. SFG spectrum in ssp polarization configuration of a steel surface treated with the release agent, showing two resonances stemming from CH3 stretch vibrations of methylsilyl groups.
Download figure:
Standard image High-resolution image4.3.4. Monitoring of surface plasma cleaning.
In a last example for SFG spectroscopy, the effect of plasma cleaning of surfaces is introduced. As presented above for the glass reference samples, hydrocarbon contaminations in particular cannot be avoided in surfaces exposed to ambient conditions. In this context, a novel atmospheric plasma jet system was developed, which exhibits a low-temperature plasma flame also suitable for the treatment of delicate materials of any shape and size. The novelty is that solely liquid media can be used for plasma generation, and that even no carrier gas is needed. As shown in figure 27 again on the glass reference samples, the air plasma treatment only minimally decreased the amounts of contamination, visible by the symmetric stretch contributions of the CH2 and CH3 groups being present on the surface. By feeding solely water to the system for plasma generation, the amount of surface contamination is drastically decreased, which is directly detectable in the SFG spectrum of the water-plasma treated sample. This finding could also be confirmed by complementary XPS measurements on other materials. However, since XPS requires UHV conditions, it is not compatible with in situ studies of surface treatment effects during atmospheric plasma processing, as will be needed in future, when additional pre-cursors are included in the media in order to specifically functionalize the surfaces.
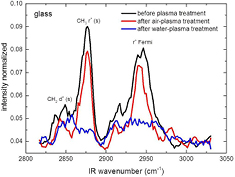
Figure 27. SFG spectra in ssp polarization configuration taken from an untreated and from plasma treated glass surfaces.
Download figure:
Standard image High-resolution image4.3.5. Organic coatings with embedded filler particles.
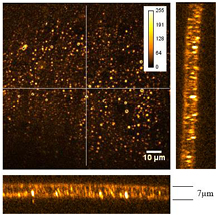
Following the above applications involving nonlinear signals due to the second order polarization, the focus is put in the last example on THG microscopy, in order to show that this method, which is used nearly exclusively in the field of life science, exhibits equal potential for characterization and inspection tasks of technical materials. Organic coatings, as applied e.g. on galvanized steel strips, represent complex systems involving many aspects from physics and chemistry, which determine the final properties with respect to hardness, elasticity, adhesion, resistance to detrimental environments, durability and optical appearance. In this context, the addition of specific filler particles influences gloss, opacity, hardness, scratch resistance, etc—and often provides, at the same time, a decrease in the cost of the paint. A key aspect is the homogeneous distribution of such filler particles, which needs to be assessed from time to time. As an example, calcite is a cost-effective mineral filler, which is currently widely used for this purpose. In contrast to, e.g. TiO2, calcite has a much lower refractive index—with a value close to those of organic coatings—making the particles hard to detect in conventional 3D optical microscopes. However, for THGM, the difference in refractive index and/or third order polarizablity is in general sufficiently high to provide a detectable signal, as demonstrated in figure 28 for calcite-filled polyvinylidene fluoride (PVDF) coatings. The point-like features represent single calcite particles embedded in the organic matrix. It is further known that the quality of the particle size distribution is not as high for calcite as e.g. for TiO2. Now, the high spatial resolution of THG microscopy, due to the small effective excitation volume and the use of adaptive optics, even enables distinguishing the sizes of the individual particles—which are in the micron range—and not just their overall distribution. Although this experiment was still carried out on free films in transmission geometry, adaptions and optimizations of the THG microscopy set-up should also enable measurements in reflection geometry with the THG signal backscattered from either other particles or the underlying metal substrate, in order to detect regions devoid of particles or areas of increased agglomeration, depending upon the paint formulation and overall coating process.
Figure 28. THG microscopy images of a free standing organic coating with a thickness of 7 μm; large image: in-plane view, smaller images: cross-sections in the x and y directions taken along the lines indicated within the in-plane view. Colour scale indicates the number of detected photons.
Download figure:
Standard image High-resolution image
5. Conclusion and outlook
In this work, we have presented an overview of several NLO techniques based on the second and third order polarizability, with special focus on tasks in non-destructive testing and for the characterization of non-biological materials. Besides a short overview of studies published to date, selected experimental case studies were performed in the frame of this work to highlight the potential for future use, and promote the application, of these methods. Summarizing, the following optical techniques were specifically presented: rotation anisotropy for second harmonic generation (RA-SHG), scanning second harmonic generation microscopy (SHGM), interferometric second harmonic generation microscopy (iSHGM), sum frequency generation vibrational spectroscopy (SFG-VS), as well as third harmonic generation microscopy (THGM) with embedded adaptive optics capability.
We have, in particular, demonstrated that such optical techniques can be joined, without restricting the main strengths of the individual methods, into single, combined experimental set-ups. The following advantages are at hand. (i) The number of optical devices and components, including such costly ones as light sources and detectors, is reduced by enabling several different optical configurations, either simultaneously or by minor and simple changes of the measurement set-up. (ii) The various optical techniques complement each other, compensating disadvantages and restrictions imposed by the individual ones. As an example, nonlinear processes require high power pump radiation that can lead to parasitic effects, like multi-photon luminescence. Nonetheless, due to the coherent nature of the nonlinear processes considered, the influence of incoherent parasitic light on the detection of the nonlinear signal can be suppressed by using e.g. interferometry, which guarantees that only the nonlinear coherent radiation is recorded. Another example involves also linear optical methods, as we demonstrated in this work for simultaneuous 3D imaging by optical coherence microscopy (OCM) and iSHGM on corrosion features. Equally, the investigation of polymer layers bonded by ZnO tetrapodal crystals shall be recalled. Here, the additionally applied linear OCM technique could acquire the overall sample structure and topography. Yet, OCM was not successful in the detection of the ZnO tetrapodal crystals, due to their low reflectivity, as was confirmed by comparative investigations of modified tetrapodal ZnO crystals covered with gold. Together with SHGM, the in-plane distribution of the tetrapods could finally (and simultaneously) be detected by taking advantage of the SHG activity of ZnO. However, in the above example, the exact distribution—or location—of the ZnO crystals between the two polymers is still not accessable by OCM. This is due to the fact that the interface between the polymers, having only slightly different indices of refraction, could not be detected. A solution might be found using THGM in the future, due to the high interface sensitivity of this technique, even if the linear indices of refraction are only slightly different, as seen in the example involving calcite particles within an organic paint matrix. Another example included the successful incorporation of RA-SHG capabilities in the SFG-VS set-up, which gave the opportunity to perform RA-SHG measurements at more than one wavelength in a straightforward way. (iii) Finally, the aspect of joining several methods includes especially significant savings in time for the characterization and analysis tasks.
From the results presented here, it is evident that the use of NLO methods provides useful and complementary information which can help to determine the true structure and composition of materials in a quick and non-destructive way. In any case, significant efforts have still to be made toward improvements, and more experience has to be collected in order to give useful recommendations for how to proceed along the path towards future reliable and information-rich material characterization, suitable to being carried out as a matter of routine. Besides combining several methods, it is obvious that with the further development of optical components, light sources and photodetectors on the one hand, and by considering the theoretical basis together with further advancements in data processing on the other hand, the range of applications of NLO techniques for material characterisation will continue to expand.
Acknowledgments
The authors would like to thank K Hingerl and H Hardhienata for discussions on the RA-SHG response in the frame of the SBHM, J Duchoslav for providing XPS measurements, T Plach for the preparation of plasma treated Si surfaces, J Stangl for determining the miscut of Si wafers by XRD, S Schausberger for preparing the PDMA material, and M J Booth for providing the THG microscope.
Financial support by the Federal Ministry of Science, Research and Economy and the National Foundation for Research, Technology and Development (Christian Doppler Laboratory MS-MACH) as well as by the Austrian Research Promotion Agency FFG under the scope of the programme 'Production of the Future' (Project SPOK) is gratefully acknowledged. RA and XJ gratefully acknowledge financial support by DFG in the framework of SFB 677.