

Abstract
In this paper, emission spectroscopy and fast imaging surveys during pulsed laser ablation in liquid (PLAL) for nanoparticles (NPs) production have been used, in order to provide further details about the process involved and the potentialities offered by a wire-shaped sample ablated in a flowing water jet. This kind of set-up has been explored because the laser ablation efficiency in water increases when a thin water layer and a wire-shaped target are used. In order to understand the physical processes causing the increasing ablation efficiency, both the laser-induced plasma and bubble dynamics generated in a flowing liquid jet have been analysed. The plasma parameters and the bubble behaviour in such a system have been compared with those observed in conventional PLAL experiments, where either a bulk or a wire-shaped target is immersed in bulk water. From the data presented here it is evidenced that the plasma and shockwave induced during the breakdown process can play a direct role in the ablation efficiency variation observed. With regard to the cavitation bubbles evolving near a free surface (the interface between water and air) it should be noted that these have to be treated with caution as a consequence of the strong influence played in these circumstances by the boundary of the water jet during its expansion dynamics. The effects due to the size of the liquid layer, the presence of the water/air interface, the liquid characteristics, the target shape, the plasma evolution and the bubble dynamics together with their outcomes on the NPs' production, are presented and discussed.
Export citation and abstract BibTeX RIS
1. Introduction
Laser induced plasma (LIP) in a liquid medium is gaining interest in technological fields spanning from medical applications to material production [1, 2] and chemical analysis [3].In particular, laser ablation for the production of nanostructures is developing rapidly for the numerous advantages it can provide, such as: eco-friendly methodology, simplicity of the experimental set-up and long stability of the produced nanoparticles (NPs) [1, 2]. This technique, namely pulsed laser ablation in liquid (PLAL) is based on the ablation of a target material submerged in a bulk liquid. The process has four different stages: laser matter interaction, plasma induction and its evolution, cavitation bubble dynamics and release of material into the liquid environment [4]. Nowadays, the main effort in this field is devoted to the development of experimental approaches which can improve the process in terms of NPs' quality, which are the particle size and size distribution, and especially, the yield of production (NP productivity) [5]. In particular, this last issue is important when NPs produced by PLAL are compared with those obtained by conventional methods such as gas phase or wet chemical syntheses. In PLAL the NPs' productivity depends on the selected experimental parameters and, in particular on the efficiency of the laser ablation process [6]. The efficiency issue has been widely studied in literature covering different research fields (e.g. laser drilling [7], micro-drilling [8], water confined laser propulsion [9], cutting-edge technologies [10] and erosion [11]). In these works, the employment of a thin water layer instead of air or bulk water has been investigated as a consequence of the possibility of increasing the laser ablation efficiency by decreasing the water layer thickness. The effect of liquid thickness on laser ablation efficiency is also reported in [12].
For instance, details about the increasing of NPs' productivity of PLAL due to the reduction of the liquid thickness can be found in [13], or, alternatively by using a liquid flow [14]. It should be highlighted that the use of a wire-shaped target immersed in water [15] can increase even more the laser ablation efficiency when a flowing water jet is used. This, in fact, provides better performances, than expected, as it has been recently demonstrated [16]. Taking this into account, a full survey of the process involved can provide useful pieces of information for understanding and controlling this promising PLAL configuration, so that new achievements for NPs' synthesis could be retrieved. It follows that fundamental aspects about the laser ablation process of a wire enwrapped by a thin water jet can supply details for further developments of this technique. It is known that the formation of NPs occurs in the plasma phase and that these are successively released within the bubble induced by the process of cooling of the plasma itself [4]. Therefore, the evolution of both the plasma and the cavitation bubble dynamics play a crucial role in the NPs' production. Consequently, in this work, we have surveyed, experimentally, the LIP and bubble dynamics occurring during the NPs' production performed in a water layer flowing as a jet and enwrapping a wire-shaped target. With this aim we have investigated by optical emission spectroscopy the evolutions of the plasma characteristics and the LIP parameters, as well as the laser induced cavitation bubble dynamics occurring in a water jet. For the latter high temporal resolved shadowgraphic images have been acquired. Hence, in this work we focus our attention on the phenomena occurring when a flowing water jet enwrapping a wire-shaped target configuration is used for PLAL. The main aim is therefore to clarify which are the effects induced, in these circumstances, by the plasma and the cavitation bubble dynamics. In particular, the process taking place near the boundary of the liquid jet, that is at the interface between the liquid and the external air will show singular behaviours such as the effects played by shockwave, due to the breakdown event, when it hits the water boundary edge. Then, when the generated bubble evolves inside a water jet that has a diameter in the order of millimetres, that is comparable to the bubble radius, the role of the boundary must be taken carefully into account. For cavitation bubbles evolving near boundaries different scientific papers dealing with theoretical and experimental approaches are present [17–20] as a consequence of their role played in severe structural damage occurring to ships' propeller blades, turbomachinery and hydraulic equipment. The first studies on this subject were directed to the cavitation bubble evolution happening near a rigid surface [18, 20], then, later ones accounted for its evolution near a free surface [18, 21–23]. For their similarity to the present case, these latter ones have been considered for surveying the phenomena related to the bubble dynamics observed in this work. In our experiments, different water layer thicknesses on the wire surface have been considered in order to evaluate the influence of the water boundary on the plasma and bubble dynamics when the distance between the bubble centre and the water boundary varies.
2. Experimental
The experimental set-up consists of a nanosecond Nd-YAG laser (Rofin RSM 100D, 1064 nm, 10 Hz and energy 8 mJ) and a 10 cm focusing lens (F = 6 Jcm−2) conveying the laser beam onto the surface of a wire immersed in a concurrent flowing water jet. The small water jet was realized using a water pump and a circular nozzle. It should be noted that, the focused laser spot hitting the target surface was just a few hundred microns in diameter so that the dependence of its deformation due to the thickness of the water layer could be neglected. Although, from a rigorous point of view, the elliptical deformation of the spot due to the cylindrical shape of the water jet should be considered, it does not affect the laser irradiance significantly as a consequence of the here employed range of distance between the water edge and the target, which is 1.1–2.5 mm. Figure 1 shows that the wire is co-axial to the water jet and it is completely enwrapped by it. The wire is continuously fed by a wire feeder build-in nozzle-module. For following the process dynamics, shadowgraphic snap shots were acquired by means of a Princeton Instruments ICCD PI MAXII equipped with a UV–Vis Nikkor lens arranged as the set-up of [15]. As it is shown in figure 1, the laser was focused perpendicularly to the wire surface and the shadowgraphic images were acquired along the x-axis perpendicularly to the plasma and bubble dynamics expansion direction.
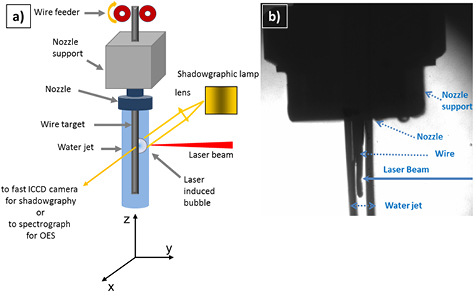
Figure 1. (a) Sketch of the experimental set-up with description of the different components and schematic illustration of the measuring method used in this work; (b) shadowgraphic image of the employed experimental set-up.
Download figure:
Standard image High-resolution imageOn the right-hand side of figure 1, a static shadowgraph of a water jet together with the contained wire target is shown. The dimension of the cylindrical water jet, which is regulated by a circular nozzle aperture, and its layer boundary are clearly visible, as well as the wire target placed inside it.
In figure S1 (stacks.iop.org/JPhysD/50/185204/mmedia) a scheme of the wire target inside a liquid jet is shown and the corresponding parameters used in this work are indicated. These are: Dwf = flowing water jet diameter (nozzle aperture),dlayer = distance between the edge of the water layer and the wire surface which is at a useful distance for surveying the bubble expansion dynamics, Rbubble = bubble radius, Dwire = wire diameter, V = water flow rate.
Moreover, varying the nozzle aperture it was possible to change the diameter of the water jet. In this experiment nozzle apertures of 1.6 and 4 mm have been used to vary the flowing water jet diameter Dwf and so dlayer (see figure S1). A further fine adjustment of dlayer has been realized changing the wire position with respect to the edge of the water jet and keeping a fixed nozzle aperture (see figure S1 (stacks.iop.org/JPhysD/50/185204/mmedia)). In all cases the actual dlayer has been measured directly by the shadowgraphic images.
The flow rate of the water can be varied as required. Two water flow rates of 6 ml s−1 and 12 ml s−1 were tested for the measurements. In these experiments, the first water flow rate was chosen to avoid water turbulences that ensures both a sufficiently laminar flow of the liquid and transparency of its inner part which is essential for performing reliable shadowgraphic investigations. As a matter of evidence the turbulences and perturbations inside the water flow can affect its transparency and definition of the shadowgraphs. On the other hand, the bubble front dynamics is similar at different water flow rates. In fact, its displacement is much faster than the water flow velocity and, as will be shown in section 3.2.3, the bubble front velocity in water is of 9 m s−1 along the y-direction, that is, one order of magnitude bigger than the hydrodynamic water flux (0.48 m s−1, z direction) chosen for the present experiments.
All the shadowgraphic images were acquired using the same laser parameters. During the experiments, only nozzle apertures, wire-shaped target positions inside the flowing water jet and wire dimensions were varied. For these experiments, either a silver or a tungsten wire of 750 µm and 500 µm in diameter were employed, respectively. The temporal resolved shadowgraph images were acquired, with gate widths of 50, 25 and 10 µs, in order to verify the bubble behaviour reproducibility as a function of the time.
For the optical emission spectroscopy investigations, a nanosecond Nd-YAG laser (Quantasystem, PILS-GIANT, 1064 nm, 10 Hz and energy 90 mJ) and an ARC 300i spectrograph equipped with 1200 and 300 g mm−1 gratings and coupled with the ICCD PI MAXII camera were used as the ablating source and the spectroscopic system, respectively. The emission of the plasma was collected by two spherical fused silica lenses (focal length 12 cm) in order to transport its 1:1 image into a fused silica bundle of 19 optical fibres (diameter of the bundle 600 µm). This was linked to the spectroscopic system through an adjustable micrometer slit (aperture 80 µm) assuring a resolution λ/Δλ of 5000. For the emission spectroscopy experiments the LIP was realized focusing the pulsed laser on the silver bulk target on which a water jet was continuously flowing. In order to provide a controlled thickness of the liquid stream onto the bulk target the nozzles were placed onto its surface, assuring, through the water flow rate, that the NPs' generated from previous laser shots were in any case transported away from the ablated spot area. The temporal evolution of the expanding plasma was acquired with a gate of 50 ns at different delay times. Higher temporal resolutions were also employed by using gate widths of 20 and 10 ns so that the need of checking the reproducibility of the plasma as a function of the time could be fulfilled. Finally, the radiometric calibration of the spectroscopic system has been performed by using an Ocean Optics DH-2000 UV–VIS–NIR calibration source.
For instance, figure 2(a) shows a TEM image of typical Ag-NPs obtained by PLAL performed with a wire-shaped target immersed in a small liquid jet of pure water, where the extracted size distribution is reported in figure 2(b). For this measurement, 5 µl of the colloidal Ag-NPs were dropped on a carbon-coated copper grid, dried in air, and imaged through transmission electron microscopy (TEM) by using a Philips CM12.
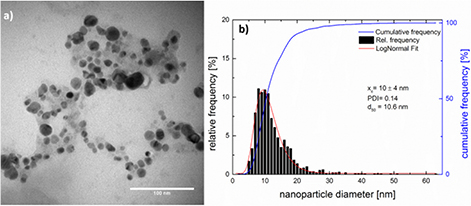
Figure 2. (a) Typical TEM image of Ag-NPs and their relative size distribution (b).
Download figure:
Standard image High-resolution image3. Results and discussion
When a laser pulse, with an irradiance higher than the breakdown threshold, is focused either in water or on a target immersed in it, both a plasma and a cavitation bubble are formed [15, 24, 25]. The laser induced breakdown produces shockwaves followed by the plasma formation and the expansion of this. The generated thin water vapour formed around the plasma border during its evolution, which is due to the fast energy exchanges occurring between the plasma and the water environment, triggers the formation of the successively observed cavitation bubble. Once this is formed, it expands, reaches a maximum of expansion and then begins to shrink until collapsing. When this occurs, a further shockwave is produced. Following the bubble collapse, rebound phases take place. Several bubble oscillations, in dependence of the initial laser energy, can be therefore induced. If the plasma and the cavitation bubble are generated in bulk water, which can be considered to be infinite, their dynamics will depend on the used experimental parameters such as laser characteristics (energy, pulse duration, focusing mode of the laser [2]), environmental characteristics (water temperature and pressure [25, 26]) and the shape, typology of the immersed target (i.e. bulk target or wire-shaped target [15, 27]). If the plasma and the cavitation bubble are generated in a liquid jet with a thin diameter (< 4 mm), possible interactions between shockwaves, plasma, bubbles and the boundary of the liquid jet must be taken into account. The results on the plasma and bubble dynamics produced on a wire-shaped target immersed in a water jet, as well as their interaction with the water boundary, are hereafter reported.
3.1. Plasma evolution
When a plasma is induced by a laser pulse in water, it expands supersonically driving a strong shockwave [24, 28]. Once the plasma is formed, it evolves like in a gaseous background, extinguishing itself after a certain period. The main differences occurring for LIP expansion in water or in gas are due to: (1) the exchange of energy with the background environment; (2) the strong spatial confinement of the expanding LIP in water that affects the occurrence of balances and competition between equilibrium and not equilibrium elementary processes sustaining the emitting plasma dynamics [4, 24].
In order to investigate the plasma characteristics and the LIP parameters evolution in a small water jet, the optical emission spectroscopy technique was used. In these experiments a bulk target with a water jet flowing on it (dlayer = 2 mm) has been employed. The use of a bulk target instead of a wire-shaped one was made in order to meet some experimental requirements. When a pulsed laser is focused on a wire it induces its oscillations [15, 27] as a consequence of the shockwaves produced by the laser induced breakdown. These shockwaves propagate towards the material on one side (inward shockwave) and through the liquid in the opposite direction (outward shockwave) [24]. The high pressure reached by the inward shockwave impacting on the target induces an oscillation of this if it is sufficiently thin, i.e. for a wire or a thin plate. Hence, these oscillations affect the resulting plasma emission detected during signal accumulations. By using a bulk target fixed on a suitable holder, such effects can indeed be avoided. Supporting this, it can be highlighted that, in a previous work, it was demonstrated that the plasma behaviour does not differ when a bulk metal target or a metal wire thicker than 750 µm, are ablated [15].
The emission spectra of LIP on Ag bulk target in a water jet acquired at different delay times (50, 500 and 1000 ns) and with a gate width of 50 ns are reported in figure S2(c) (stacks.iop.org/JPhysD/50/185204/mmedia). In the first observation the plasma lifetime is longer than that observed during the plasma generated for a bulk target immersed in bulk water volume.
In the present experiments, the plasma emission has been observed for more than 1 µs, whereas in [4], the LIP emission of Ti and Cu targets in large water volume, generated in similar experimental conditions, lasted for not more than a few hundreds of nanoseconds. Two main reasons can explain this finding: (1) the LIP induced on a bulk target on which a water jet is flowing (in this case dlayer = 2 mm) undergoes a smaller confinement effect compared with that induced in bulk water, as a consequence of the smaller water column against which the plasma expands; (2) since the emission has to go through a smaller column of liquid before being acquired, it follows that the absorbed fraction of plasma emission occurs to a smaller extent. However, as in the case of a plasma expanding in a large volume of water and, as observed in the present experiment, the continuum radiation always dominates all the acquired emission spectra (e.g. figure S2(c) (stacks.iop.org/JPhysD/50/185204/mmedia)). Although these spectra lack specific emission lines, it is possible to calculate the plasma temperature by assuming that each continuum spectrum follows a Planck-like distribution [29], as can be appreciated in figure S2(d) (stacks.iop.org/JPhysD/50/185204/mmedia). The Planck-like distribution plot is a method used to measure the plasma temperature [30–32] when the plasma emission is mainly dominated by the continuum radiation (e.g. when the LIP occurs in liquid). If no emission line is detectable, as a consequence of the high electron density which characterizes the LIP in water and where the confinement effect is very strong (see [4, 15, 29]), an estimation of the temperature and the electron density can be calculated through the continuum radiation. A detailed description of the physical processes and of the elementary mechanisms sustaining the plasma produced in water is given in [33]. The resulting temporal evolution of the plasma temperature and continuum intensity of LIP induced on an Ag bulk target in a water jet is reported in figure 3.
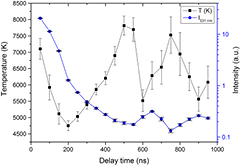
Figure 3. Excitation temperature and continuum intensity versus time behaviour of LIP on Ag bulk target in a water jet (dlayer = 2 mm, V1 = 6 ml s−1, F = 50 Jcm−2, gate width = 50 ns).
Download figure:
Standard image High-resolution imageBy observing the excitation temperature of figure 3, it is possible to suppose that the shockwave produced during the plasma formation, which has a velocity higher than that of sound in water, rapidly reaches the interface of the water layer (in this case 2 mm) and, after being back-reflected by this, a further reheating of the expanding plasma occurs. As a matter of fact, the excitation temperature of the plasma initially decreases with the delay time, as a consequence of both its expansion and exchange of energy with the surrounding liquid [4]. Nevertheless, this process keeps going until the back-reflected shockwave reheats the plasma. This can be confirmed by the observed increase of the temperature occurring after 200 ns and 600 ns. It means that the shockwave is back-reflected several times by the liquid border, which acts as a self-sustained reheating source of the plasma. Since for higher temperatures of the plasma a higher degree of ionization is expected, it follows that when the plasma temperature increases, a lower intensity of the plasma continuum can be observed and a higher ionization can be assumed, or otherwise, a decrease in temperature takes place. To strengthen this hypothesis, it should be noted that the main contribution to the continuum radiation is due to the process of radiative recombination. Consequently, the continuum intensity is proportional to the number density of atomic species, and therefore, when the temperature increases, the continuum intensity decreases due to a higher grade of ionization of the plasma.
It is important to underline that by measuring the plasma reheating time the laser-matter induced shockwave velocity can be evaluated. In this work, it is of the order of 5000 m s−1, which is in agreement with the data reported in the literature (see for example [34]).
3.2. Cavitation bubble dynamics
Before dealing with the laser induced cavitation bubble on a wire-shaped target inside a liquid jet, it is necessary to introduce, in order to better highlight any variation that is going to be detected, a summary of its dynamics when it is generated in a bulk of water.
After the extinction of the plasma a cavitation bubble takes place. As already described in [15, 16], the laser induced bubble on a wire begins to expand and wrapping the wire (the degree of wrapping depends on the wire diameter) approaches to a spherical shape. After reaching the maximum of expansion, it shrinks and, finally, a collapse is followed inducing a shockwave. After the first bubble collapse, a visible secondary bubble, which assumes a hydrodynamic shape, is induced. Then, this is pushed away from the wire with a speed inversely proportional to the wire diameter. Figure S3 (stacks.iop.org/JPhysD/50/185204/mmedia) shows the typical dynamics of a bubble induced on a wire target immersed in water. Decreasing the wire diameter, the ablation efficiency as well as the NPs' productivity increases [27, 35] favouring the release of the produced NPs into the solution [15]. On the contrary, by increasing either the wire diameter or using a bulk target the NPs productivity decreases as a consequence of the quenching of the mechanical release of the generated NPs into the solution [6]. In [35] the highest NPs' productivity occurred when the Ag wire with diameter equal to 750 µm was employed. For this reason, in this work, the Ag wire with such a diameter (Dwire = 750 µm) has been used.
NPs' productivity by PLAL can also be incremented by varying either the liquid layer thickness [13, 36] or using a liquid flow [14]. Therefore, if PLAL is performed on a wire-shaped target immersed in a small flowing water jet, a further increase of the NPs' productivity can occur.
Inducing a cavitation bubble inside a flowing water jet with a diameter in the magnitude of millimetres (1–2 mm) the bubble will expand towards the boundary of the liquid, which is the interface between the water layer and the surrounding air. The interaction of the cavitation bubble with a free surface has been studied for a long time both experimentally and theoretically [37]. When a cavitation bubble is induced close to a liquid boundary, it is known [17, 38] that its interaction with the free surface produces a 'microjet' which is a structure moving through the direction of the bubble centre. This gives origin to a 'counterjet', that is, a structure developing in the opposite direction of the liquid jet interface. In [38] the case of a laser induced bubble inside a liquid jet is described and schematized. It is analysed the importance of the position of the bubble centre and the maximum bubble radius with respect to the position of the boundary of the water layer. By changing the distance between the bubble centre and the liquid boundary, different bubble dynamics and interactions with the interface are observed. In the experiments presented in this work the cases of study are very similar, with the difference that a wire-shaped target is positened inside the liquid jet and a cavitation bubble is generated on the wire surface. As will be shown in the next sections by the shadowgraphic images, the bubble dynamics and the bubble interaction with a free surface will show results similar to those reported in [38]. This similarity can be retained even if the bubble shape is not completely spherical and the formed microjet is only interacting, with respect to the laser beam direction, with the wire rather than the opposite water boundary.
Figure 4 schematically represents the cavitation bubble dynamics near a free surface when it is induced on a wire immersed in a thin liquid layer. All the observed phenomena are due to the strong emission of shockwaves upon the bubble generation. If the bubble is generated at a distance from the boundary of the liquid jet bigger than the maximum radius of the bubble, the interface perturbation is weak, since the bubble expansion and collapse take place far from it. In this case, the first shockwave (i.e. the one produced by the laser induced breakdown) does not have important effects on the water interface, while the shockwave generated after the bubble rebound could interfere with it. Decreasing the liquid jet thickness means decreasing the distance between the bubble centre and the liquid boundary, the interaction between the bubble and the liquid interface is stronger and the phenomena reported in figure 4 take place. During the bubble expansion, a swelling of the water interface is visible, as well as, during the bubble collapse, the typical microjet and counterjets can be distinguished, as are schematically shown in figure 4(b).
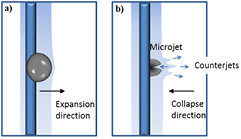
Figure 4. Sketch of a cavitation bubble induced on the wire target inside a liquid jet interacting with the water boundary, (a) during the phase expansion and (b) during the shrinking phase.
Download figure:
Standard image High-resolution imageConsequently, in this work, different dlayer have been taken into account, with the aim of evaluating the influence of the water boundary on the cavitation bubble dynamics when the distance between them is varied.
3.2.1. Effect of the water jet thickness with respect to the radius of the cavitation bubble.
In the first tested case, dlayer was varied either by shifting the position of the wire inside the water jet or using two different nozzle apertures. Temporal resolved shadowgraphic images of the laser-induced bubble on a 750 µm Ag wire-shaped target in a water jet are shown in figure 5. In this series, the dlayer is 2.1 mm and the maximum bubble radius measured (Rbubble−MAX) results of 1 mm.
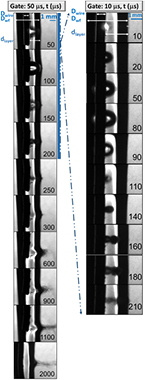
Figure 5. Temporal resolved shadowgraphic images of laser-induced cavitation bubble on an Ag wire-shaped target in a water jet (Dwire = 0.75 mm, Dwf = 4 mm, dlayer = 2.1 mm, V1 = 6 ml s−1, F = 6 Jcm−2, gate width = 50 and 10 µs).
Download figure:
Standard image High-resolution imageSince the dlayer is large enough with respect to Rbubble−MAX, the first expansion and collapse of the bubble occurs without any interaction with the liquid interface. In the inset of figure 5, the frames of the cavitation bubble occurring during the first 230 µs and acquired with a higher temporal resolution are shown. The typical evolution of a bubble induced on a wire immersed in water, without any interaction with the water boundary, is visible. When the second bubble oscillation takes place after the first collapse, which appears with the typical mushroom shape, a swelling or a spike begins to emerge through the liquid interface whose disruption (the breakdown of the water wall at the air interface) occurs after 1–1.5 ms (e.g. in figure 5). In this figure the counterjet rises after 200 µs, that is, after the bubble rebound where its effect on the water interface is quite moderate. By decreasing the dlayer until 1.1 mm (figure 6) and keeping fixed all the other experimental parameters, so that the bubble can be created very close to the liquid interface, the counterjet, which is composed only of a single jet, begins to appear already during the first bubble expansion (i.e. 50 µs, as shown in the inset of figure 6). After 200 µs it starts to reach the shape feature of a fork. In figure 6, the evolution of the counterjet at the liquid interface is clearly shown. At the same time, in agreement with [38], the microjet speed, that is directed in the opposite direction with respect to the counterjet (since it is a result of the force balancing of these components) increases and begins to emerge soon after the bubble creation. The formation of the microjet inside the bubble can be observed by the shadowgraphs of figure 6, in particular on the snapshots between 100 and 300 µs. In this case, the microjet impacts directly with the wire, as is clearly visible in figure 7, where a higher magnification of two frames of figure 6 are reported. These figures evidence the changing of the cavitation bubble shape which can be observed until the liquid interface disruption occurs, meaning after 1 ms. Then, the water wall breaks down to form a spray jet perpendicular to the water flux direction towards the laser pulse direction.
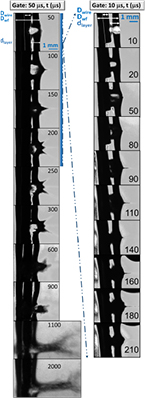
Figure 6. Temporal resolved shadowgraphic images of laser-induced cavitation bubble on an Ag wire-shaped target in a water jet (Dwire = 0.75 mm, Dwf = 1.6 mm, dlayer = 1.1 mm, V1wf = 6 ml s−1, F = 6 Jcm−2, gate width = 50 and 10 µs).
Download figure:
Standard image High-resolution image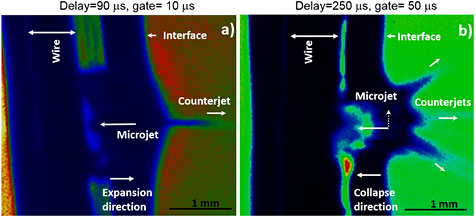
Figure 7. Two magnifications of frames of figure 6 which are referred to as temporally resolved shadowgraphs of laser-induced cavitation bubble on an Ag wire-shaped target in a flowing water jet for a delay time of 90 and 250 µs (Dwire = 0.75 mm, Dwf = 1.6 mm, dlayer = 1.1 mm, V1 = 6 ml s−1, F = 6 Jcm−2, gate width = 10 and 50 µs).
Download figure:
Standard image High-resolution imageFinally, if the dlayer is smaller than the maximum bubble radius, the expansion of the cavitation bubble reaches the water interface and, as shown in figure S4 (stacks.iop.org/JPhysD/50/185204/mmedia), a cloud-like structure emerges from the liquid jet. In particular, it can be hypothesized that the bubble remains trapped and oscillates for a long time between the wire and the liquid layer interface. This can be appreciated considering the water boundary swelling which persists for a long time before the boundary disruption, indicating that an air bubble is located between the wire and the water boundary. The lifetime of the bubble, in this case, does not last more than 400 µs. In figure S4(c) (stacks.iop.org/JPhysD/50/185204/mmedia) it is shown that the beginning of water boundary disruption occurs at 400 µs.
3.2.2. Effect of wire diameter.
In order to verify if the effect of the bubble interacting with the liquid free surface could be affected by the wire dimension, a wire diameter (Dwire) of 500 µm was additionally used, to compare the dynamics with the 750 µm wire. The effect of the wire diameter related to the ablation efficiency has been investigated in detail in [35], while the variation of bubble dynamics due to the decreasing of wire diameter has been investigated in [15]. Here, conversely, the effect due to different bubble dynamics is taken into account for studying the interaction between the bubble and the water interface. In [15] it was demonstrated that decreasing the wire diameters changes the bubble shape and dynamics. For instance, by decreasing the wire diameter the shape of the bubble becomes more spherical and the speed of the secondary bubble, moving away from the wire, increases. Recently, this 'pushing' phenomenon has been correlated to the elasticity (flexure strength) of the wire, which causes the so-called springboard effect [27], but maybe supported as well by the curved shape of the wire at the bubble's base. In figure 8 the temporal resolved shadowgraphs of laser-induced bubbles on a tungsten wire-shaped target in a flowing water layer, are shown. In this experiment the dlayer is 2.4 mm and, in agreement with the previous discussion, during the bubble expansion and collapse no evidence of interactions with the water boundary is detectable.
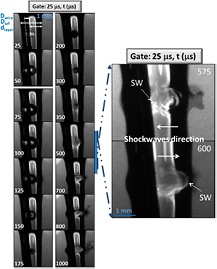
Figure 8. Temporal resolved shadowgraphic images of laser-induced cavitation bubble on a tungsten wire-shaped target in a flowing water jet (Dwire = 0.5 mm, Dwf = 4 mm, dlayer = 2.4 mm, V1 = 6 ml s−1, F = 6 J cm−2, gate width = 25 µs).
Download figure:
Standard image High-resolution imageAfter the collapse phase occurring at 175 µs, the secondary bubble is generated and begins to travel away from the wire surface until it reaches the water boundary with a bigger speed and a larger displacement [15, 16] with respect to the secondary bubble of the previous test case. Moreover, the shockwave induced on the target after the collapse and which travel in the opposite direction of the collapse, reaches the water edge. Once the shockwave reaches the water boundary it is back-reflected towards the wire and, successively, after hitting the wire it is back-reflected once more towards the water boundary so that a multi-reflection process is involved. Several shockwaves are, therefore, expected to be detectable in the shadowgraphic images reported until the disruption of the water boundary occurs. In these circumstances, the bubble and its interaction with the water boundary behaves similarly to the previous case where the water layer dlayer was thicker than the maximum bubble radius Rbubble−MAX, although, the secondary bubble displays a bigger speed and a larger displacement from the wire. When dlayer is decreased up to 1.5 mm (i.e. figure S5) (stacks.iop.org/JPhysD/50/185204/mmedia) the displacement and rebound of the secondary bubble does not take place at all, as a consequence of the trapping of the first bubble between the wire and the water boundary (i.e. figure S4 (stacks.iop.org/JPhysD/50/185204/mmedia) and related discussion).
It follows that, by decreasing the wire diameter the interaction between the bubble and the water boundary does not substantially change. In this context, it can be stated that the value of the dlayer affects mainly the process of interaction between the cavitation bubble and the free surface. Moreover, the disruption of the liquid boundary should be influenced by the surface tension of the water, therefore the effect due to the surface tension of the liquid on the bubble dynamics will be presented in the following paragraph.
3.2.3. Effect of water surface tension γ.
By changing the sur-facetension of a liquid, it is possible to change the bubble dynamics since the rate and the nature of its expansion and collapse can strongly vary [39]. Some studies have been performed on the role of the liquid surface tension influencing the cavitation bubble behaviour, in order to understand better the mechanisms of the cavitation bubble damage, as well as the erosion of a solid surface [40]. In this context varying the bubble dynamics by the liquid properties at fixed experimental conditions, additional information on the cavitation bubble and free surface interactions can be provided.
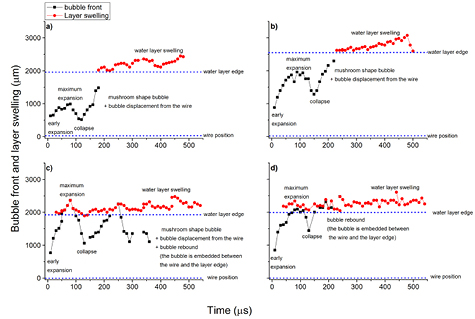
To change the surface tension of the used liquid, sodium dodecyl sulphate, SDS, at two different concentrations (1 g l−1and 2.5 g l−1, that are below and slightly above the critical micellar concentration, respectively) and bovine serum albumin, BSA, (2.5 g l−1) were added to water. Table 1 shows the calculated surface tensions based on [41] for the different experiments here performed. Figure 9 reports the different bubble front evolutions measured at different surface tensions evaluated by the inspection of the time resolved shadowgraphic images acquired. The bubble front is coincident with the bubble radius until the secondary bubble begins its displacement from the wire surface towards the liquid boundary taking place after the first bubble's rebound. Moreover, in order to highlight when the bubble front reaches the water jet edge which induces its swelling, the positions of the wire target and the water jet interface with respect to the bubble front are shown in figure 9 (dotted lines).
Table 1. Bubble expansion-collapse rates and surface tensions evaluated for the different performed experiments.
| Laser induced bubble on Ag wire in a flux of: | Surface tension γ (mN m−1) [41] | Bubble expansion rate: vexp (m s−1) | Bubble collapse rate: vcollapse (m s−1) |
|---|---|---|---|
| Water + SDS (2.5 g l−1) | 47 | 23 | 25 |
| Water + BSA (2.5 g l−1) | 55 | 15 | 19 |
| Water + SDS (1 g l−1) | 57 | 16 | 17 |
| Water | 74 | 9 | 13 |
Figure 9. Time dependent position of the cavitation bubble front and layer swelling of the laser induced cavitation bubble on Ag wire-shaped target in a flowing water jet of: (a) water, (b) water + SDS (1 g l−1), (c) water + SDS (2.5 g l−1) and (d) water + BSA (2.5 g l−1); (Dwire = 0.75 mm, Dwf = 4 mm, dlayer = 2 mm, V1 = 6 ml s−1, F = 6 Jcm−2, gate width = 10 µs).
Download figure:
Standard image High-resolution image
The bubble expansion and collapse rates reported in table 1 have been calculated by using figure 9. These have been calculated as the initial expansion and final collapse rates, respectively, where each of these holds constant values (e.g. before the rate undergoes a deceleration, in the case of expansion). By examining figure 9 and table 1 it is evident that decreasing the water surface tension gives an increase of the bubble expansion rate, so that the bubble front can reach the water jet edge before the collapse phase begins. Furthermore, the bubble collapse rate is always slightly larger than that of the expansion. In the same manner, it increases by decreasing the surface tension, even when, in the case shown in figures 9(c) and (d), the first bubble interacts with the water layer edge. In addition, it can be noted that the collapse time is always the same at the different water surface tensions employed in this work. Therefore, the water surface tension can influence the initial bubble expansion and final collapse velocities, although it does not influence the bubble lifetime. Since the forces against which the bubble must act are smaller, the rate of expansion and collapse of the bubble increases by decreasing the surface tension. Then, the maximum radius of the bubble is bigger when the surface tension of the liquid decreases. As a consequence, the maximum volume of the bubble gets bigger when the expansion and collapse rates increase, and so, the time employed by the bubble to expand and collapse remains the same although different surface tensions of the water are used. It can be concluded that, for the experiments here performed, the lifetime of the bubble in liquid having different surface tensions stays constant because, in any case, the laser energy delivered is comparable for all the conditions here explored. This means that also in this case only the dlayer, rather than the Rbubble−MAX, plays a key role during the interaction between the generated bubble and the water surface edge.
3.3. Perspectives of plasma and bubble dynamics effects during PLAL on a wire-shaped target wrapped in a water jet for NPs' production
Concerning the ablation process mechanism, as it has been discussed in the previous section, the multi-reflections of the shockwave produced by the breakdown followed by the plasma formation and plasma reheating can be directly related to the increasing of the ablation rate when the thickness of the flowing water layer is reduced. It has been already demonstrated [12, 13, 42], that by decreasing the water layer thickness the laser ablation rate increases until a certain threshold value is reached. Below this, the ablation rate decreases. By reducing the water layer thickness the number of multi-reflected shockwaves raises so that a certain number of backward shockwaves hit the wire, even if each of them loses energy after its reflection. These backward shockwaves hit the wire with a very high value of pressure peak (e.g. 100 MPa for the first breakdown shockwave, as it is reported in [24]). This can act as an 'ablative piston' [43, 44] and, therefore, a high number of backward shockwaves may definitely increase the final amount of the mass of the ablated material. However, if the water layer thickness is reduced below a certain threshold, that is near the maximum LIP volume expansion, an explosion in the water layer itself can be induced once the border of the water is reached. This phenomenon immediately stops the multi-reflection of the shockwaves, preventing the increase of the ablation rate. In addition, if the expanding plasma takes place in air instead of water, that is, when the liquid layer is very thin, there will be a random dispersion of the produced material into the workplace. Since the ablation rate during the PLAL in liquid is usually associated to the yield of produced NPs, it means that the NPs will be lost rather than be retained in the liquid medium. Therefore, the NPs' productivity can be correctly considered to be proportional to the ablation rate only if the water layer is not destroyed during the plasma expansion. A recent paper [16] deals with the NPs' characteristics produced by PLAL performed on a wire-shaped target enwrapped in a liquid jet. An increase of NPs' productivity was observed for both points of view: (1) the increasing of the ablation efficiency due to the thin water layer and the wire-shaped target; (2) the efficient transport of the generated NPs thanks to the presence of the liquid flow.
In this context, a cavitation bubble, that further expands when the plasma is already extinguished, does not play any important role on the laser matter interaction and, consequently, on the ablation process mechanism (at low pulse repetition rates allowing the temporal bypassing of the bubble). On the other hand, the bubble dynamics can instead be relevant for the final NPs' size distribution and eventually for the aggregation process of these [45], since, in dependence of the dlayer employed, the shockwave's multi-reflections induced by the bubble collapse can take place.
4. Conclusions
PLAL can provide a continuous source of NPs production if a perfectly matched restored target supplier, such as a wire feeder, is used. The same assessment is valid for liquid flow set-ups, such as a liquid jet which does not require any entrance window or coverage.
The effect of different experimental parameters during PLAL for noble metal NPs' formation have been studied for improving the knowledge about the PLAL process occurring in the experimental configuration used here. They are: target wire dimension, water layer thickness and surface tension of the liquid.
In this frame the plasma role has been investigated by optical emission spectroscopy while the cavitation bubble dynamics and its interaction with the liquid surface have been studied by fast shadowgraphic techniques. The results have been rationalized in order to give a complete overview of the PLAL process when the target wire in a limited liquid jet is used. The outcomes have led us towards the following observations: shockwave's multi-reflections induced by the breakdown reheating plasma take place; the distance between the bubble centre, with respect to the water boundary (free surface), affects mainly the process of interaction between the cavitation bubble and the free surface; the decreasing of the wire diameter does not substantially concern the interaction between the bubble and the water boundary; the water surface tension influences the bubble dynamics by varying the initial expansion and final collapse rates, although it does not have any influence on the bubble lifetime. These phenomena can explain the reasons for the increase of the laser ablation efficiency when the water layer thickness is reduced. In these circumstances, the number of shockwaves reheating the plasma rises leading to an increase of the total amount of the mass of the ablated material. Finally, since the role of the cavitation bubble can be critical for the final NPs' size distribution and, eventually, for their process of aggregation, the bubble dynamics with respect to the water boundary surface must be considered. In particular, the distance between the target and the water boundary must be finely chosen, according to the specific process requirements.
As a perspective in PLAL applications, it can be concluded that the experimental approach here presented can be suitable for enhancing the efficiency of the ablation process by selecting the optimal water layer thickness and diameters of the wire-shaped target.
Finally, since the lifetime of the whole process, occurring in the set-up used here, lasts about 3 ms, it follows that all considerations presented can be representative for laser repetition rates lower than 333 Hz. In fact, by operating at higher laser repetition rates the process can display different behaviours as a consequence of the occurrence of temporal and spatial overlapping between subsequent laser induced cavitation bubbles.
This survey can provide new pieces of information to the scientific community in order to control the NPs' yield of production and exploiting the advantages of this technique for further developments of PLAL in the real world, such as material science, analytical, engineering and medical applications. Therefore, this fundamental study can be utilized in order to improve general knowledge about the laser ablation in liquids technique and its further developments.
Acknowledgments
The authors (SK, SB and PW) acknowledge financial support from the German Federal Ministry of Education and Research (BMBF) within the young investigator competition NanoMatFutur (projekt INNOKAT, FKZ 03X5523).