

Abstract
A gliding arc plasmatron (GAP), which is very promising for purification and gas conversion, is characterized in nitrogen using optical emission spectroscopy and high-speed photography, because the cross sections of electron impact excitation of N2 are well known. The gas temperature (of about 5500 K), the electron density (up to 1.5 × 1015 cm−3) and the reduced electric field (of about 37 Td) are determined using an absolutely calibrated intensified charge-coupled device (ICCD) camera, equipped with an in-house made optical arrangement for simultaneous two-wavelength diagnostics, adapted to the transient behavior of a GA channel in turbulent gas flow. The intensities of nitrogen molecular emission bands, N2(C–B,0–0) as well as  (B–X,0–0), are measured simultaneously. The electron density and the reduced electric field are determined at a spatial resolution of 30 µm, using numerical simulation and measured emission intensities, applying the Abel inversion of the ICCD images. The temporal behavior of the GA plasma channel and the formation of plasma plumes are studied using a high-speed camera. Based on the determined plasma parameters, we suggest that the plasma plume formation is due to the magnetization of electrons in the plasma channel of the GAP by an axial magnetic field in the plasma vortex.
Export citation and abstract BibTeX RIS
1. Introduction
There exist two types of atmospheric pressure plasmas, namely thermal (equilibrium plasmas) and non-thermal (non-equilibrium plasmas), which both have a wide range of industrial applications. Thermal plasmas, like arc discharges, with gas and electron temperature (Tg, Te) of about 104 K, are very dense, with electron density higher than ne > 1016 cm−3, and are sustained by thermal collisional excitation and ionization. In contrast, the gas temperature of non-thermal plasmas, like glow discharge, corona and dielectric barrier discharge, is usually considerably lower than Tg < 1000 K and differs strongly from the electron temperature (about 2 × 10⁴ K). The total electron density of non-thermal atmospheric pressure plasmas is less than ne < 1014 cm−3, but with a considerable part of high energetic electrons, involved in electron impact dissociation, ionization, etc, which chemically activate the working gas mixture and sustain the steady-state plasma conditions. Both plasma types (thermal and non-thermal) have their own advantages and disadvantages when used in industrial processes [1–6]. For some applications, an intermediate plasma type with medium electron density 1014 cm−3 < ne < 1016 cm−3 causes interest. These plasmas exhibit an elevated gas temperature of Tg = 1000 K–3000 K, which is considerably lower than the electron temperature of Te = 104 K–1.5 × 10⁴ K, and a higher electron density than conventional non-equilibrium plasmas. The most known examples of such discharges, which are studied and optimized for various industrial applications, are microwave discharges and gliding arcs (GA) [7, 8].
A conventional GA is sustained between two horn-shaped electrodes with minimal interelectrode distance near the gas flow inlet. The arc is self-initiated at this narrowest gap. Usually after ignition, the plasma filament travels along the diverging electrodes upwards, which is forced by gas flow and convection. When the distance between the electrodes becomes too large for the arc to sustain, it extinguishes, and a new arc is initiated at the narrowest gap, thereby forming a consistent, iterative operation of the device. Under specific conditions (see [9]), the GA discharge in air can be ignited before the previous single discharge extinguishes. The emission from the plasma column can pulsate with twice the frequency of the applied AC power supply. A non-thermal GA plasma is characterized by relatively high electron temperature (Te > 1 eV), high plasma density (in the range of ne = 1014 cm−3–1016 cm−3), and a moderate gas temperature (Tg = 1000 K–3000 K) [10–13]. Despite the high effectivity of conventional GA reactors in various applications, like gas conversion [14, 15], they suffer from some important problems, namely the flat geometry, which limits the gas conversion effectivity, and overheating of the electrodes that causes erosion of the metal surface, thereby limiting their lifetime [16–18]. Partially these problems of conventional GA applications were solved by turbulent gas flows and by using water cooled electrodes [19, 20].
In this paper, the combination of GA and vortex gas flow is addressed. For this setup, a similar problem as mentioned above [17] has to be solved to improve the efficiency of gas conversion [21, 22]. Both forward- and reverse-vortex flows are applied in this so-called GA plasmatron (GAP) [17, 21, 22]. The swirl generator, which usually contains six tangentially oriented inlets, produces a vortex gas flow along the reactor tube and isolates the hot plasma channel from the walls, improving heat loss and reactor efficiency. It was investigated in [17, 18] that plasma stabilization by reverse-vortex gas flow is more effective, and yields higher CO2 conversion [21]. In this GAP, the swirl generator is on the same side as the gas outlet. The plasma channel is confined within the inner flow, where heat transfer to the wall is strongly reduced, but the energy efficiency and ionization degree are increased [18, 23]. Moreover, gas mixing and thus, gas conversion is improved [17, 21, 22].
Although the GAP is promising for gas conversion, the physics of this discharge is not yet fully understood and needs additional theoretical and experimental studies. Low pressure diagnostic methods, namely electric [24, 25] or multipole resonance [26, 27] probe measurements, which provide information concerning electron density and electron energy distribution function (EEDF), cannot be used to characterize micro transient atmospheric pressure discharges, like the GAP, because of the very small dimension of the active plasma volume and the high electron and gas densities. High-speed photography, planar laser-induced fluorescence and optical emission spectroscopy were applied to characterize the conventional gliding arc in air [9]. A combination of Rayleigh scattering, OES and numerical simulation were applied for the determination of translational, rotational and vibrational temperature, and different temperatures were established [28].
To characterize a GAP operated in nitrogen flow, a particular optical arrangement is applied in the present study, which helps to measure separately and simultaneously the spatially resolved intensity distributions of two nitrogen emission bands. These distributions are used to characterize the plasma plumes formed in the plasma channel. Plasma plumes are plasma objects with larger diameter and higher emission intensity inside the GAP plasma channel. In principle, the position of the plasma plume in the GAP depends on the gas mixture, gas flow and electric current [23] and can reach the surface of the metal electrodes. In this case, the electrode material is overheated and vaporized. A plasma spot with metal plasma is produced. The plasma conditions in the presented study are chosen to guarantee the formation of a plasma plume approximately in the middle of the GAP plasma channel without contact to the electrodes. The formation and temporal behavior of the plasma plumes are investigated using a high-speed camera. In addition, the images of the plasma plumes (separated in two wavelengths) are focused simultaneously on the intensified charge-coupled device (ICCD) chip. The measured intensities in combination with numerical simulation are used to determine the spatially resolved electric field and the electron density within the frame of a collisional–radiative model.
2. Methodology and experimental setup
2.1. Diagnostics method
For the determination of the electron density (ne) and the reduced electric field (E/N), molecular nitrogen photoemission is used. The emission spectrum of nitrogen under elevated pressure conditions consists of two intensive emission systems, namely the second positive system (N2(C–B)) and the first negative system ( (B–X)), whose excited states have very different energy levels, namely 11.05 eV and 18.74 eV, respectively. Therefore, the emission spectrum of nitrogen plasma is very sensitive to variations in shape of the EEDF. Cross sections for electron impact excitation of excited states of nitrogen (σexc(Ekin)) are well known [29–31]. Therefore, nitrogen is often applied as a test gas by optical emission spectroscopy (OES) characterizations of low and elevated pressure plasmas [32–34].
The scheme of relevant energetic levels, and their corresponding electron impact excitation transitions applicable for OES diagnostic in active nitrogen plasma, is shown in figure 1. According to figure 1, under elevated pressure plasma conditions, the molecular states N2(C) and  (B) can be excited by direct electron impact of nitrogen ground state N2(X) and stepwise electron impact excitation via metastable N2(A) and ground state of nitrogen ions
  (X). In addition, the N2(C) state can also be excited in an 'energy pooling reaction' (1)

with rate constant of kp = 3 × 10⁻¹⁰ cm3 s−1 [35]. The excitation rate of N2(C) by pooling reaction (1) in the active plasma volume is usually much lower than the rate caused by electron impact. Therefore, the pooling reaction will be neglected.

Figure 1. Scheme of energetic levels of N2 and  (horizontal solid lines) and electron impact excitations (solid arrows) which are relevant for the OES diagnostic of nitrogen plasma. Dashed arrows present photoemission transitions applied by OES.
Download figure:
Standard image High-resolution imageThe intensities of the vibrational bands N2(C–B,0–0) and  (B–X,0–0) can be calculated using equations (2) and (3)


Square brackets in equations (2) and (3) mark the densities of the species, top and sub-indices at the rate constants (k) represent molecular states before and after electron impact excitation, respectively, and ne is the electron density. The branching factor B1 = 0.5 represents the relative population of vibrational level v' = 0 of excitation of N2(C) by electron impact excitation of N2(A). The branching factor B2 = 0.5 represents the Einstein coefficient of the N2(C–B,0–0) transition with respect to the total probability of photoemission from level N2(C,v' = 0), estimated in [32, 36]. The quenching factors,  and
and  , are calculated after equations (4) and (5) using known Einstein coefficients (
 ,
,  ) of the respective emission transitions, N2(C–B) and
  (B–X), and the rate constants of collisional quenching in nitrogen plasma,
  and
and  , adopted from [37]

The rate constants, used in equations (2) and (3) are calculated using the known cross sections of electron impact excitations (σexc(Ekin)) [29–31] and a simulated electron velocity distribution function (EVDF). Under elevated pressure conditions, the EVDF differs strongly from Maxwellian and a reliable electron temperature cannot be determined. The EVDFs are determined by numerically solving the Boltzmann equation for nitrogen plasma and for different reduced electric field values. For this purpose, the program code 'EEDF' developed by the group of Napartovich [38] is used. The EVDF in kinetic energy scale (fv(Ekin) in eV−3/2) and the electron drift velocity (in cm s−1) are simulated. The EVDF is normalized to fulfill equation (6) and the rate constants for electron impact excitations are calculated after equation (7),

where Ekin is the kinetic energy of an electron, me is the electron mass, and the coefficient C = 1.602 × 10⁻¹² g · cm2 · s−2 · eV−1. Equation (3) contains the unknown density of  ions ([
 (X)]). Positive ions in nitrogen plasmas under elevated pressure conditions are mostly two and four atomic. The low partial density of neutral atomic nitrogen under atmospheric plasma conditions, because of the high chemical activity, and the relatively low cross section of electron impact ionization, cause a low density of monoatomic nitrogen ions [39]. In the assumption of plasma quasi-neutrality, the electron density is equal to the sum of the densities of molecular ions.
  ions are produced in three-particle reactions of
  ions (8). The lifetime of
  ions at elevated pressure depends on electron density (9).


The rate constants of reactions (8) and (9) are known as k8 = 5 × 10−29 × (300 K/Tg)1.67 cm6 s−1 [40] and k9 = 2.6 × 10⁻⁶ cm3 s−1 [41]. Therefore, under steady state conditions and in the assumption of quasi-neutrality, the density of  ions is proportional to the electron density (10).

The coefficient K(ne,Tg) depends on the gas temperature and the electron density. Under plasma conditions with high gas temperature and electron density, the term K(ne,Tg) is much smaller than 1. In the first approximation, the influence of the [ ] density is neglected in the presented study. The reliability of this assumption is discussed below. Therefore, we start the plasma characterization in the context of the simplified model that can be presented by equations (2) and (11)

Equations (2) and (11) form a system of non-linear equations depending on the electron density ne. This system has two solutions, which can be interpreted in the following way: similar intensities of N2(C–B) and  (B–X) emissions can be excited under two different conditions, namely by a low electric field and high electron density, or by a high electric field and low electron density. This ambiguity of the OES diagnostic is solved using the rotational distribution in emission spectra of neutral and ionized nitrogen molecules [42]. The population of rotational levels of neutral nitrogen molecules in ground state under elevated pressure plasma conditions corresponds to the gas temperature, because of effective rotational relaxation. In contrast,
  ions are accelerated in the electric field of the plasma. After collisions with neutral ambient molecules, the population of rotational levels of diatomic ions corresponds to a higher temperature. Due to the low electron mass, the rotational distributions of molecular states are not influenced by electron impact excitation. If both nitrogen molecular emissions (neutrals and ions) are excited from the ground state of the neutral molecule (N2(X)), the rotational temperature in the emission spectrum of ions (
 (B–X)) should be very similar to the rotational temperature for the emission of neutral N2(C–B). These conditions correspond to 'direct' electron impact excitation followed by photoemission, namely high electric field and low electron density. When the
  (B) state is excited by electron impact from the ground state of the positive ion
  (X), the rotational temperature of the emission spectrum of ions should be higher than the rotational temperature of neutrals [42]. Such plasma conditions correspond to 'stepwise' excitation followed by photoemission, namely low electric field and high electron density. The rotational structure of the nitrogen emission spectrum was successfully used for the solution of this ambiguity problem of OES diagnostic in [43].
2.2. Experimental set-up
The GAP operating in a pure nitrogen flow is characterized in the present paper using optical emission spectroscopy with spatial resolution (see figure 2). The GAP was developed in [17]. The gas flow enters tangentially into the outer cylindrical vessel where a preliminary swirl is produced. A secondary swirl with much higher velocity is produced inside the hollow cathode and the outlet tube that is used as anode. The gap between the end of the anode tube and the cathode on the middle of the reactor amounts to 3 mm. Stainless steel electrodes are used in the present experiment. The anode diameter and length of the tube are 7.08 mm and 16.03 mm, respectively. The GAP is operated in a nitrogen flow of 10 slm with a purity of 99.999% and a total electric current of 230 mA DC. Based on CO2 flow simulations for this GA plasmatron, presented in [23], we assume that the rotational speed in the anode tube amounts to 700 revolutions per second under our experimental conditions. It was also supposed in [23] that local oscillations in flow speed cause the formation of micro-vortices by turbulent gas flow through the plasma reactor.
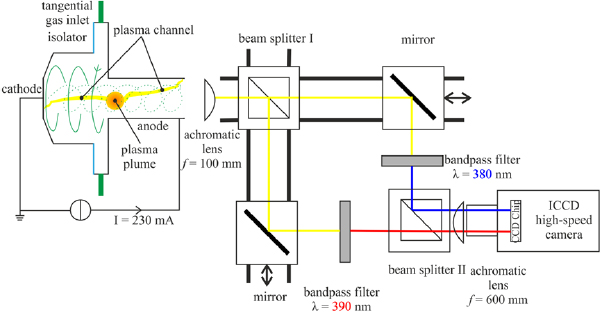
Figure 2. Scheme of the experimental set up for OES characterization of the transient µ-discharge in the GAP (left side) with spatial and temporal resolution, applying the simultaneous two-wavelength diagnostics (right side) (see text). Both the plasma channel and plasma plumes in the GAP are illustrated. Plasma plumes are characterized by considerably higher intensity of photoemission and elevated diameter compared to the plasma channel.
Download figure:
Standard image High-resolution imageAs shown in [23], the plasma channel rotates together with the plasma plume within the anode tube. To characterize this transient discharge, we use an optical arrangement that consists of two optical beam splitters, two band-pass filters and two mirrors in combination with an ICCD camera (see figure 2). Using this optical scheme, two discharge images for N2(C–B) and  (B–X) molecular emissions are displayed simultaneously and separately, on the CCD chip of the camera. A UV enhanced ICCD camera (4 Picos. Stanford Computer Optics. Germany) is used for this study. The exposure time of the camera can be varied from a minimum of 200 ps to 1000 s. The chosen exposure time in our experiment is 3.5 µs, based on a sufficient measured signal. To obtain the spatial distribution of N2(C–B) and
  (B–X) emissions, a band-pass filter with the transmittance at either 380 ± 5 nm or 390 ± 5 nm (Thorlabs GmbH. Germany) is aligned respectively with two achromatic lenses to receive a high spatial resolution. At this condition, the pixel length amounts to 30 µm.
An echelle spectrometer (ESA 4000, LLA Instruments. Germany) is used to determine the gas temperature in the plasma and for the calibration of the ICCD camera. This spectrometer is absolutely and relatively calibrated using a tungsten ribbon lamp and a deuterium lamp as secondary standards [44]. Both light sources were calibrated by PTB (Physikalisch Technische Bundesanstalt. Germany). The spectrometer provides a spectral resolution of 0.015–0.06 nm in the range of λ = 200–800 nm. A point-like microwave plasma is used for the absolute calibration of the ICCD camera with the simultaneous two-wavelength diagnostics arrangement. The point-like microwave plasma source is ignited with a nitrogen flow of 5 slm at atmospheric pressure. The absolute intensities of N2(C–B,0–0) and  (B–X,0–0) are measured for this point-like source using the echelle spectrometer. At the same time, images of this point-like plasma are recorded using the ICCD camera with the simultaneous two-wavelength diagnostics arrangement. From the measured absolute intensities of nitrogen bands of the point-like source, the ICCD camera is absolutely calibrated simultaneously with both filters.
To determine spatially resolved emissions from N2(C,0) and  (B,0), the band-pass filters λ = 380 ± 5 nm and λ = 390 ± 5 nm are used. Emission bands, namely N2(C–B,0–2) at λ = 380.5 nm and
  (B–X,0–0) at λ = 391.4 nm, are selected. These wavelengths are chosen based on the intensity distribution in the emission spectrum of nitrogen, the transmission of the applied optic and the sensitivity of the ICCD camera. For the purpose of plasma characterization, absolute intensities of emission bands of N2(C–B,0–0) at λ = 337.1 nm and
  (B–X,0–0) are required. The relation between the intensities of N2(C–B,0–0) and N2(C–B,0–2) bands corresponds to the Franck–Condon factors of these transitions, which are independent of the plasma conditions, and the probabilities of excitation and de-excitation processes for the N2(C,0) level. This relation is automatically included in the calibration factor.
The gas temperature in the GAP plasma channel is determined by using the rotational distribution in the emission spectrum of the N2(C–B,0–0) vibrational band, under the assumption that the translational and rotational degrees of freedom in the ground state of the nitrogen molecule (N2(X)) are in equilibrium, because of the high collisional frequency under atmospheric pressure conditions and the long enough lifetime of these molecules in the plasma volume. Electron impact excitation of diatomic molecules is limited by the selection rule ΔJ = 0, ±1. Therefore, the rotational distribution in the excited molecular state is approximately equal to the rotational distribution in the ground state of the molecule [45]. The emission spectra measured with the echelle spectrometer are compared to the spectra of molecular nitrogen, which are simulated for different rotational temperatures, using the program code developed by Behringer. The gas temperature is determined by a fitting procedure.
2.3. Methodology of plasma characterization
As mentioned before, the electronically excited states of nitrogen, including N2(C) and  (B), are quenched by collisions with ambient nitrogen molecules. This effect is included in the plasma chemical model by characterization of the plasma conditions (equations (2), (3), (4) and (5)). The influence of the high gas temperature in the GAP plasma channel on the efficiency of the quenching process is considered and the rate constants for collisional induced deactivation of electronically excited nitrogen states are substituted in equations (4) and (5) in Arrhenius form.
To simplify the applied plasma chemical model of the GAP, we compare the rotational temperatures of neutral and ionized nitrogen molecules (see section 2.1). The measured rotational temperature of the  (B–X,0–0) vibrational band amounts to Trot = 6200 ± 100 K, which is visibly higher than the rotational temperature of neutral nitrogen of Trot = 5500 ± 100 K, presented in figure 3. Based on this result, we conclude that for the GAP plasma conditions the
  (B) state is excited mainly by electron impact of
  (X) (stepwise excitation) and equation (11) can be simplified to equation (12)
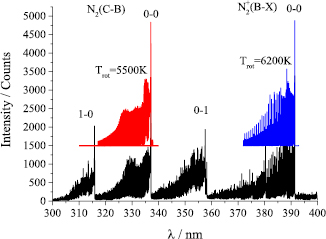
Figure 3. Emission spectrum of nitrogen plasma measured in the GAP. The N2(C–B,0–0) (red) and  (B–X,0–0) (blue) vibrational bands are simulated and fitted to the measured ones (see text). The simulated spectra are shifted for clarity.
Download figure:
Standard image High-resolution imageA combination of equations (12) and (2) offers the possibility to separately determine the electric field and the electron density in the GAP. For this purpose, we measure the intensities of photoemission of neutral and ionized nitrogen  and
and  respectively, and determine the ratio of the excitation rate constants (see equation (13)), that is a function of the reduced electric field (E/N)
Applying the measured gas temperature, the nitrogen density in the GAP plasma channel is evaluated based on the ideal gas law. The electron density is determined using the measured intensity of nitrogen photoemission  , the reduced electric field and equation (14)
To determine the reduced electric field in our experiment, we simulate the EVDF in nitrogen plasma using the Boltzmann solver 'EEDF' [38] (see section 2.1) for different electric fields. The rate constants for the electron impact excitations are calculated using all these EVDFs, the known cross sections for electron impact excitations and equation (7). Using equation (15), the reduced electric field values are evaluated as a function of measured intensities of nitrogen emission. Equation (16) is applied by calculating the probability of electron impact excitation for the nitrogen N2(C–B,0–0) emission. Functions (15) and (16) are calculated for the chosen E/N values and then fitted with polynomials. These are applied by automatic analysis of the measured spatial distributions of nitrogen molecular emissions (see figure 4) for the determination of the electron density and the reduced electric field (see figure 5).
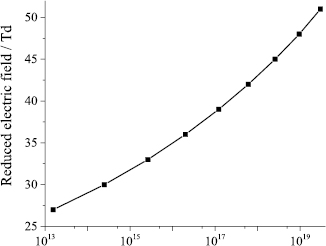
Figure 4. Calculated reduced electric field in nitrogen plasma (E/N) as a function of excitation rate constants for nitrogen emission according to equation (15).
Download figure:
Standard image High-resolution image
Figure 5. Calculated probability of electron impact excitation followed by N2(C–B) photoemission (see equation (16)).
Download figure:
Standard image High-resolution imageThe radial distribution of the plasma parameters in the GAP is determined by applying the inverse Abel transformation [46]. The radial distribution of nitrogen molecular bands is attained with spatial resolution of 30 µm × 30 µm × 30 µm. Before applying the inverse Abel transformation, several randomly selected images of both nitrogen emission bands in two perpendicular directions are chosen. By inserting the measured gas temperature, the calculated quenching factors, and the nitrogen densities, and by applying the polynomial approximation of the ratio of the measured intensities (presented in figure 4), the reduced electric field is calculated in each pixel. Afterwards, these values are used to calculate the excitation rate constants of N2(C–B) photoemission, applying the correlation presented in figure 5 and equation (16). The radial distribution of the electron density in the GAP is determined using the measured intensity of N2(C–B) emission, the calculated quenching factors, the nitrogen density and the rate constants for electron impact excitations, namely the probability of electron impact excitation (see figure 5).
2.4. High-speed photography
The temporal behavior of the plasma channel and plasma plume(s) in nitrogen turbulent flow is studied using the high-speed camera Phantom SpeedSense 341 (Dantec Dynamics). The maximum sensor resolution of this camera amounts to 2560 × 1600 pixels at a frame rate of 800 Hz and a maximum frame rate of 500 kHz at lower sensor resolution. The camera settings are matched for a reliable study of the temporal behavior of the rotating plasma channel in the GAP. Since the rotational speed of the plasma channel depends mostly on the anode diameter and the feed flow rate, the camera frame rate of 5.6 kHz is selected for an image resolution of 592 × 592 pixels. In our study, these parameters are chosen for an anode diameter of 7.08 mm and a nitrogen flow rate of 10 slm. Similarly, the exposure time of the detector is optimized in order to find the best compromise between 'sufficient to identify' and 'track the plasma channel' behavior. The exposure time of 5 µs of the applied camera is chosen to avoid blur of the plasma image caused by movement during the image acquisition. The diameter of the plasma channel near both electrodes is determined for different recorded views. Therefore, the camera is aligned and focused on the anode disk and on the cathode surface at the same time. Thereby the average diameter of the arc is measured in the in-focus region at different positions within the anode disk. The analysis itself consists of measuring the number of pixels perpendicular to the arc direction. These pixels are subsequently converted into metric units by a calibration of the image size. Since the arc behavior in the GAP is a highly dynamic process, it is important to repeat these measurements over time and at different positions at the anode side to gain representative results of the arc properties. Statistic evaluation is obtained by measuring the arc diameter at least 50 times in every experimental condition. Similarly, the average and standard deviation of the arc elongation from the inner to the outer part of the anode is obtained by measuring the longest perpendicular distance of the arc to the anode surface as well 50 times of each recording.
3. Experimental results and analysis
The GAP discharge current amounts to 230 mA. Under the chosen conditions, almost all images of the GAP plasma measured with high-speed camera show the formation of a plasma plume (or plumes) (see figure 2), typically in the middle of the plasma longitudinal axis. As mentioned before, plasma plumes are characterized by considerably higher intensity of photoemission and elevated diameter compared to the plasma channel itself (see figure 6). The GAP channel is rotating in the turbulent gas flow. Therefore, points of view on the plasma plume are very different and practically from all directions. All measured images of single plasma plumes show a spherical form of these plasma objects. The number of plasma plumes that can be observed in one plasma channel varies from one to three. The averaged diameter of the GAP plasma channel, measured near the anode and the cathode, amounts to 265 ± 36 µm and 283 ± 45 µm, respectively. Images of the GAP plasma presented in figure 6 are captured with an exposure time of 5 µs. There is no change of the plasma channel position within this time interval.
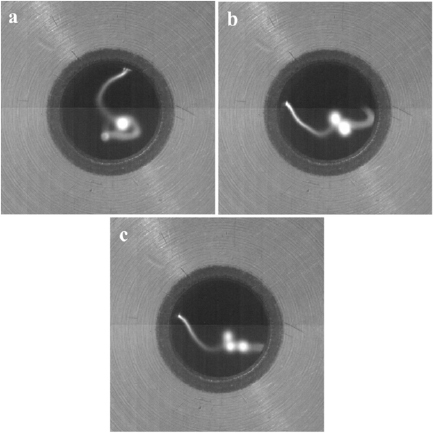
Figure 6. Images of the plasma channels in the GAP, with one (a), two (b) and three (c) plasma plumes, measured in pure nitrogen flow (10 slm) using a high-speed camera with an exposure time of 5 µs. The diameter of the anode tube is 7.08 mm.
Download figure:
Standard image High-resolution imageTo characterize the plasma conditions of the GAP, the intensities of nitrogen emission are measured using the simultaneous two-wavelength diagnostics method (see figure 2). The exposure time of these measurements amounts to 3.5 µs and corresponds to the optimized conditions for high spatial resolution and high count rates related to the dynamic range of the ICCD chip. As mentioned before, the position and shape of the plasma channel are not changing within the time interval equal or lower than 5 µs, i.e. the ICCD camera collects an image of the steady state plasma. Figure 7 shows 2D images of N2(C–B,0–0) and  (B–X,0–0) emissions (in photons/second) measured with the ICCD camera and corrected to collisional quenching in nitrogen under GAP plasma conditions (equations (4) and (5)). The pixel length amounts to 30 µm. To simplify the image analysis, only images with a single plasma plume in the plasma channel are chosen. All of these images show a spherically symmetric intensity distribution of the plasma plume, with negligible intensity of the rest of the plasma channel. Because of the limited area of the CCD chip, a part of the plasma channel with a plasma spot on the anode surface is not observed in the measured images, as for instance in figure 7. For the chosen images the Abel inversion algorithm [46] is used. The gas temperature in the plasma plume of Tg = 5500 K is estimated by the comparison of the measured nitrogen emission spectrum, using the echelle spectrometer, and the simulated nitrogen emission spectrum for various rotational temperatures (see above).
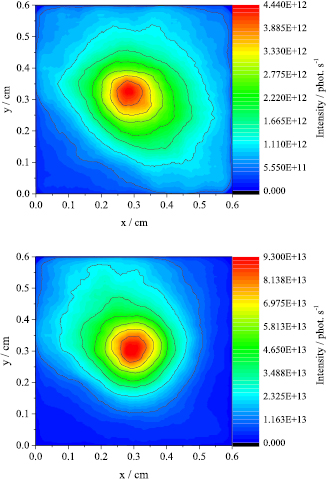
Figure 7. ICCD images of the nitrogen molecular emission (N2(C–B)-top and  (B–X)-bottom) of the GAP plasma plume, measured using the simultaneous two-wavelength diagnostics method with an exposure time of 3.5 µs. The intensities of the nitrogen emission are corrected to the collisional quenching under the GAP conditions.
Download figure:
Standard image High-resolution imageTo receive more information about the plasma conditions in the GAP plasma plume, we observe the radial intensity distributions in two perpendicular directions and calculate the average radial distributions of nitrogen emission bands using the Abel inversion (figure 8). Combining the radial distribution of the nitrogen emission and the polynomial fits of equations (15) and (16) (see figure 5), the radial distributions of the reduced electric field (see figure 6) and the electron density are calculated (see figure 9).
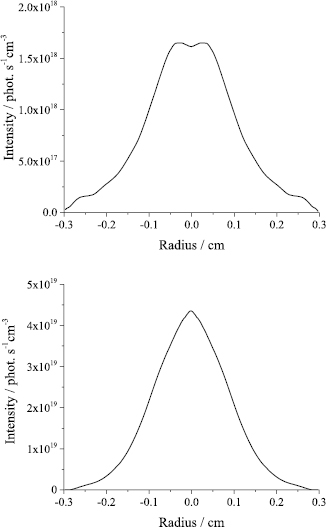
Figure 8. Radial distributions of nitrogen emission (N2(C–B)-top and  (B–X)-bottom) of the GAP plasma plume in nitrogen flow of 10 slm (see text).
Download figure:
Standard image High-resolution image
Figure 9. Radial distributions of the reduced electric field (top) and the electron density (bottom) of the GAT plasma plume. The error bars are calculated using the experimental error, inaccuracies of calibration procedure, applied cross sections for electron impact excitation and rate constants for collisional quenching of excited states of nitrogen molecules (see text).
Download figure:
Standard image High-resolution imageThe accuracy of the reduced electric field and the electron density depends on the accuracy of the experimental measurements, calibration procedure (relative error of 12% [44]), applied cross sections for electron impact excitation (14% for N2(C–B) [29] and 15% for  (B–X) [31]), rate constants for collisional quenching of excited states (5% for N2(C–B) and 14% for
  (B–X) [37]), and the accuracy of the numerical simulations applying the 'EEDF' code and the program code of the inverse Abel transformation. Based on our measurements and simulations, we conclude that stepwise electron impact excitation of N2(C–B) emission (equation (2)) amounts to only 16% and can be neglected by estimation of the inaccuracy of the determined plasma parameters under GAP plasma conditions. The estimation of the inaccuracies of the numerical simulations is beyond the scope of the presented paper, and is neglected in the discussed analysis. Under these assumptions, the inaccuracy of the electric field and the electron density are measured using the slope of the function presented in figure 4 and geometrical average value of relative errors of parameters applied in equation (14) to 2% and 21%, respectively.
As mentioned before, these plasma parameters were determined in the assumption of a negligible density of  ions compared to the density of
  . In other words, K(ne,Tg) in equation (10) is considerably lower than 1. Using the measured gas temperature of Tg = 5500 K and assuming an average electron density of ne = 1015 cm−3, we calculate K(ne,Tg) in the plasma plume of the GAP, operating in nitrogen flow, as K(ne,Tg) = 2.9 × 10⁻⁴. This very low value justifies our assumption of a negligible density of
  ions at the chosen conditions.
The electron velocity distribution function of the GAP plasma is simulated using a Boltzmann solver at E/N = 37 Td and presented in figure 10. The EVDF strongly distinguishes from a Maxwellian profile that can be represented as a straight line in semi-logarithmic scale. This distribution function is characterized by a group of electrons with kinetic energy higher than 10 eV, which are responsible for ionization of the working gas (sustaining the plasma conditions), and the dissociation of molecules (production of chemical active radicals).
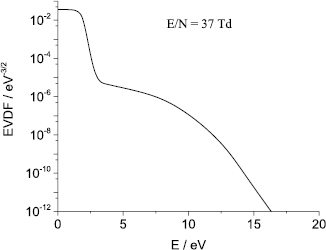
Figure 10. Electron velocity distribution function simulated for a pure nitrogen plasma at 37 Td and normalized applying equation (6) (see text).
Download figure:
Standard image High-resolution imageThe measured plasma parameters may help to find reasons for the plasma plume formation in the GAP plasma channel. The Boltzmann solver used in this study also calculates the electron drift velocity (vd). As shown in [47], a fitting of the product of the calculated electron drift velocity and electron density to the measured electric current density can be used by verification of the applied collisional-radiative model. At present, the physics of the plasma plume is not clear. Therefore we assume as a first approximation that the current flows axially through the plasma plume and compare the calculated current (I) to the measured one (see equation (17))
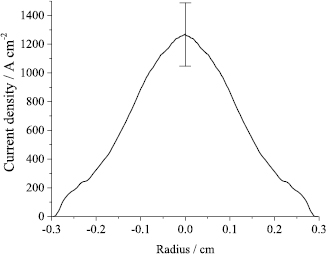
The radial distribution of the electric current density (j(R) = e · ne(R) · vd(R)) in figure 10 is calculated for the measured plasma parameters. The total axial current is equal to I = 106 A, which is calculated by integration over the surface area using equation (17) and the current density shown in figure 11. This value is considerably higher than the measured current of the power supply of the GAP (I = 230 mA). To determine the confidence interval of the current, we chose seven randomly selected images with a single plasma plumes and determine the radial distributions of electron density, electric field and electric current density. The averaged total current amounts to I = 121 ± 13 A in assumption of axial electric current flow. In our opinion, only a strong axial magnetic field in the plasma plume can explain the huge difference between the measured and calculated electric current. In this case, electrons are moving inside the plasma plume not parallel to its axis but helically around the axis. This effect will be discussed in the following section.
Figure 11. Radial distribution of the current density in the maximum cross section of the plasma plume, calculated using the electron density presented in figure 9 and the drift velocity calculated using the Boltzmann solver 'EEDF' [37]. The error bar is calculated using inaccuracies of the electron density and the reduced electric field determined using OES diagnostic.
Download figure:
Standard image High-resolution image
4. Discussions
The formation of the plasma plume in the middle of the GAP plasma channel with considerably larger diameter than the plasma channel increases the consumed electric power and the production of chemically active radicals for different applications. Important is that the increase of the consumed power occurs without additional heat loading of the electrodes. The mechanism of plasma plume formation and methods for optimization, e.g. stabilization of plasma plumes in the middle of the GAP nozzle, formation of several plasma plumes, etc, is not clear now. The above mentioned hypothesis that plasma plumes are formed by a strong axial magnetic field is not only based on the absence of alternative models for the explanation of the formation of plasma objects in the middle of a stable plasma channel, but also on known theoretical models developed for the interpretation of some atmospheric and astrophysical phenomena. These theoretical models [48, 49] are based on the formation of electron pairs under dense plasma conditions, similar to Cooper pairs in solid states [50]. The attractive force in these quasiparticles is higher than the Coulomb repulsing down to a distance of about 10 nm [51]. The formation of these pairs in turbulent plasmas causes increased circular electric current and axial magnetic field, which magnetizes the surrounding charged species. Based on this hypothesis the axis of the plasma plume under GAP plasma conditions coincides with the axis of a micro-turbulence but can be noncollinear with the axis of the plasma channel. This effect simplifies the magnetization of electrons of the plasma channel because of increasing of the v × B cross product.
The above mentioned model based on formation of electron pairs was applied for the interpretation of the formation of plasma spots on the substrate surfaces treated in the effluent of DBD-like plasma jets operated in noble gas flow [52–54]. The distance between plasma jet nozzle and treated substrate amounted in [52–54] to 1 cm. Because of the ambient air diffusion into the stream of the noble gas, the gas mixture consisted mainly of nitrogen with admixture of oxygen and argon. It was supposed that electron pairs are formed in micro-turbulences, which are produced by the interaction of ionization waves with the substrate surface [55], causing formations of circular electric current and axial magnetic field in the plasma spots on the treated surface. Eroded holes, tracks and crystals were observed on the treated surface of the substrates. All these traces were produced by one touch and without overheating of the substrate material and vaporization. The interpretation of these effects by an extremely high magnetic field at the axis of the plasma spots was supposed. Up until now, the magnetic field of plasma spots is not direct established because of the stochastically temporal and spatial behavior, very small dimension and short lifetime of these plasma objects under DBD-like plasma jet conditions. There is, however, some indirect evidence of a magnetic field, i.e. the contraction of the plasma channel up to a current density of 107–108 A·cm−2 and an extraction of paramagnetic atoms (aluminum, oxygen) from the treated substrate (aluminum film on the glass substrate) [54].
Based on the kinetic energy of  (determined in the presented paper using rotational distributions in the emission spectrum) we estimate a magnetic field of about 5 × 10³ Gs at 1 mm distance from the plume axis. This value is considerably lower than the magnetic field on the plasma spots axis assumed in [54] to explain the observed substrate damages. This difference can be caused by diamagnetic properties of the plasma plume, which is not in contact to the conductive wall under GAP plasma conditions. Gyrating particles of the diamagnetic plasma constitute magnetic moments, which result in shielding of the axial magnetic field. From one side, this assumption can explain the simultaneous formation of several plasma plumes in our experiment. From the other side, collisions of gyrating ions and electrons with neutrals can cause the established overheating of the plasma plume.
In the frame of the considered hypothetical model, the formation of eroded tracks on the cathode surface can be explained under low-current GAP conditions. The low-current GA is operated in a glow-regime. Therefore, the plasma channel is broadened near the cathode surface to sustain the GA current by the current of positive ions in the 'cathode fall' region. Because of frequently collisions with the surrounding species the kinetic energy of ions is lower under atmospheric pressure conditions. Therefore, the cathode material under low-current GA conditions is not overheated and damaged. If the GAP is operated in the same low-current conditions, plasma plumes are produced in micro-vortices. If the plasma plume is formed near the cathode surface because of the respective gas flow and the geometry of the plasma generator, the contact of this plasma object with the conductive surface possibly causes dramatic consequences for the cathode material. The diamagnetic properties of the plasma disappear by the contact with a conductive wall, and the extremely high axial magnetic field causes a drastic increase of the electric current density [54], overheating, vaporization and the local erosion of cathode material. The vaporization of the cathode material causes metal plasma around the cathode spot, which are possibly observed in [23].
As mentioned before, the formation of the plasma plume can strongly increase the electric power consumed in the gas flow without thermal load of the electrodes. From the other side, the contact of the plasma plume with the surface of the electrodes causes the formation of plasma spots with extremely high electric current and the production of erosion tracks on the electrode surfaces. For the optimization of safety and effective GAP applications, additional theoretical and experimental studies are needed.
5. Conclusion
A GAP operating in pure nitrogen flow is characterized using optical emission spectroscopy and numerical simulation. For the characterization of the transient GAP plasma channel, the in-house made simultaneous two-wavelength diagnostics method is applied. Under the chosen GAP conditions (electric current, gas flow rate), plasma plumes (from one up to three) are formed approximately in the middle of the plasma channel. The photoemission intensity of the plasma plumes is considerably higher than the emission in the other areas of the plasma channel. The gas temperature of the plasma plumes, measured using the rotational distribution in the emission spectrum of nitrogen, amounts to Tg = 5500 K. ICCD images of the plasma are recorded with a calibrated simultaneous two-wavelength diagnostics setup. A numerical simulation of the reduced electric field as a function of different intensity ratios (see equation (15)) allows to determine the radial distribution of the reduced electric field and electron density after the inverse Abel transformation. For the interpretation of the GAP plasma plume formation, helical electron movement is supposed because of a strong axial magnetic field by interaction of the plasma channel with micro-vortices in the gas flow.
Acknowledgment
The authors are very grateful to Professor Kurt Behringer for the development of the program code for simulation of emission spectra of nitrogen.