
Abstract
Focusing of a molecular beam in a high-field seeking state by an intense microwave standing wave is demonstrated. An 18 GHz microwave field that is near resonant to a rotational transition deflects a molecular beam due to the first-order ac Stark shift. The intense standing wave is obtained with a 47 cm long superconducting microwave resonator with a high unloaded quality factor of about 106. A cold molecular beam of PbO in the rotational ground state with a center velocity of 145 ms−1 is efficiently focused to have about a factor 10 enhancement of the flux density by the resonator with a microwave input power of about 1 W, despite the heaviness of the PbO molecule.
Export citation and abstract BibTeX RIS

Original content from this work may be used under the terms of the Creative Commons Attribution 3.0 licence. Any further distribution of this work must maintain attribution to the author(s) and the title of the work, journal citation and DOI.
1. Introduction
Cold and ultracold molecules have attracted increasing attention in the fields of physics and chemistry. It is now well established that cold molecules are significantly useful to explore physics beyond the standard model via precision measurements [1], such as measurements of the electric dipole moment of the electron [2–5]. Cold buffer gas environments have offered novel molecular spectroscopy experiments [6–8]. Trapped cold molecules allow us to study cold collisions for well-defined states and with long interaction times [9–13]. Furthermore, chemical reactions can be highly controlled by external fields in the ultracold regime [14]. Recent progress of laser cooling [15–17] and optoelectrical cooling [18] of molecules has reached the ultracold regime. Many of these applications have been established on combinations of methods to control the translational motion of molecules, such as focusers, guides, decelerators, and traps [19].
Focusing is important to increase the molecular beam flux density. Hexapole (or quadrupole) electrodes have been conventionally used as the focuser, for example, to introduce molecular beams into a decelerator [20] and to select a state for a precision measurement [21]. They can focus molecular beams in low-field-seeking (LFS) states, which have lower energies at a smaller electric field. On the other hand, high-field-seeking (HFS) states are difficult to handle. For example, Earnshaw's theorem claims that the HFS states cannot be trapped by a static field. The HFS states are of more importance than the LFS states, since the lowest energy state is always the HFS state for static fields. Even in rotationally excited states, polar molecules of small rotational constants are effectively HFS states, since they can only be LFS states for small electric fields.
So far, there have been several works to confine HFS state molecules 2-dimensionally. A thin wire with a high voltage can trap molecules in Kepler orbits [22]. Guides of HFS state molecules have been demonstrated by using alternate-gradient electric fields [23–25]. Decelerators [26–28] and traps [29] with this confinement have also been performed. Since the alternate-gradient method is dynamical, the effective confinement potential is not so deep.
A standing wave in a microwave resonator has also been used to focus a molecular beam in a HFS state [30–32]. These experiments have been performed with cavities made from copper which have quality factors Q on the order of 104. The electric field amplitude causing the ac Stark shift is proportional to  , where P is the input microwave power, and easily available amplifiers of P ≃ 10 W cannot provide deep potentials. An intense microwave field is demanded not only for the focuser but also for decelerators [33–35] and traps [36, 37].
Here, we report the focusing of a molecular beam in a HFS state by using a superconducting microwave resonator. Our superconducting resonator has a much higher quality factor of Q ≃ 106 than that of a normal conducting resonator. This fact reduces the requirement of P to ≃1 W. In the previous paper [38], we have tested such a superconducting resonator and have confirmed that it tolerates input powers of several watts while maintaining a high quality factor. In the present work, a cold and slow PbO beam in the rotational ground state is deflected by an intense standing wave of the lowest-order transverse magnetic (TM010) mode of a cylindrical cavity. The ac Stark potential is axially symmetric and nearly harmonic for the ground state of PbO with a potential depth of 0.11 K, which is much deeper than those of the other works of the dynamical confinement and the normal conducting resonators.
2. Focuser
The experimental setup is shown in figure 1. Our focuser is a superconducting microwave resonator of a Pb/Sn-coated cylindrical copper cavity. The structure is similar to the prototype resonator of our previous work [38]. The molecular beam of PbO passes through this cavity along the center axis. The cavity inner length is d = 470 mm and the inner radius is a = 6.3 mm. The inner surface is electroplated with an alloy of Pb (90%) and Sn(10%), which has a critical temperature of 7–8 K. About 2/3 of the resonator is immersed in liquid helium at 4.2 K, and the rest of the resonator is wrapped with superinsulation foil. The resonator has two end caps with center holes. The diameter and length of the holes are 4 mm and 8 mm for the molecular beam entrance and 5.5 mm and 8 mm for the exit, respectively. There are two additional holes of 2.4 mm diameter on the side wall of the main body to introduce loop antennas into the cavity. One antenna is used to couple the microwave into the resonator, while the other is used to monitor the resonator power. The antennas are made at the tip of semi-rigid cables of cupro-nickel, which has a low thermal conductivity. The insertion depth of the antenna for the input is optimized to obtain the strongest standing wave, while the insertion depth for the monitor is adjusted to couple the resonator very weakly. In other words, the input antenna is at the critical coupling condition, and the monitor antenna is highly undercoupled. The microwave is provided by a signal generator. When high power is required, the microwave is amplified by a traveling wave tube (TWT) amplifier. The maximum output power of the TWT is about 15 W, and the attenuation of the cables provides a loss of 7 dB.
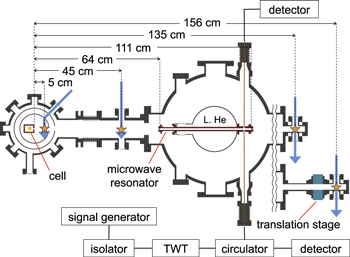
Figure 1. Experimental setup for molecular beam focusing. It is drawn to scale. The molecular beam is emitted from the cell, and is focused by the microwave resonator. Arrows indicate the excitation laser beams, and stars show the detection points. The setup with a translation stage is used for confirming the molecular beam alignment.
Download figure:
Standard image High-resolution imageThe cavity supports the TM010 mode at a microwave frequency of ν = 18.290 GHz. This frequency is slightly red-detuned from the J = 0 − 1 rotational transition frequency of PbO (νeg = 18.37 GHz). Since the spontaneous emission rate in the microwave range is negligibly small, the microwave frequency can be tuned very close to the resonance. The TM010 mode has an electric field amplitude of

where (ρ, ϕ, z) are the cylindrical coordinates, E0 is the maximum amplitude, Jn is the nth order Bessel function, and x01 ≃ 2.4048 is the first root of J0. The TM010 mode is the simplest and ideal mode for focusing HFS states, since it can provide a cylindrically symmetric harmonic potential. The electric field amplitude of this mode is maximum on the center axis, and thus HFS state molecules experience a force towards the center axis. The ac Stark shift potential U of the J = 0 ground state is given by U ≃ −Eμeg/2 for small  , where E is the electric field amplitude and μeg = 2.7(2) D [39] is the transition dipole moment of the J = 0 − 1 transition. A molecular beam parallel to the cavity axis at the entrance of the cavity is focused at

from the exit, where vz is the axial velocity and  with m as the mass of the molecule (see appendix A).
The energy stored in the resonator for the TM010 mode is

where  0 is the vacuum permittivity. In the steady state it is related with the input power P and the loaded quality factor QL as

The loaded quality factor QL is experimentally determined from the resonance linewidth  as QL = ν/δν. It is also measured from the transient decay time of the stored energy W as W(t) = W(0) exp(−2πνt/QL), where t is the time after the microwave input is suddenly turned off. From the linewidth measurement shown in figure 2(a), QL = 5 × 10⁵ is obtained with a low input power of P = 3 mW. From the decay measurement after a pulse of a high input power of a few watts QL = 2.6 × 10⁵ is obtained, and it is almost independent of the pulse duration from 1 to 100 ms. These results indicate that the intrinsic unloaded quality factor, which is 2QL in our case, is about 106. The difference in QL between the two measurements may be attributed to the heating of the cavity for the high power input case. From equations (3) and (4) a parameter set of P = 1.9 W and QL = 2.6 × 10⁵ gives E0 = 3.5 kV cm−1, which corresponds to the potential of U/kB = 0.11 K with kB as the Boltzmann constant. This deep potential enables us to successfully focus a heavy PbO molecular beam. The evaluation of P, as well as the skew reflection spectrum in figure 2(a), is discussed in appendix B.
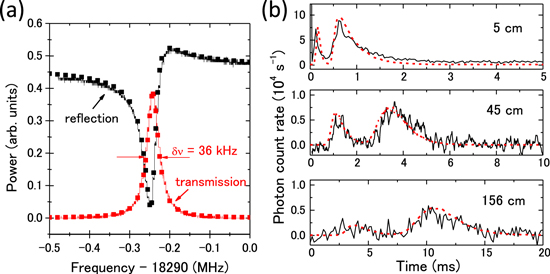
Figure 2. Characteristics of the superconducting resonator (a) and the cold molecular beam (b). (a) Reflection and transmission of microwave near the TM010 resonance. Lines are experimental data, and dots are theoretical results from a combined resonator model. (b) Time of flight of the PbO beam at different observation points without microwave. Experimental data are solid lines, and simulation results of equation (5) are dashed lines. Labels show the distances from the cell aperture.
Download figure:
Standard image High-resolution image3. Experiment
The molecular beam is a cryogenic helium buffer-gas-cooled beam [40]. This beam source is similar to our previous works on the precise spectroscopy of atoms [41] and PbO [42]. A solid PbO target is ablated in a metallic cell at 4 K by a 532 nm pulse laser with a 10 Hz repetition rate. The laser fluence is around 10 mJ mm−2, and the pulse width is about 4 ns. The inner volume of the cell is about 30 cm3, and the diameter of the cell exit aperture is 4 mm. The helium gas flow is continuous with a rate of 20 standard cubic centimeters per minute. The entrance and exit of the microwave cavity are at 64 cm and 111 cm from the cell aperture, respectively. The molecular beam is monitored via fluorescence at positions located 5, 45, and 135 cm (or 156 cm when a translation stage is incorporated) from the cell aperture. The excitation laser is tuned to the B(1)(υ' = 5, J' = 1) − X(0+)(υ'' = 0, J'' = 0) transition of 208PbO at 406 nm [42] by locking to a temperature-stabilized ultralow expansion etalon [41]. The fluorescence is detected by photomultipliers with spectral filters.
The center of the cell aperture, the axis of the cavity, and the last detection points at 135 and 156 cm are all aligned on a straight line. This alignment is confirmed by a telescope and also by monitoring the spatial distribution of an indium atomic beam at 156 cm. The indium atomic beam is produced by laser ablation and buffer-gas cooling similarly to the PbO beam. The detection system is scanned 2-dimensionally by the translation stage to see the spatial distribution. The flux density is confirmed to be maximum on the cavity axis. This supports that the enhancement of the flux density of the PbO beam on the axis is due to the focuser, as shown below, and is not due to simple deflection, that is, the displacement of the maximal point of the flux density. The atomic beam spread at 156 cm is limited mainly by the entrance aperture of the microwave cavity, and is about 8 mm full width at half maximum.
There are two components in the cold PbO beam as shown in figure 2(b). A fast component is initially emitted, and a slow one trails it. A possible explanation for this is that the heat of the ablation increases the temperature and also causes desorption of helium gas from the PbO target, which is made by compressing a powder, and this sudden increase of the temperature and pressure generates the fast component. The slow component corresponds to the standard buffer-gas-cooled beam in the hydrodynamic regime, where the beam is moderately slow and has a high flux [40]. Figure 2(b) shows time profiles of the fluorescence at 5, 45, and 156 cm. These time profiles are well reproduced by assuming temporal and velocity distributions at the cell aperture as
where θ is the Heaviside step function and {Ai, ui, wi, τi, Ti} are parameters to be fitted. The time origin t = 0 corresponds to the pulse laser irradiation. The center velocity and velocity distribution width (ui, wi) in unit of ms−1 are (370, 100) for the i = 1 fast component and (145, 25) for the i = 2 slow component, respectively. The decay times are τ1 = 0.025 ms and τ2 = 0.37 ms. The beginnings of the beam are T1 = 0 ms and T2 = 0.16 ms. The approximate distribution described by equation (5) is used for the simulation of the focusing to be described later. Note that there have been several works on the characterization of the helium buffer-gas-cooled beams. The slow component of our beam has a similar forward velocity u2 to the previous works on heavy molecules [43, 44], and has a relatively short decay time τ2 close to that of the beam source optimized for generating a short pulse [45].
When the microwave is applied to the resonator, the molecular beam is focused and the flux density in the detection area, 135 cm from the source, is increased. The detection area is about 6 mm2, which is determined by the excitation laser beam diameter of 2 mm and the photon detection system. This area is much smaller than the molecular beam spread. The microwave pulse is applied for a duration of 1 ≤ t ≤ 16 ms, when most of the molecular beam fully experiences the microwave standing wave in the cavity.
4. Results
Figure 3(a) shows examples of time-of-flight profiles with and without the microwave. To minimize the effect of the gradual change of the yield of the laser ablation, the fluorescence with and without microwave is observed alternately, and the time-of-flight data with and without microwave are respectively accumulated. A photon count rate of 104 s−1 in figure 3(a) corresponds to a flux density of about 1.7 × 108 cm−2 s−1 of the 208PbO beam for vz = 145 ms−1. Thus, the flux density of the slow component of the molecular beam within the detection area is increased from about 107 to 108 cm−2 s−1 at the temporal peak by the focuser. The flux density is estimated from the photon collection and detection efficiency of about 2.4%, the excitation laser intensity of 0.01 W cm−2, and spectroscopic characteristics of PbO such as the lifetime of the B(1) state [46]. Simulated profiles are also shown in figure 3(a). The temporal and longitudinal velocity distribution of equation (5) is assumed with the amplitudes A1 and A2 reproducing the data for no microwave. All other parameter values are already obtained in section 3, and thus there are no fitting parameters to simulate the profiles with microwave. The initial position (ρ, ϕ ) on the cell aperture and the initial flight direction are assumed to have uniform distribution. Good agreement between the observation and simulation proves the focusing effect quantitatively.
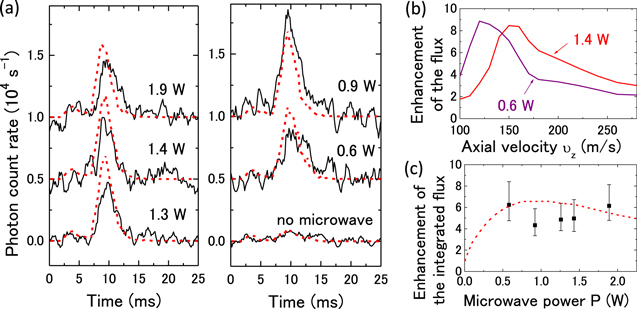
Figure 3. (a) Time-of-flight profiles of the PbO beam at the 135 cm detection point with offsets of constant intervals. Solid lines are experimental data smoothed for 5 adjacent points, and dashed lines are simulation results. The background photon count rate, which is taken from the average for t > 40 ms, is subtracted from each trace. Each trace with microwave is obtained by taking an average of 150–400 shots. The profile for no microwave is the average of the ones alternately taken with the other five data. Labels show the microwave power P entering the cavity. (b) Simulated enhancement of the flux density as functions of vz. (c) Enhancement of the flux density integrated for 7 ≤ t ≤ 14 ms as a function of P. Squares show experimental data and a dashed line shows a simulation result.
Download figure:
Standard image High-resolution imageThe profile for P = 0.6 W has a longer tail than, for example, that for P = 1.4 W. This power dependence reflects the velocity dependence of the focal length of equation (2). Figure 3(b) shows simulated results of the enhancement of the flux density as functions of the axial velocity. The maximum enhancement factor is about 9, and it moves to larger vz with increasing P. This means that a high input power causes overfocusing to very slow molecules, which are responsible for the tail of the profile. Figure 3(c) shows the power dependence of the enhancement of the flux density integrated for 7 ≤ t ≤ 14 ms, which almost covers the slow component profile. Experimental data shows that the number of molecules passing the detection area increases by a factor of about 5 for the slow component for 0.5 < P < 2 W.
5. Conclusion
In conclusion, a proof-of-principle experiment of an efficient focuser for a polar molecular beam in a HFS state is performed by using an intense standing wave of the TM010 mode in a cylindrical superconducting microwave cavity. The deep confinement potential is able to efficiently focus the PbO molecular beam despite its heaviness of 224 u. Only about 1 W microwave power is enough for our experiment. This power can easily be handled with usual cryogenic systems. Since the focal length of equation (2) scales with  , a conventional supersonic expansion beam with a heavy carrier gas of about 300 ms−1 would be able to be similarly focused for moderately light molecules of about 50 u. Since the microwave resonator has a more closed structure than a hexapole focuser, more careful skimming of the beam would be required to bring it very close to the beam source. However, the cryogenic surface of the resonator would be beneficial for adsorption pumping of the heavy carrier gas.
Acknowledgments
We acknowledge Y Moriwaki, A Fuwa, K Okamoto, S Shiraishi, and R Takabatake for assistance in the experiment and P Djuricanin for helpful comments. This work is supported by JSPS KAKENHI Grant Number JP24684031 and JP16K05500, Toray Science Foundation, and Researcher Exchange Program between JSPS and NSERC.
Appendix A.: Details of the theory of the focuser
The J = 0 ground state is adiabatically connected to the HFS dressed ground state in the case of ν < νeg. The ac Stark shift potential U of this state for the electric field amplitude E is well approximated as
where h is the Planck constant. When  , the first-order Stark shift U ≃ − Eμeg/2 is obtained. This first-order Stark shift and the approximation of J0(x) ≃ 1 − x2/4 for equation (1) give the cylindrically symmetric harmonic potential.
When the azimuthal velocity component vϕ of the molecular beam is neglected, the radial position and velocity (ρin, vρin) of a molecule at the entrance of the cavity and those at the exit (ρout, vρout) are related for this harmonic potential as [38]
Molecules with vρin = 0 are focused at the distance f of equation (2) from the exit of the cavity.
Appendix B.: Evaluation of the input microwave power
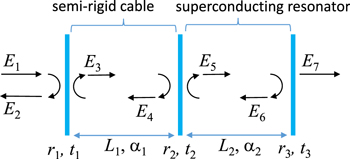
The evaluation of the input microwave power P is not straightforward in our experiment. Since our vacuum feedthrough for the microwave has a non-negligible reflectance, the semi-rigid cable between the feedthrough and the antenna becomes a lossy low-Q resonator. The combination of this low-Q resonator and the high-Q superconducting resonator causes a distortion of the reflection spectral profile and a deviation of the reflection minimum as compared to the transmission maximum seen by the monitor antenna (see, figure 2(a)). These behaviors are well explained by a model of two combined optical cavities composed of three mirrors as shown in figure B1. The electric fields Ei are related one another as
where ri is the amplitude reflection coefficient, ti is the amplitude transmission coefficient with  is the spacing between mirrors, k is the wavenumber, and αi represents the loss. The reflection and transmission of the power are proportional to
  and
and  , respectively. The fitted curves (dots in figure 2(a)) of the solutions of equation (B.1) reproduce well the experimental data (lines in figure 2(a)). The power P entering the resonator is also determined from this model. The energy W stored in the superconducting resonator is proportional to
  .
.
Figure B1. Combined resonator model to estimate the input microwave power and to analyze the skew reflection spectrum of the microwave resonator.
Download figure:
Standard image High-resolution image