

Abstract
Great concern regarding energy resources and environmental polution has increased interest in the study of alternative sources of energy. Biodiesels as an alternative fuel provide a suitable diesel oil substitute for internal combustion engines. The Raman spectra of pure biodiesels of soybean oil, olive oil, coconut oil, animal fats, and petroleum diesel are optically characterized for quality and biofuel as an alternative fuel. The most significant spectral differences are observed in the frequency range around 1457 cm−1 for pure petroleum diesel, 1427 for fats biodiesel, 1670 cm−1 for pure soybean oil, 1461 cm−1 for soybean oil based biodiesel, 1670 cm−1 for pure olive oil, 1666 cm−1 for olive oil based biodiesel, 1461 cm−1 for pure coconut oil, and 1460 cm−1 for coconut oil based biodiesel, which is used for the analysis of the phase composition of oils. A diode pump solid-state laser with a 532 nm wavelength is used as an illuminating light. It is demonstrated that the peak positions and relative intensities of the vibrations of the oils can be used to identify the biodiesel quality for being used as biofuel.
Export citation and abstract BibTeX RIS
1. Introduction
Biodiesel has become the foremost alternative biofuel being developed to reduce the nation's dependence on fossil fuels. Alternative fuels, especially ethanol and biodiesel, are rapidly gaining momentum to reduce world dependence on traditional motor vehicle fuels and to improve air quality for the reduction of the carbon footprint. Biodiesel use is accelerating faster than any other fuel due to its use of nonfood feedstocks (animal fat and used vegetable oil) and the minimal need to alter diesel engines or the fuel delivery infrastructure when using biodiesel [1–3]. In the year 2010, there were only 20 oil producing nations supplying the needs of over 200 nations. By the year 2015, more than 200 nations have become biodiesel producing nations and suppliers. The world is entering a new era of participation by emerging market nations in global green energy production to transport and to create many points along the supply chain at which fuel quality may be compromised [4, 5]. Biodiesel is a nontoxic, nonexplosive, and biodegradable source of energy having 20% blend petroleum diesel. The life of diesel engines can be extended by the use of biodiesel because it is a superior lubricant than petroleum diesel fuel [6, 7].
The determination of biodiesel fuel quality is, therefore, an issue of great importance to the successful commercialization of fuel. There are many physical techniques that are being employed today to characterize biodiesel samples, such as Raman spectroscopy, Foutier transform infrared (FTIR), optical transmission, etc. [8–10]. Accurate measurements of biodiesel concentration with the most popular spectroscopic techniques include IR, near IR (NIR), and Raman spectroscopes [11–13]. Raman spectra have been increasingly used in the structural interpretation of molecular systems, having shifts in the wavelengths of the inelastically scattered radiation that provide the chemical and structural information. Raman shifted photons can be of either higher or lower energy, depending upon the vibrational state of the molecule under study [14, 15].
In the present study, Raman spectra of the petroleum diesel and the pure biodiesels of soybean oil, olive oil, coconut oil, and animal fats are presented and are discussed. This technique consists of molecular imaging using optical technology that combines the molecular chemical analysis of Raman spectroscopy with a 532 nm wavelength of a He–Cd laser [16].
2. Materials and methods
To study the Raman spectra of the petroleum diesel, pure biodiesels of soybean oil, olive oil, coconut oil, and animal fats, the vegetable oil and animal fats are converted into biodiesel by using a base or an acid to catalyze transesterification [17, 18]. This reaction is rapid and systematic and occurs at lower temperatures (150 °F) and pressure (20 psi) with sodium or potassium hydroxide as a base catalyst. Methanol and the catalyst are mixed to produce methoxide, which is mixed with different oils to produce 20% biodiesel. Commercially refined soybean oil, olive oil, coconut oil, and animal fats (Rawal Chemicals, Pakistan) were mixed with methanol (99%) as suggested in the literature [18]. The reaction was performed in a 60 ml glass flask containing a 1:5 oil to pure diesel ratio, and the system was stirred at 80 °C for 2 h [19]. The product was cooled to room temperature, washed with distilled water, dried over magnesium sulfate, and kept overnight in an oven at 80 °C to remove the residual alcohol. The mixtures were stirred for 3 min before the spectra were collected. All spectra were recorded at room temperature.
Raman spectroscopy was carried out using a high resolution Raman spectroscopy system model MST-4000A (Germany). A schematic Raman spectrum is shown in figure 1. The main elements of the setup are as follows: laser sources at 532 nm, sample slides, and a chamber light collection optics detection system. The optimized parameters for the target (material), pure oils, and its biodiesels on a glass substrate at room temperature (300 ± 2 K) are used. After focusing in image mode, the sample was shined by an intense diode pump solid state laser source with a 532 nm wavelength and an 80.0 mW laser power. The signals were collected and were detected in scan mode by the same objective lens and were air cooled (−50 °C) with a charged couple device detector. The Raman spectra were taken in the range from 800 to 2000 cm−1. An accumulate acquisition mode was used to reduce noise and thermal fluctuation and to improve the signal to noise ratio. An AFM tip of silicon nitride was used having an approximate radius with a curvature of 10 nm [20].

Figure 1. Schematic of Raman spectroscopy for biodiesel and vegetable oils.
Download figure:
Standard image High-resolution image3. Results and discussions
Raman spectroscopy is an ideal method for the analysis of edible fats and oils, which are composed of esters of fatty acids and glycerol. Raman spectra were collected through a 20 µl drop of oil and its biodiesel as a plot of scattered intensity and energy difference between the incident and the scattered photons and are obtained by pointing a monochromatic laser beam at a sample. The loss (or gain) in the photon energies corresponds to the difference in the final and initial vibrational energy levels of the molecules participating in the interaction. Raman peaks from 800 to 2000 cm−1 of the petroleum diesel, pure biodiesels of soybean oil, olive oil, coconut oil, and animal fats were easily monitored as shown in figures 3–6. The Raman peaks for pure oil and its biodiesel are shifted and can easily differentiate by primary product biodiesel (methyl ester) where most of the Raman peaks simply show shifts in the Raman peaks. This is due to the fact that all products have significantly different densities and polarity and light is scattered from a molecule or crystal. The scattered photons have the same energy or frequency and, therefore, wavelength, as the incident photons. However, a small fraction of light (approximately 1 in 107 photons) is scattered at optical frequencies different from, and usually lower than, the frequency of the incident photons. The Raman shift in oil and its biodiesel represents a change in vibrational, rotational, or electronic energy of a molecule and inelastic scattering. The assignments of the major bands in the spectra are well established in the literature and are measured through our Raman system given in figure 2. More complete rigorous assignments of the solid-state spectra obtained from density functional calculations are also now available [16, 17].
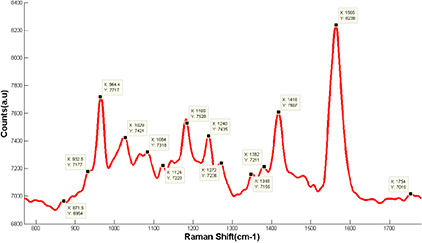
Figure 2. Band position in Raman modes for biomaterials, in general, indicating shifts from 800–1800 cm−1.
Download figure:
Standard image High-resolution image
Figure 3. Raman spectra obtained from (a) pure and (b) 20% biodiesel of a soybean oil (20 µl) drop. The high 1670 and 1481 cm−1 wave signals appear in the spectra. These wave signals are typical for pure and 20% biodiesel of soybean oil.
Download figure:
Standard image High-resolution image
Figure 4. Raman spectra obtained from (a) pure and (b) 20% biodiesel of an olive oil (20 µl) drop. The high 1666–1670 and 1457–1460 cm−1 wave signals appear in the spectra. These wave signals are typical for pure and 20% biodiesel of olive oil.
Download figure:
Standard image High-resolution image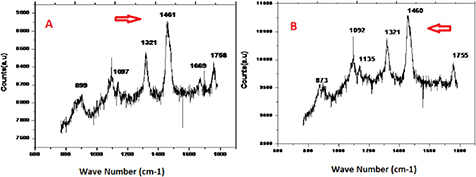
Figure 5. Raman spectra obtained from (a) pure and (b) 20% biodiesel of a coconut oil (20 µl) drop. The high 1460 and 1461 cm−1 wave signals appear in the spectra. These wave signals are typical for pure and 20% biodiesel of coconut oil.
Download figure:
Standard image High-resolution image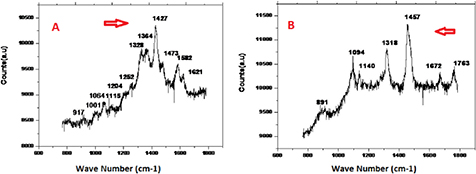
Figure 6. Raman spectra obtained from (a) 20% fats biodiesel and (b) a petroleum diesel (20 µl) drop. The high 1427 and 1457 cm−1 wave signals appear in the spectra. These wave signals are typical for 20% fats biodiesel and petroleum diesel.
Download figure:
Standard image High-resolution image
In pure soybean oil, its biodiesel ester presents Raman shifts at 1670, 1768, 1460, 1318, and 1094 cm−1. These peaks represent absorption positions for the C=O stretching vibrations of cortisone amide I, the CH2/CH3 deformation of lipids and collagen, and the C–C vibration mode of the gauche-bonded chain contents. In soybean oil based biodiesel collagen, lipid and C–C vibrational modes are the dominant ones compared to the pure one. Raman spectra of soybean oil and the corresponding methanol ester present several differences. Figure 3 depicts these main signals on the Raman spectra: (i) the peak at 1670 cm−1 corresponds to amide I formation, whereas, on the soybean biodiesel spectrum, this peak appears only as a shoulder; (ii) the amide I band is displaced from 1670 to 1669 cm−1 after transesterification; and (iii) the bands at 1460 CH2/CH3 deformation of lipids and collagen at 1461 cm−1 are due to ester formation. Because of these variations, it was possible to correlate the Raman spectra with biodiesel yields and variations in signal intensity, laser power, sample positions, etc. [19].
The Raman spectra of olive and coconut oil with their respective biodiesels are presented in figure 4 and are very similar with the exception of small differences as reported by Zagonel and co-workers [11]. On the other hand, the Raman spectra of soybean oil and the corresponding ethyl ester present in figure 3 have several differences. In pure olive oil, its biodiesel ester presents Raman shifts at 1670, 1316, and 1100 cm−1. These peaks represent amide I, collagen, deoxyribose, CH2/CH3 deformation of lipids and collagen, guanine (B, Z marker), and the C–C vibration mode of the gauche-bonded chain contents. In olive oil based biodiseal coligen, lipids and C–C vibrational modes are the dominant ones compared to the pure one. In pure coconut oil, its biodiesel ester presents Raman shifts at 1755, 1460, 1321, and 869 cm−1. These peaks represent one of the absorption positions for the C=O stretching vibrations of cortisone, CH2/CH3 deformation of lipids and collagen, C=O (lipids), paraffin, guanine (B, Z marker), and lipids. In coconut oil based biodiesel, CH2/CH3 deformation of lipids and collagen vibrational modes are dominant compared to the pure one.
In animal fat biodiesel the Raman shifts are 1582, 1427, 1328, and 1064 cm−1. These peaks represent phenylalanine, deoxyribose, (B, Z marker), typical phospholipids, and a skeletal C–C stretch of lipid acyl chains. In fat biodiesel deoxyribose, (B, Z marker), vibrational modes are dominant, and in petroleum diesel, the Raman shifts are 1763, 1457, 1318, and 1094 cm−1. These peaks represent CH2/CH3 deformation of lipids and collagen, deoxyribose, guanine (B, Z marker), lipids, and protein bands. In petroleum diesel deoxyribose, vibrational modes are the dominant ones compared to oil biodiesels.
In Raman spectra of pure oil and its biodiesel, many of the peaks are narrow and change wave number position. These changes are most marked in the regions at 800–1200 and 1400–1700 cm−1, which are dominated by C–C stretching and CH2 scissor vibrations, respectively, but, as figures 3–6 show, the changes in band position are not confined solely to this region. The absolute Raman signal intensity from a given sample depends not only on the composition of the sample, but also on a number of trivial hard to control experimental factors. These include laser power, sample transparency/light absorbance, and optical alignment (including the exact position of the sample with respect to the focus position of the spectrometer's collection optics).
The distributions of the scattering intensities in the spectra of the pure oil and its biodiesel samples are close to each other. Biodiesel has a significant potential for use as an alternative fuel in compression ignition diesel engines as described by Knothe et al and Dunn et al [5, 21]. It is technically competitive with conventional petroleum-derived diesel fuel and requires no changes in the fuel distribution infrastructure. Some technical improvements regarding cold flow properties, reduction of oxides, exhaust emissions, and oxidative stability remain as the major hurdles toward widespread commercialization and the high price of biodiesel. In world markets, environmental and energy security concerns, which are subject to legislation, can override economic aspects. Vegetable oils, such as coconut oil, soybean oil, and rapeseed oil (canola oil), and in countries with more tropical climates, tropical oils (palm oil) are the major sources of biodiesel. However, in recent years, animal fats and, especially, recycled greases and used vegetable oils have found increasing attention as sources of biodiesels studied by Geldard et al, and regardless of the feedstock, transesterification reactions are carried out to produce biodiesel [22, 23]. With regard to vegetable oils as alternative diesel fuels, it was observed that the resulting vegetable oil (or animal fat) esters did not exhibit the operational problems, such as engine deposits, coking of injector nozzles, etc., associated with neat oils. A more detailed discussion of the rationale for each quality parameter in biodiesel fuel standards is given in the literature [24, 25]. Jalkanen et al briefly describe some methods used in the analysis of biodiesel, which include procedures for determining contaminants, such as water and phosphorus of biodiesels [26].
The analysis of the scattering intensity in the range around 800–1800 cm−1 is important for the validation of the method for the determination of the phase composition. Depending on geographic limitations and oil prices, biodiesel may be produced from a variety of feedstocks, and different technologies can be applied for biodiesel production [27]. The goals of the study conducted by Popp et al [28] in 2012 were to use FTIR, FTNIR, and Raman (FT-Raman) spectroscopy to discriminate among ten different edible oils and fats and to compare the performance of these spectroscopic methods. The carbonyl group gives a distinct isolated stretching peak around the 1750 cm−1 spectral region. A second candidate for the internal standard would be the peak associated with the C=O (lipid) stretching vibration (i.e. the carbonyl carbon and the first carbon in the chain), which lies in the 880–920 cm−1 range. Establishing a reliable internal standard is a critical first step in carrying out quantitative analysis, and we have examined the behavior of several Raman peaks under a wide range of experimental conditions to determine the degree of trust. Biodiesel is biodegradable, nontoxic, has low emission profiles, and potentially is an alternative fuel to be used either pure or blended with petroleum-derived diesel. In our previous study, we optically determinesd transmission and Raman spectroscopic diagnostics of viral infectious diseases [29–32].
4. Conclusion
In this study, we measured and analyzed the Raman spectra of petroleum diesel and the pure biodiesels of soybean oil, olive oil, coconut oil, and animal fats. It is demonstrated that the intensity distributions in the Raman spectra pure oil and its biodiesel, fats biodiesel, and petroleum diesel are close to each other. Significant differences in the peak positions and intensities are observed only for the spectral peak positions of 1670 and 1460 cm−1. In addition, the peak intensities of the components are almost equal in the spectra of 1750 and 1090 cm−1, whereas, the intensity of the low frequency component is higher in the spectrum of the biodiesel.
Thus, we demonstrate that Raman spectra can be used in the analysis of the quality of fuel. Although the Raman spectra of petroleum diesel and pure biodiesels of soybean oil, olive oil, coconut oil, and animal fats are close to each other, they have slight differences in the peak intensities, and phase shifts differentiate all three oils. Further investigations are needed to verify the performance of this technology in different oil samples and in other biofuels to determine the applicability for safe and cost effective alternatives.