

Abstract
Electroencephalography (EEG) is challenged by high cost, immobility of equipment and the use of inconvenient conductive gels. We compared EEG recordings obtained from three systems that are inexpensive, wireless, and/or dry (no gel), against recordings made with a traditional, research-grade EEG system, in order to investigate the ability of these 'non-traditional' systems to produce recordings of comparable quality to a research-grade system. The systems compared were: Emotiv EPOC (inexpensive and wireless), B-Alert (wireless), g.Sahara (dry) and g.HIamp (research-grade). We compared the ability of the systems to demonstrate five well-studied neural phenomena: (1) enhanced alpha activity with eyes closed versus open; (2) visual steady-state response (VSSR); (3) mismatch negativity; (4) P300; and (5) event-related desynchronization/synchronization. All systems measured significant alpha augmentation with eye closure, and were able to measure VSSRs (although these were smaller with g.Sahara). The B-Alert and g.Sahara were able to measure the three time-locked phenomena equivalently to the g.HIamp. The Emotiv EPOC did not have suitably located electrodes for two of the tasks and synchronization considerations meant that data from the time-locked tasks were not assessed. The results show that inexpensive, wireless, or dry systems may be suitable for experimental studies using EEG, depending on the research paradigm, and within the constraints imposed by their limited electrode placement and number.
Export citation and abstract BibTeX RIS

Content from this work may be used under the terms of the Creative Commons Attribution 3.0 licence. Any further distribution of this work must maintain attribution to the author(s) and the title of the work, journal citation and DOI.
1. Introduction
Electroencephalography (EEG) has traditionally used 'wet' systems in which conductive gels couple the scalp to metal electrodes that are physically tethered to the recording system. However, there is increasing interest in the use of EEG beyond the laboratory setting, for example in investigating brain activity of people engaged in everyday tasks such as sport and other forms of performance (Thompson et al 2008, Aspinall et al 2013) or military work (Janelle and Hatfield 2008). The aim is typically to understand the nature of task-related neural activity, but also ultimately to boost performance through training or augmentation (Dixon et al 2009, Berka et al 2010). Other research has focussed on practical applications of EEG technology. These include: ambulatory EEG, in which the neural activity of patients suffering from conditions such as epilepsy is monitored while they go about their everyday activities; 'on-the-spot' triaging for traumatic brain injury (Naunheim et al 2010); detection of sleep onset, for instance while driving (Makeig and Inlow 1993); and brain-computer interfaces (Wolpaw et al 2002, Lebedev and Nicolelis 2006), in which the detection of patterns of neural activity is used to control computers and devices, for example for mobility and communication.
Despite the potential for research and practical application in each of these areas, the adoption of EEG technology outside the laboratory is constrained by long setup and clean-up procedures, relative immobility of the subject due to their tether to equipment by leads, and high costs of traditional, research-grade systems. More recently, EEG systems have been developed to overcome some of these barriers. So-called dry EEG systems attempt to shorten setup and clean-up times as they do not require conductive gel. Systems that transmit data through a wireless connection, rather than across wires from the cap to the equipment, offer the possibility of unrestricted participant movement. New low-cost, consumer-grade EEG systems, developed for use in computer gaming, may open up the use of EEG technology to large-scale deployment, and to underfunded application areas such as assistive technology for disabilities. However, these systems are relatively newly developed and, to our knowledge, their EEG data has not been independently evaluated against traditional research-grade equipment. This study addresses whether the features of dry electrodes, wireless data transmission and low cost are compatible with valid bio-signal recording using EEG hardware that incorporates these features.
1.1. EEG systems
1.1.1. Wet versus dry.
To reduce long setup and clean up procedures, EEG systems have been designed to use dry-contact electrodes. Dry systems have higher scalp-to-electrode impedances than wet systems and so are more susceptible to electromagnetic interference. The high impedance of dry systems can be mitigated by using active electrodes that pre-amplify the signal at the electrode before it passes to the amplifier, and by using multiple pins to make contact with the scalp at multiple sites, thereby increasing the contact surface area. Strong filtering is applied to further mitigate contamination. Guger Technologies (g.tec/Schiedlberg, Austria) have recently released a dry EEG system called the 'g.Sahara' (Edlinger et al 2012, Guger et al 2012). Each electrode in the g.Sahara system uses eight gold-coated pins which are mounted in a circular formation. This arrangement, and the presence of amplifiers in the electrodes, achieves the required low impedance and high signal-to-noise ratio. The recommended arrangement uses a reference electrode located on one mastoid and the ground electrode on the other (both wet electrodes).
1.1.2. Wireless versus wired.
There has been an increase in the demand for wireless EEG systems. The B-Alert from Advanced Brain Monitoring achieves mobility with a wireless system, in which the EEG signal from each electrode is transmitted to a receiver, and recorded using software provided by B-Alert. The B-Alert is a wet system with a conductive paste. It can record from 21 channels, with ground and reference electrodes on the mastoids.
1.1.3. Cost.
The high costs of traditional systems are restrictive in widely applied commercial and non-commercial contexts. One low-cost EEG system is the Emotiv EPOC (Emotiv/San Francisco, USA), a consumer grade EEG system originally designed for the consumer computer-game market. The Emotiv EPOC is a 14 channel wet EEG system (in which P3 and P4 act as reference and ground electrodes, respectively). Each electrode requires saline solution in felt pads to facilitate signal conduction to the electrode (Duvinage et al 2012). Similar to the B-Alert, the EEG signals are transmitted wirelessly to a USB receiver and recorded by software included with the Emotiv. Furthermore, the company states that the Emotiv EPOC has a battery life of 12 h, which would potentially enable the headset to be worn throughout the course of a normal working day.
We note that the three 'non-traditional' systems that we investigate here all feature a relatively small number (21 or fewer) of EEG electrodes, in which the electrodes are positioned in fixed locations on the cap for the B-Alert and Emotiv. Traditional research-grade systems offer the ability to collect data from a much larger number of electrodes, and the flexibility to place them in any position. These advantages of a research-grade system should be weighed up against the benefits of dry electrodes, a wireless connection or low cost. We also note that we could not conduct a comparison between systems that met every possible combination of these three features, as we did not have access to such systems.
In this study, we examined the sensitivity of these EEG systems (table 1) by measuring the spectrum of resting EEG and by measuring neurophysiological signals robustly associated with five different paradigms. These signals are: the Berger effect, visual steady-state responses (VSSRs), two sensory event-related potential components, namely mismatch negativity (MMN) and P300, and motor event-related desynchronization/synchronization (ERD/ERS).
Table 1. Features of EEG systems.
| Wet/Dry | Wired/Wireless | Low Cost | Number of channels | |
|---|---|---|---|---|
| g.HIamp | Wet | Wired | No | 256 (29 used) |
| g.Sahara | Dry | Wired | No | 16 (8 used) |
| B-Alert | Wet | Wireless | No | 21 |
| Emotiv EPOC | Wet | Wireless | Yes | 14 |
1.2. Neurophysiological tasks
1.2.1. Berger effect.
The Berger effect (Berger 1933, Kirschfeld 2005) was first identified in the 1920s by Hans Berger, who observed relatively high amplitude alpha waves (8–13 Hz) from electrodes positioned above the occipital and parietal cortex when individuals had their eyes closed, compared to when they had their eyes open. This increase of alpha during eyes closed in comparison to eyes open is often displayed as a relative increase of power on a power spectrum.
1.2.2. Visual steady-state response.
The VSSR corresponds to the synchronization of activity in neurons in the occipital lobe when exposed to an intense and repetitive visual stimulation, such as a strobe (Wu et al 2008). Similar to analysing the Berger effect, the VSSR is best identified when viewing power spectra and is seen as a significant increase of power at the frequency of stimulation, relative to the frequencies which surround it (Vialatte et al 2010).
1.2.3. MMN and P300.
The MMN and P300 are event-related potential components that occur after the onset of a repeated stimulus. The MMN is a negative component that occurs at approximately 150 ms after novel stimuli (Ulanovsky et al 2003), and is considered to reflect a pre-attentive, non-conscious response. The P300 is a component that occurs approximately 300 ms after a rare target stimulus, and is considered to reflect cognitive processing, such as the update or retrieval of memory processes (Donchin and Coles 1988).
1.2.4. ERD and ERS.
The ERD and ERS are event-related components that occur in relation to a response rather than a stimulus. The ERD and ERS are desynchronization and synchronization events, respectively (Schomer and Lopes da Silva 2011), around a motor response. The ERD occurs in the 1 s that precedes a response in both the mu (8–14 Hz) and beta bands (14–25 Hz), with frequencies as defined in (Schomer and Lopes da Silva 2011). In contrast, the ERS is only shown in the beta band and is strongest in the 1–2 s period after a response.
2. Methods
2.1. Participants
Participants were 18 males and 2 females (19–69 years of age), all of whom had normal corrected eyesight and hearing and were free of any psychiatric or neurological disease. All participants were provided with an information sheet and gave informed consent. This study was approved by the Flinders Social and Behavioural Research Ethics Committee.
2.2. EEG acquisition
Participants were comfortably seated in a sound-attenuated Faraday cage (R.F.I Industries, Bayswater, Victoria, Australia). An infrared camera was positioned inside the Faraday cage to monitor participants and to enable the experimenter to remind participants to minimize movements. The infrared camera was aided by a dim light on the opposite side of the room.
Visual stimuli and written instructions were presented on a computer monitor while auditory instructions and stimuli were presented binaurally via air-tube earphones. Manual responses were made using a custom-built response panel.
EEG data was recorded from an Easycap EEG cap plus g.HIamp amplifier (hereafter, 'g.HIamp'), the g.Sahara plus g.HIamp amplifier (hereafter 'g.Sahara'), the B-Alert system (hereafter 'B-Alert') and the Emotiv EPOC system (hereafter, 'Emotiv'), using 29 electrodes, 8 electrodes, 21 electrodes and 14 electrodes, respectively (figure 1). While the g.HIamp is able to record from all channels in the standard 10–20 EEG layout, the other three systems are restricted in the number and locations of electrodes. We used the g.HIamp to record from all electrodes that were used in the test systems. Data from g.tec equipment was acquired using g.Recorder, software version 4.11.00. The g.tec analogue-to-digital converter was operated at a sampling rate of 1200 samples per second (24 bit, no filters applied). For the g.HIamp, the Cz and FCz channels were used as the reference and ground electrode, respectively.
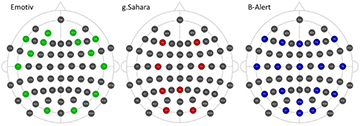
Figure 1. Electrode configuration (extended 10–20) of each EEG system. The g.HIamp recorded from electrode positions that were used by at least one other EEG system. Reproduced from Oostenveld and Praamstra (2001) with permission.
Download figure:
Standard image High-resolution imageFor the g.Sahara, electrodes placed on the right and left mastoids were used as the reference and ground electrode, respectively.
B-Alert data was sent via a wireless transmitter to a receiver and viewed and recorded using the B-Alert Pro Control GUI, software version 2.05.2 (Advanced Brain Monitoring, 2011). The sample rate of the B-Alert was 256 samples per second. The B-Alert electrodes were in fixed positions and used the Synapse electrode cream (Kustomer Kinetics, 2014) as the conducting paste. Impedances were kept below 40 kΩ as indicated by the impedance test in the software.
The Emotiv EPOC electrodes were also in a fixed position. The EEG data was sent wirelessly to the Emotiv TestBench program, software version 1.5.0.3 (Emotiv Ltd, 2010). The sample rate of the Emotiv was 128 samples per second, and had a built-in band-pass filter of 0.2–45 Hz and built-in digital notch filters at 50 and 60 Hz. Low electrode impedances were achieved using saline solution as indicated by TestBench.
2.3. Experimental protocol
Participants completed each of four tasks; the eyes open/eyes closed task for the Berger effect, the strobe light task for VSSR, the discrepant auditory pattern task for MMN and P300 and the single-finger movement task for ERD/ERS. The g.HIamp system was used for every participant, and two of the remaining three systems were randomly selected for each participant. The task order was counterbalanced across participants, although for any individual participant, the order of the tasks was not varied from one EEG system to the next. Participants completed all tasks for one EEG system, with a 5 min break between each task and a 5 min break before the next system was set up. All stimuli were presented via a computer monitor and earphones, and the software driving the experiment was written in Presentation v.17 (Neurobehavioral Systems).
2.3.1. Noise floor.
The noise floor of the systems was measured by recording from electrodes applied to a saline-saturated pad, in part on a flat surface and in part draped over a Styrofoam manikin head necessary for applying the Emotiv or B-Alert electrodes. The Emotiv and B-Alert, therefore, were tested in separate studies. The g.tec electrodes (g.Sahara and g.HIamp) were placed on the flat surface and either the Emotiv or B-Alert on the manikin. Data was recorded for 10 min, simultaneously from the three EEG systems used in each session.
2.3.2. Eyes open/eyes closed task (Berger effect).
The Berger task consisted of the eyes open and eyes closed tasks. In the eyes open task, the participants were instructed to fix their gaze on a cross positioned in the middle of the screen for 30 s, while minimizing eye blinks and movement. In the eyes closed task, participants were asked to close their eyes whilst still minimizing eye movement.
2.3.3. Strobe light task (VSSR).
Participants were exposed to a flashing strobe light that was positioned approximately 10 cm in front of their eyes. The strobe flashed at a frequency of 16, 19 and 23 Hz for a duration of 10 s at each of the stimulating frequencies. There were three blocks of stimuli, and in each block there were three repetitions of each stimulation frequency (in counter-balanced order). Between strobe presentations, participants were able to take a break until they were comfortable to proceed. Participants were instructed to keep their eyes open during the recording of each strobe presentation.
2.3.4. The discrepant auditory pattern task (MMN/P300).
We attempted to replicate the 'event-related potential local-global paradigm' from a study conducted by Beckinschtein et al (2009). Stimuli were auditory tones synthesized on the stimulus computer and delivered to the participant over air tube earphones. A low tone was synthesized by combining three pure tones of 350, 700, and 1400 Hz, and a high tone by combining three pure tones of 500, 1000, and 2000 Hz. Each tone had a duration of 70 ms (10 ms rise and fall envelope). Tones were organized into tone patterns, where each tone pattern was composed of a sequence of five tones spaced 80 ms apart, so that the total duration of a tone pattern was 670 ms. Two kinds of tone patterns were used in this task: a low-low (LL) pattern consisting of a sequence of five low tones, and a low-high (LH) pattern consisting of four low tones followed by one high tone. Participants were exposed to a total of eight stimulus blocks, where each stimulus block consisted of a sequence of 50 tone patterns, with a random-length interstimulus interval of between 1350 and 1650 ms occurring between every set of consecutive tone patterns in a block.
For each block, either the LL pattern or the LH pattern was randomly selected to be the target for that block. Participants were informed of what the target pattern was at the start of each block, and were instructed to listen out for the target pattern and maintain a silent count of the number of times the pattern occurred within the block. At the end of the block, the experimenter asked the participant to state how many target patterns they had observed (reported counts were recorded as a check on task compliance). The number of targets per block was randomly chosen to range between 8 and 12 targets in a block of 50 patterns. Targets occurred at pseudo-random positions in the sequence, with the proviso that no targets occurred in the first five positions in a block, and at least two non-targets occurred after every target. The total number of tone patterns in the task was 400, where there were 160 of each of LL and LH non-targets, and 40 of each of LL and LH targets.
2.3.5. Single finger movement task (ERD/ERS).
On each trial of the ERD task, the participant was required to tap a touch-sensitive pad on a response panel after a given prompt. Participants were instructed to place their hands in a comfortable position over the touch-sensitive response panel, with the index finger of each hand on the designated left and right response buttons. When the prompt to perform a movement occurred (see below), participants were instructed to lift the index finger of one hand directly upwards and then downwards to depress the button, while attempting to minimize movements of other parts of the hand or body. There were five blocks of 18 trials, in which each trial was constituted as described below (time points are given relative to the start of the trial at 0 s).
At the start of each trial, participants fixated on a cross displayed in the middle of the screen. The cross was displayed during the time interval 0–1 s, after which a target stimulus appeared super-imposed over the cross during the interval 1–3 s. The target stimulus consisted of a line drawing of either a left hand or a right hand against a white background, with the index finger highlighted in black. At 3 s, the target stimulus disappeared and simultaneously an auditory beep sounded to indicate the start of the response period. Participants were instructed to respond by performing a single finger tap onto the response panel button located below the target finger. Participants were instructed to use their left index finger if the target stimulus had depicted a left hand and their right index finger if the target had been a right hand. Participants were allowed up to 4 s to perform a finger movement. If the response panel detected a response during this period, the focal cross continued to be displayed for 2 s post-response. At the end of the response period, the word 'REST' was displayed on the screen until the end of the trial 4 s later. If no response occurred within 4 s of the sounding of the auditory beep, the response period was terminated automatically, and the word 'REST' was displayed for 4 s. Each trial was followed by an interstimulus interval of a random duration between 1 and 2.5 s.
2.4. Analysis
The EEG data from each system were loaded into MATLAB (Mathworks) using custom built functions. The EEG data recorded during breaks and instructions were discarded prior to analysis. Ocular, transient electromyographic, glossokinetic, movement artefacts, and channels containing frequent artefacts were manually removed from analysis. All data were re-referenced to the common average reference and resampled to 128 Hz, the lowest common sampling rate across the systems.
2.4.1. Noise floor.
Power spectra of EEG were obtained using Welch's modified periodogram (Welch 1967). The power spectra (half-overlapping 1 s windows) were calculated on raw EEG and frequencies common to all systems (0–64 Hz) were compared.
2.4.2. Spectral power and eyes open/eyes closed task.
Similar to section 2.4.1, power spectra of EEG were obtained using Welch's modified periodogram method. The power spectra were calculated on resting EEG (eyes open and eyes closed) and we then compared frequencies known to have a low likelihood of muscle contamination (Whitham et al 2007, Whitham et al 2008). For the Berger effect, the variable of interest is the ratio of alpha power with eyes closed to alpha power with eyes open, which is predicted to be significantly greater than one. As the individual alpha frequencies are known to differ between subjects (Klimesch et al 1993), the ratios used for analysis were calculated individually before being pooled. For each subject, a ratio of eyes closed and eyes open was calculated at each frequency in the alpha band (defined as 8–13 Hz, with 1 Hz resolution). Subsequently, the frequency at which the maximum power ratio between eyes closed and eyes open occurred was identified for each subject. Finally, the logarithms of the individual maximal power ratios were calculated over all subjects. The electrodes of interest were O1 and Oz.
2.4.3. Strobe task.
Similar to section 2.4.1, power spectra of EEG were obtained using Welch's modified periodogram, and the electrodes of interest were O1 and Oz. For each subject, average power at the three stimulating frequencies, 16, 19 and 23 Hz was measured.
2.4.4. Discrepant auditory pattern task.
A 1–20 Hz band-pass filter was applied to the data from the auditory MMN task. The data were then epoched from −1 to 0.7 s around the onset of the last tone in each set. The baseline period (−0.8 to −0.6 s) was then subtracted from each epoch. LL and LH data epochs were then characterized according to whether they represented targets (T) or non-targets (NT). The epochs in each condition (LL-NT, LL-T, LH-NT, LH-T) were then averaged. For statistical analysis of the MMN (local discrepancy), we calculated the difference between the mean waveform of the two LL conditions and the mean waveform of the two LH conditions at the frontal electrodes F3, F4, and Fz, and calculated the area under the curve during the period 100 to 150 ms and compared it to zero. For statistical analysis of the P300 (global discrepancy), we calculated the difference between the mean waveform of the two target conditions and the mean waveform of the two non-target conditions at the parietal sites P3, P4, and Pz, and calculated the area under the curve during the period from 250 to 450 ms and compared it with zero.
2.4.5. Single finger movement task.
Firstly, individual alpha and beta peaks were determined for use in further analyses. These were obtained from Fourier spectra in the wait period and were calculated per block, finger and channel. Subsequently, a complex Morlet wavelet transform (centre frequency of 1, bandwidth of 3) was calculated using the entire data in each block of trials. The data were then epoched from −7 to 3 s around a valid response. The epochs were then averaged (epochs from dominant finger and the non-dominant finger were separately averaged) and divided by the baseline period (4 to 3 s prior to the response). Individual alpha frequency and individual beta frequency powers were then used in calculating reductions in power (desynchronizations) and increases in power (synchronizations) before and after each finger movement in a subject.
2.5. Technical aspects
The duration of the setup procedure was recorded for each system. In addition, the hair thickness (visually graded as sparse or normal/thick) was noted by the experimenter to determine if it influenced signal conductance or lengthened impedance testing. We did not systematically study factors such as the comfort of the applied electrodes or the stability of the acquisition software.
3. Results
3.1. Noise floor
Noise floor spectra are shown in figure 2. In the Emotiv system, power at all measured frequencies was approximately 10- to 100-fold higher than with other systems. Very low power resonances (at 14 Hz and 41 Hz) were evident with the B-Alert system. Differences in the variability of spectra (standard deviations in figure 2) are indicative of differences in spectral power recorded from individual electrodes in each system.
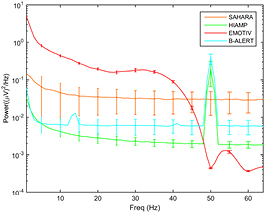
Figure 2. Noise floor of the g.HIamp, g.Sahara, B-Alert and Emotiv. Power values are displayed on a logarithmic scale. The units of the error bars are in standard deviations and presented at 5 Hz intervals.
Download figure:
Standard image High-resolution image3.2. Spectral power and eyes open/eyes closed tasks
Spectra for the four systems are shown in figure 3. Significantly higher power versus the g.HIamp was seen in all bands from delta (1–4 Hz) to beta1 (13–18 Hz) with Emotiv (table 2) and in the delta band with the Sahara (Modified-Bonferroni Wilcoxon paired signed rank analyses). While there are differences in power at higher frequencies (evident in table 3), the presence of electromyogram contamination is known to impact signal variability of EEG above around 20 Hz, both within and across subjects. Such variability is known to cause unsystematic differences that could be incorrectly interpreted as system-related, therefore the validity of comparisons of the higher frequencies cannot be assured and we have not included them here. Spectra revealed a reduction in power of the Emotiv system at frequencies above 35 Hz consistent with the inbuilt 45 Hz low pass filter.
Table 2. Means and standard deviations of spectral power (μV2 Hz−1) and the Berger effect (ratio: eyes closed/eyes open) measured by the EEG systems.
| g.HIamp | g.Sahara | B-Alert | Emotiv | |
|---|---|---|---|---|
| Delta band power |
3.35 ± 2.16 | 13.0 ± 13.70 |
3.77 ± 3.04 | 9.27 ± 6.01 |
| Theta band power |
2.02 ± 1.20 | 3.04 ± 4.25 | 2.47 ± 1.27 | 3.00 ± 2.02 |
| Alpha band power |
6.75 ± 4.47 | 5.21 ± 5.30 | 7.83 ± 4.62 | 15.2 ± 12.3 |
| Beta1 band power |
0.75 ± 0.36 | 0.49 ± 0.24 | 0.87 ± 0.41 | 1.48 ± 1.25 |
| Berger effect |
10.70 ± 4.95 | 9.37 ± 4.66 | 10.60 ± 5.37 | 9.27 ± 4.85 |
aWilcoxon signed rank test; significant versus the g.HIamp. bOne-way ANOVA; significant versus other systems. cSignificantly different, p < 0.05
Table 3. Means and standard deviations of the 16, 19 and 23 Hz VSSR for each EEG system. Units are in µV2 Hz−1.
| Stimulation frequency (Hz) | g.HIamp | g.Sahara | B-Alert | Emotiv |
|---|---|---|---|---|
| 16 | 4.69 ± 3.30 | 2.59 ± 1.94 |
7.75 ± 5.86 | 5.84 ± 5.03 |
| 19 | 4.09 ± 2.62 | 2.45 ± 1.61 | 6.83 ± 5.66 | 3.91 ± 2.84 |
| 23 | 2.44 ± 2.06 | 0.89 ± 0.75 |
3.63 ± 3.17 | 2.99 ± 1.77 |
aSignificant versus other systems, p < 0.05, Kruskal–Wallis ANOVA.

Figure 3. Spectra of resting (eyes open, eyes closed) EEG recorded from the g.HIamp, g.Sahara, B-Alert and Emotiv at the O1 electrode. The pronounced decline in amplitude at high frequencies in the Emotiv is due to the in-built 0.2–45 Hz band-pass and 50 Hz notch filters. The 50 Hz peak from the other systems is due to line noise. Power values are displayed on a logarithmic scale.
Download figure:
Standard image High-resolution imageAn independent samples t-test revealed that the mean log of the alpha peak power-ratios for all EEG systems were significantly different from zero (figure 4 and table 2). A one-way ANOVA found that the amplitude of the mean log of the alpha peak between the EEG systems was not statistically different (F(3) = 0.589, p = 0.623).
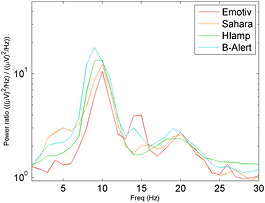
Figure 4. Spectra of the Berger effect (ratio: eyes closed/ eyes open) from the g.HIamp, g.Sahara, B-Alert and Emotiv at the O1 electrode. Power ratio values are displayed on a logarithmic scale.
Download figure:
Standard image High-resolution image3.3. Strobe task
All VSSRs were statistically greater than zero (table 3 and figure 5). However, a two-way ANOVA found main effects of EEG system and frequency. Individual ANOVAs were therefore carried out. The 16 and 23 Hz VSSRs from the g.Sahara were statistically smaller than from the g.HIamp, B-Alert and Emotiv (Kruskal–Wallis ANOVAs: 16 Hz, chi-sq(3) = 12.022, p < 0.05 and 23 Hz, chi-sq(3) = 25.875, p < 0.05). There were no main effects for the 19 Hz VSSRs.

Figure 5. Spectra of the 16 Hz (left), 19 Hz (middle) and 23 Hz (right) steady-state responses from the g.HIamp, g.Sahara, B-Alert and Emotiv at electrode O1. The spectra were 1/frequency corrected, where the interpolated power of successive minima were subtract
Download figure:
Standard image High-resolution image3.4. Discrepant auditory pattern task
The MMN and P300 could not be obtained from the Emotiv, i.e. this system did not have an electrode in a suitable position to measure the P300 (most often observed at parietal-central channels).While there were suitably placed channels for recording an MMN (Fz, F3, F4), further testing revealed the experimental setup provided inaccurate timing information (see discussion for more information). Given this, data from the Emotiv were not included in any further analyses. In the remaining EEG systems, MMNs and P300s were significantly different from zero (table 4 and figure 6). One-way ANOVAs comparing the g.Sahara, B-Alert and g.HIamp found no main effects for the MMN nor P300 responses (F(3) = 1.785, p = 0.154 and F(2) = 3.019, p = 0.055, respectively).
Table 4. Means and standard deviations of the MMN and P300 recorded for each EEG system. Units are in µV.
| g.HIamp | g.Sahara | B-Alert | |
|---|---|---|---|
| MMN | 7.54 ± 6.56 | 6.85 ± 6.97 | 4.83 ± 7.52 |
| P300 | 11.3 ± 11.8 | 7.44 ± 15.0 | 5.66 ± 18.1 |
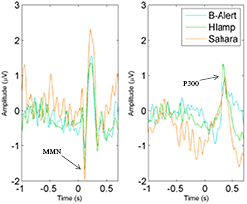
Figure 6. MMN (left) and P300 (right) from the g.HIamp, g.Sahara and B-Alert at channels F4 and Pz, respectively.
Download figure:
Standard image High-resolution image3.5. Single finger movement task
All event-related potentials were significantly different from zero in the three systems in which they could be measured (table 5 and figure 7). A two-way ANOVA found no main effects of EEG system or finger preference for the ERDs in the alpha and beta bands, nor the ERS in the beta band.
Table 5. Means and standard deviations of the mu desynchronization, beta desynchronization and beta synchronization recorded from each EEG system. Units are in µV.
| Hand | g.HIamp | g.Sahara | B-Alert | |
|---|---|---|---|---|
| Mu desynchronization | Preferred | − 0.91 ± 1.93 | − 2.04 ± 2.51 | − 1.54 ± 1.56 |
| Non-preferred | − 1.47 ± 1.96 | − 2.19 ± 2.51 | − 1.89 ± 2.07 | |
| Beta desynchronization | Preferred | − 1.23 ± 1.39 | − 1.21 ± 1.43 | − 2.17 ± 0.97 |
| Non-preferred | − 1.72 ± 1.31 | − 1.25 ± 1.10 | − 1.80 ± 0.61 | |
| Beta Synchronization | Preferred | 1.57 ± 1.28 | 1.77 ± 1.74 | 1.56 ± 1.56 |
| Non-preferred | 1.49 ± 1.43 | 0.30 ± 0.74 | 0.97 ± 0.95 |
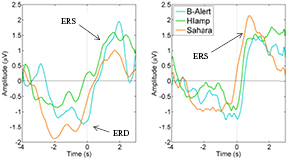
Figure 7. ERS/ERD in the mu (left) and beta band (right) from the g.HIamp, g.Sahara and B-Alert at the C3 and C4 channel (relevant channel to preferred hand were averaged).
Download figure:
Standard image High-resolution image3.6. Set-up time
There were differences in set-up times for the EEG systems (one-way ANOVA, main effect of system, F(4) = 11.901, p < 0.01). Set-up times of the B-Alert and g.HIamp were significantly longer than the Emotiv and g.Sahara (table 6). Furthermore, in a comparison of hair thickness and EEG system a two-way ANOVA found a main effect for both hair thickness (F(1) = 5.308, p < 0.05, and EEG system, F(4) = 14.355, p < 0.01). Post-hoc tests found that hair thickness lengthened the set-up time for the B-Alert, 95% confidence interval [3.92, 13.41], and g.HIamp, 95% confidence interval [2.49, 12.86].
4. Discussion
4.1. g.Sahara
The results showed that the g.Sahara was able to successfully demonstrate the Berger effect. Overall, spectral power was found to be similar to that of the other systems investigated. However, the g.Sahara exhibited elevated delta band power, that we speculate, because of its frequency, may have been due to subtle pulse artefact (Schomer and Lopes da Silva 2011), perhaps being expressed more in the absence of conductive paste. In view of the presence of high delta band power, this EEG system should be avoided in studies, such as sleep studies, in which delta band power is an important feature. The high power delta frequency oscillations detectable during raw EEG recordings may be a regular feature of this system, but it did not affect any of the within-subject normalized EEG responses we measured, including those of low frequency (e.g. Berger effect and P300).
The g.Sahara was also able to demonstrate the VSSR; however, it was less sensitive to strobe stimulation relative to the other EEG systems, so that longer periods of data collection may be required to average out apparent noise (Kappenman and Luck 2010). The results for the event-related phenomena (MMN, P300 and ERD/S) showed that the g.Sahara is suitable for use in event-related paradigms, as it was able to detect each of the expected phenomena successfully.
4.2. Emotiv
The Emotiv was able to demonstrate the Berger Effect, exhibiting similar spectral power as the other systems, up to the limits of the Emotiv's frequency range at about 45 Hz. As was the case with the g.Sahara, the Emotiv exhibited elevated delta band power; as with the g.Sahara, we would therefore caution against the use of this system in studies where low-frequencies are important. Similarly, the high power delta frequency oscillations were detectable during raw EEG recordings and need to be accepted as a feature when recording. The Emotiv also exhibited greater theta, alpha and beta1 band power. We suspect the explanation is due to the high noise floor of the Emotiv, which was significantly greater than the noise floor of the other EEG systems and close to the power in spectra at 20–30 Hz. The Emotiv was also able to demonstrate the VSSR with equal sensitivity to that of the research-grade g.HIamp.
We were unable to use the Emotiv to obtain event-related phenomena. We used a serial port to communicate stimulus-timing information from the stimulus presentation computer to the EEG recording computer. This resulted in poorly synchronized timing information, a problem that became clear only after the completion of the study. Therefore, our study did not provide evidence to support the use of Emotiv in paradigms that rely on time-locked events. Others have reported acquiring event-related responses with the Emotiv EPOC using custom acquisition software (Tahmasebzadeh et al 2013).The Emotiv EPOC includes a software development kit that makes it possible to incorporate recorded data into custom software. An alternative solution that might improve synchronization would be to run the stimulus presentation and EEG recording on the same computer using a virtual serial port to communicate between the two applications.
4.3. B-Alert
The B-Alert was shown to be the closest in behaviour to a research-grade system out of the three 'non-traditional' systems. It was shown to have a noise floor similar to that of the g.HIamp, albeit with a 14 Hz and 41 Hz peak that we are unable to explain. Although their cause is not known, the spectral peaks are at least 100 times smaller than EEG signals, so we do not consider them an important issue for any data collection. Moreover, it was able to demonstrate the Berger Effect, VSSR and all event-related phenomena with no significant differences from the research-grade g.HIamp, and without the low-frequency elevated power present in the other two systems. However, the B-Alert required a significantly longer set-up time than the g.Sahara or Emotiv. Overall, it is suitable for use in EEG research under any of the paradigms investigated here.
5. Conclusion
This study has provided evidence that EEG research data collection can be successfully accomplished using equipment other than traditional research-grade EEG systems and therefore utilized in a variety of different experimental settings (table 7). In selecting a system to use in a specific research context, researchers should consider not only the need for ease of application, low cost or mobility, but also possible restrictions on coverage and flexibility due to limited number and placement of electrodes, as well as the capability of a system to detect a particular EEG phenomenon of interest.


Acknowledgments
The Brain Signals Laboratory was partially funded by an equipment grant from The Wellcome Trust, London, UK. Project support has been provided by the National Health and Medical Research Council, Flinders University, Flinders Medical Centre Foundation, the Australian Research Council and the Defence Science and Technology Organisation (DSTO), who provided the B-Alert and relevant funding under research agreement 363863 between Flinders University and the DSTO.