

Abstract
In this paper extensive research on the polyurethane shape memory polymer (PU-SMP) is reported, including its structure analysis, our experimental investigation of its thermomechanical properties and its modelling. The influence of the effects of thermomechanical couplings on the SMP behaviour during tension at room temperature is studied using a fast and sensitive infrared camera. It is shown that the thermomechanical behaviour of the SMP significantly depends on the strain rate: at a higher strain rate higher stress and temperature values are obtained. This indicates that an increase of the strain rate leads to activation of different deformation mechanisms at the micro-scale, along with reorientation and alignment of the molecular chains. Furthermore, influence of temperature on the SMP's mechanical behaviour is studied. It is observed during the loading in a thermal chamber that at the temperature 20 °C below the glass transition temperature (Tg) the PU-SMP strengthens about six times compared to the material above Tg but does not exhibit the shape recovery. A finite-strain constitutive model is formulated, where the SMP is described as a two-phase material composed of a hyperelastic rubbery phase and elastic-viscoplastic glassy phase. The volume content of phases is governed by the current temperature. Finally, model predictions are compared with the experimental results.
Export citation and abstract BibTeX RIS
1. Introduction
The development of shape memory materials is in high demand, thanks to their various functions such as sensing, actuating and crack-healing. Among various kinds of shape memory materials, the shape memory polymer has recently become the centre of attention due to its good physical properties and favourable economical indicators [1, 2]. The functional properties of SMPs are related to the glass transition in which the characteristics of the polymer behaviour are affected by molecular motion that varies, depending on the temperature. It also influences the mechanical properties in a way that the elastic modulus and the yield stress are high at temperatures below the Tg and low above it. If the SMP is deformed at a temperature above Tg and cooled down to a temperature below Tg by holding the deformed shape constant, the deformed shape is fixed, and the polymer can carry a large load. If the shape-fixed element is heated up afterward to a temperature above Tg under no load, it recovers its original shape and properties [3].
Among the SMPs, shape memory polyurethane has most often been used in practice due to its competitive mechanical and shape memory properties in comparison to other polymers, e.g. high specific strength, high parameters of shape fixity and recovery and transition temperature that could be fixed around the room and body temperature [4, 5]. In addition, the production of shape memory polyurethane is relatively easy and inexpensive in comparison to other shape memory materials, in particular shape memory alloys (SMA) [1–3].
The functional properties of PU-SMPs, essential for the applications, are caused by their particular structure. Shape memory thermoplastic polyurethanes are block copolymers composed of hard and soft segments distributed randomly within the volume element [4]. The presence of hard domains plays a very important role in shaping the inelastic properties of polyurethane by creating physical bonds enhancing crosslinking of the polymer chains. With the increased volume fraction of domains dominated by hard segments, these domains are better cross-linked and interconnected. At temperatures below Tg, the mobility of the individual chains is significantly reduced due to enhanced cross-linking, and during deformation the chains/segments cooperate with each other. Thus, the deformation of the material requires much more energy than it does at higher temperatures. In the case of the loading above Tg the deformation is caused mostly by changes in the alignment of polymer chains, which deform independently of each other and do not require as much energy as below Tg [3, 4]. As is seen, the temperature is a key factor for the SMP thermomechanical response.
Moreover, the PU-SMPs are visco-plastic materials. They are not only very sensitive to the temperature variation but are also sensitive to the strain rate. Since their thermomechanical characteristics are used in the design of temperature sensors and actuators, which work in various thermal and mechanical regimes, it is important to investigate their properties in various conditions [1–6].
Therefore, in order to gather complete information required for the SMP analysis and modelling, the experimental data obtained during the loading should contain a stress–strain response, taking into account the temperature variation. Since the SMP glass transition temperature is rather low (often close to the room temperature), the thermal effects accompanying the deformation process can strongly influence the SMP mechanical properties. Furthermore, in order to evaluate the SMP properties in various conditions, the experiments should be performed at the temperatures significantly below as well as above Tg. Such complete studies on the SMP that also encompass the effects of thermomechanical couplings seem to be scarce. The main reason is that estimation of the SMP sample temperature during the deformation process requires an adequate methodology and rich experience in using infrared techniques. Some experimental data and thermomechanical analysis on this issue are available in the literature for common polymers, e.g. poly(methyl methacrylate) (PMMA) and polycarbonate (PC) [7–11]. The effect of strain rate on thermomechanical behaviour of these polymers subjected to compression is investigated in [8]. Using an infrared camera and thermocouples the authors measured the temperature changes accompanying the polymer's deformation and estimated the fraction of plastic work converted into heat. In the case of polycarbonate this fraction was found to be within the range of 0.5–0.6 for the strain rates ranging from 400 s−1 to 2500 s−1. Experimental studies on the effects of thermomechanical couplings in polyamide subjected to tension have been reported by Pieczyska et al in [9]. Arruda et al studied the effects of strain rate, temperature and thermomechanical coupling on the finite-strain deformation of glassy polymers [10]. Adams and Farris studied calorimetrically the latent heat of deformation of polycarbonate. The results have shown that changes of internal energy for deformation depend inversely on the strain rate [11].
In spite of the research concerning the effects of thermomechanical couplings in common crystalline polymers, to the authors' knowledge, there is still a lack of studies on these effects regarding shape memory polymers. Although the mechanical properties of shape memory polymers have been recently studied in many research centres [1–3, 5, 12–14], only a few papers have investigated the thermal effects accompanying the deformation process. Regarding the research conducted to date on the SMP, most of the results presented in literature have been obtained in room conditions [3–6] or only at elevated temperature (i.e. at or above Tg) [3]. In this paper the results of the tests performed below room temperature are also presented.
The main objective of the paper is to show and discuss selected results of experimental and theoretical investigation of the PU-SMP under mechanical loading carried out at various strain rates in various conditions (at Tg, at the temperature 20 °C below and at the temperature 20 °C above Tg). For the tests performed at room temperature the effects of thermomechanical couplings are taken into account.
The paper is organized as follows: in section 2, details about the SMP material, its structure and properties delivered by dynamic mechanical analysis, differential scanning calorimetry and wide angle x-ray scattering tests are described. In section 3, a short description of the general experimental procedure is given. The obtained results for the SMP subjected to loading in various conditions, including tension in the thermal chamber at different temperatures, are presented in section 4. In section 5, influence of the strain rate and the test temperature on the SMP's properties is discussed. Next, the background of the constitutive model, followed by a comparison of the numerical and experimental results under different loading rates and at various temperatures, is presented in section 6. Finally, the concluding remarks are enclosed in section 7.
2. Characterization of the PU-SMP structure
The investigation was conducted on a new multifunctional material: shape memory polyurethane, produced by SMP Technologies Inc., Tokyo, Japan, denoted as PU-SMP MM 2520. To stay concise, a more detailed report on the studies will be provided elsewhere; here, we report only the most important outcomes.
Dynamic mechanical analysis (DMA) revealed the glass transition temperature at 25 °C as the middle of the E' modulus drop (figure 1) and at 19 °C, determined as the tan δ peak (figure 1). In the presented studies the value 25 °C was assumed as the SMP glass transition temperature. The apparent activation energy of the transition Ea calculated at multiple frequencies, according to the Arrhenius equation, was determined as 365.66 kJ mol−1 (inset in figure 2).
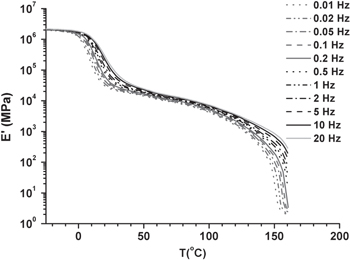
Figure 1. Multifrequency E' plots recorded in a DMA experiment with a step temperature increase (step 2 °C, soak 300 s).
Download figure:
Standard image High-resolution image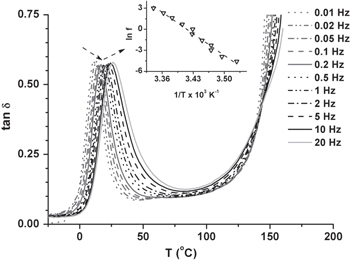
Figure 2. Multifrequency tan δ plots recorded in a DMA experiment with a step temperature increase (step 2 °C, soak time 300 s). The inset graph represents the Arrhenius plot for the α-relaxation associated with the glass transition.
Download figure:
Standard image High-resolution imageThe multifrequency DMA analysis, wide angle x-ray scattering (WAXS) and differential scanning calorimetry (DSC) studies indicate that the PU-SMP consists of an amorphous physical network containing clusters cross-linked with hydrogen bonds. In the DMA analysis, the presence of hydrogen bonds is manifested in particular by changes of the tan δ peak with frequency. With increasing frequency the tan δ peak is shifted to higher temperatures; however, amplitude of the tan δ peak decreases at low frequencies and increases at high frequencies (figure 2). Another indication of the presence of hydrogen bonds is the occurrence of a very small peak around 80 °C on low frequency tan δ plots (figure 2) and a small, 2.3 Jg−1 DSC endothermic peak at 67 °C (not shown), which were attributed to destruction of the hydrogen-bonded clusters. Usually, interurethane hydrogen bonds begin to break in this temperature region [15]. Moreover, there may also be some permanent (chemical) crosslinks in the structure. It is indicated by the fact that despite above 125 °C the polymer film elongates appreciably, tan δ increases substantially (figure 2) [16–18], and the E' modulus decreases below 104 MPa (figure 1), the sample does not break. There is also a tendency of the E' modulus to reach a plateau at high temperatures.
In WAXS studies, an amorphous state of the PU-SMP was evidenced by the presence of a single broad symmetric amorphous halo at scattering angle 2θ = 22° and by the lack of crystal diffraction peaks (figure 3). The position of the amorphous halo was similar as that found in other amorphous PU systems [19]. The existence of hydrogen-bonded clusters was revealed by the presence of an additional very weak scattering peak at 2θ = 11° (figure 3), indicating a very small fraction below 0.1% of a phase characterized by low structural symmetry, showing periodicity only in one direction 〈00l〉.
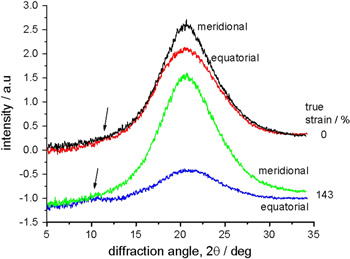
Figure 3. Intensity profiles determined along meridional (drawing) and equatorial directions from 2D WAXS images registered at no strain (upper curves) and under 143% strain. An arrow indicates a weak peak attributed to the phase of low structural symmetry.
Download figure:
Standard image High-resolution imageMoreover, 2D WAXS images recorded with a two-dimensional detector were used for characterization of structure orientation with the commonly used Herman's factor [20]. They revealed the presence of weak initial orientation, which increased upon unidirectional deformation. The increase in orientation was accompanied by changes in the mean intermolecular distance: d-spacing, determined from the 2θ position of the respective scattering peak. In the case of the amorphous phase, one-directional deformation led to a decrease in d-spacing below the initial 4.07 Å, whereas in the case of the clusters phase, deformation led to an increase in d-spacing above the initial 7.7 Å, being the periodicity length along the drawing direction 〈00l〉. Moreover, it was revealed that unidirectional deformation did not induce crystallization, which is manifested as a lack of appearance of any diffraction peaks. The absence of crystal diffraction peaks was evidenced irrespective of the strain rate applied, although the influence of strain rate on the mechanical, thermal and optical behaviour was observed (sample whitening at high strain ranges; see figure 7, photographs 3, 4).
3. Thermomechanical characterization of PU-SMP
In order to estimate the thermomechanical properties of the PU-SMP in different conditions, a specially designed loading program has been conducted on a MTS 858 testing machine. Namely, the shape memory polyurethane samples have been subjected to tension performed with various strain rates at room temperature (approximately 23 °C) as well as in a thermal chamber at three different constant temperatures: at 5 °C (Tg − 20 °C), at 25 °C (Tg) and at 45 °C (Tg + 20 °C). The tests carried out in a thermal chamber characterize the SMP's thermomechanical behaviour, providing crucial information also needed for the parameter identification procedure of the developed PU-SMP model (see section 6). The tests performed in room conditions also enable estimation of the effects of thermomechanical couplings accompanying the PU-SMP deformation process. To this end, a fast and sensitive ThermaCAM PhoenixTM FLIR infrared camera was used. A scheme of the experimental set-up is shown in figure 4.

Figure 4. Scheme of experimental set-up used for investigation of mechanical and temperature characteristics of the shape memory polymer at room temperature.
Download figure:
Standard image High-resolution imageThe IR thermography technique allows the determination of the temperature of the studied object on the basis of the energy emitted from its surface. The main advantage of the technique is the non-contact real-time measurement of the surface temperature distribution. Therefore, the IR thermography is widely used in many scientific and industrial applications. The thermal effects accompanying the deformation process are studied in many papers; however, they are mainly studied for metallic materials [21–27]. The accurate determination of the temperature distribution on the surface of the tested material requires the knowledge of the value of its emissivity. For the purpose of this study, the coefficient of emissivity of the PU-SMP was determined. To do this, part of the strip made of the SMP was covered by soot with the high and well-defined emissivity of 0.955. The sample surface (covered and non-covered) was then observed using the Phoenix IR camera with a InSb detector with the spectral range of 3–5 μm (figure 5).
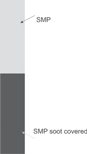
Figure 5. Illustration of the PU-SMP sample prepared to estimate its coefficient of emissivity.
Download figure:
Standard image High-resolution imageThe temperature of the covered part was determined using the known emissivity value for the soot. Then, for the non-covered surface, the emissivity value was adjusted to produce the same temperature reading. The obtained coefficient of emissivity value for the tested PU-SMP was equal to 0.96. The analyses were performed at both room temperature (approximately 23 °C) and at 40 °C, giving the same results. This means that in the studied temperature range the emissivity change is unnoticeable and can be treated as a constant value. Using the determined value of the coefficient of emissivity, the SMP's temperature changes can be calculated and presented as a function of time or of other parameters. During the loading the mechanical and thermal parameters were recorded with high accuracy.
The strain was determined on the basis of the grip displacement Δl. Since the samples were flexible it was not possible to use the mechanical extensometer. Therefore, the dedicated grip preventing the sample slipping was designed. The lack of the slip was verified by markers drawn on the sample surface. Let us note that the stiffness of the loading set-up was much higher than the stiffness of the sample; thus, the elastic deformation of the set-up can be neglected.
The stress and strain quantities presented in the following diagrams are related to the current (instantaneous) values of the sample cross section, resulting in so-called 'true stress' and 'true strain' values according to the formulae


where l0 denotes initial gauge length, Δl: the crosshead displacement, F: the instantaneous force and S0: the initial cross-sectional area.
In figure 6 the stress and temperature change versus strain obtained for strain rates 2 × 100 s−1 within strain range 0.6 is presented. It can be observed that after a small drop in temperature: approximately 0.1 °C (thermoelastic effect), the sample temperature increases up to 1.7 °C for the applied strain rate and the strain range. During the subsequent unloading with the same strain rate the sample temperature remains almost constant, and even an insignificant effect of thermoelastic unloading can be noticed [28]. In the same figure the thermal images corresponding to the different strain values during the loading-unloading cycle are presented. The uniform temperature distribution on the sample surface indicates that the deformation process is macroscopically homogeneous (in this strain range). The sequence of thermal images has been used to calculate the mean temperature of the sample during the process. The mean temperature values were obtained from the internal area of the sample surface, thus excluding the boundary effects. Both the mechanical and thermal data were recorded with the same frequency, chosen depending on the strain rate. For strain rates 2 × 100 s−1 and 2 × 10⁻¹ s−1 the frequency was equal to 269 Hz and 134 Hz, respectively.

Figure 6. Stress and temperature change versus strain during the PU-SMP loading-unloading cycle at strain rate 2 × 100 s−1. In addition, thermal images and sizes of the sample surface corresponding to different strain values are presented.
Download figure:
Standard image High-resolution imageThe experimental data presented in the following sections of the paper are curves selected from the three tests elaborated for each testing conditions. The error bars in figures 10 and 11 represent the standard deviation of the mean value.

Figure 7. Results obtained for PU-SMP tension performed at room temperature with strain rate 2 × 10⁻² s−1 until the sample rupture: (a) photographs of the sample in the grips of the testing machine showing subsequent stages of deformation; (b) stress and temperature change versus strain (numbers 1–4 refer to the photographs above); inset shows the initial stage of deformation.
Download figure:
Standard image High-resolution image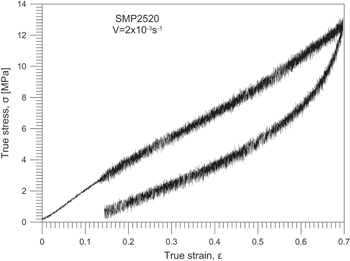
Figure 8. Stress versus strain curve obtained for PU-SMP tension at strain rate 2 × 10⁻³ s−1.
Download figure:
Standard image High-resolution image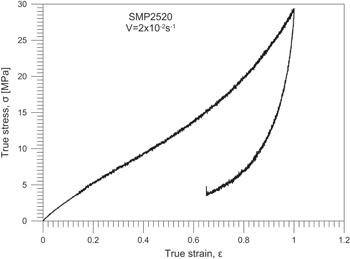
Figure 9. Stress versus strain curve obtained for PU-SMP tension at strain rate 2 × 10⁻² s−1.
Download figure:
Standard image High-resolution image
Figure 10. Stress and temperature change versus strain curves obtained for PU-SMP tension at strain rate 2 × 10⁻¹ s−1. The error bars represent the standard deviation of the mean value.
Download figure:
Standard image High-resolution image
Figure 11. Stress and temperature change versus strain curves obtained for PU-SMP tension at strain rate 2 × 100 s−1. The error bars represent the standard deviation of the mean value.
Download figure:
Standard image High-resolution image4. Experimental results of PU-SMP loading in various conditions
4.1. PU-SMP in tension at room temperature—investigation of thermomechanical couplings
An example of the results obtained for PU-SMP tension performed at room temperature with the strain rate 2 × 10⁻² s−1 until the sample rupture is shown in figure 7. The photographs of the SMP sample in the grips of the testing machine showing subsequent stages of the tensile process are presented in figure 7(a), while the stress versus strain and their related average temperature changes are shown in figure 7(b). The subsequent stages of the deformation process are denoted on the stress–strain curve by numbers 1–4.
For this strain rate the maximal temperature change, recorded during the sample rupture, is 3.8 °C (figure 7(b)). The presented pictures, as well as the diagram, show high elastic properties of the polymer. During the initial elastic deformation a small drop in temperature of about 0.06 °C was recorded (see the inset of figure 7(b)) [15]. At higher strains up to the true strain value of about 0.8, the PU-SMP macroscopically exhibits a smooth, hardening-like behaviour. The hardening is related to the reorientation of the polyurethane molecular chains. This was evidenced in the 2D-WAXS analysis as changes in the Herman's orientation factor, accompanied by an increase in periodicity length of the clusters and a decrease in the intermolecular distances between chains of the amorphous phase (see section 2) [13, 30, 37, 38]. At the higher strains a significantly higher slope of the curve is observed related to the sample whitening (figure 7(a), photographs 3, 4), [15]. This effect is most probably caused by phase separation or the appearance of microvoids called cavitations [29], since the WAXS analysis did not show that crystallization phenomenon takes place. The same observation was made in [29], when WAXS did not show crystallization but indicated the orientation of the polymer structure (oriented low symmetry phase) toward the tensile direction. The 'whitening stage' is evolved in the sample necking (figure 7(a), photograph 4) and damage [15]. It was also observed that almost immediately after the rupture and rapid unloading of the sample, the SMP returns to its former, initial colour and transparent nature.
Taking into account the results obtained during the PU-SMP tension performed until the sample rupture (figure 7) for the loading-unloading tension cycles the true strain ranges equal to 0.7, 1 or 1.18 were chosen. The stress–strain curves obtained for the strain rates 2 × 10⁻³ s−1 and 2 × 10⁻² s−1 within the true strain 0.7 or 1 are shown in figures 8 and 9, respectively.
At the higher strain rates, higher stress was observed for the same strain range. According to the effects of thermomechanical couplings, it was obtained from the infrared camera that the temperature change at the strain rate 2 × 10⁻² s−1 within the studied strain range up to 1.18 is below 2 °C (figure 7(b)). It means that for the lower strain rates the process can be considered as isothermal. Therefore, the temperature change has not been estimated for the tests presented in figures 8 and 9.
The stress and temperature changes as a function of strain for strain rates 2 × 10⁻¹ s−1 and 2 × 100 s−1 are presented in figures 10 and 11, respectively. It is seen that after the small drop in the sample temperature due to the thermoelastic affect both the stress and temperature change increase with the strain [31]. For the tests performed with strain rates 2 × 10⁻¹ s−1 and 2 × 100 s−1 the maximal obtained values of the temperature changes are 5.45 °C and 8.75 °C, respectively. The error bars representing standard deviations of the mean value show low discrepancy of the results.
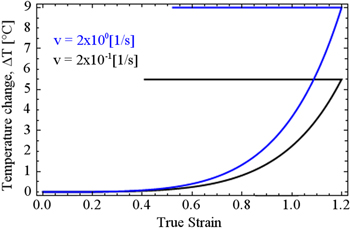
A comparison of the temperature changes versus strain elaborated at strain rates 2 × 10⁻¹ s−1 and 2 × 100 s−1 is presented in figure 12. As could be expected, higher values of the thermoelastic effect and higher increments in temperature are observed for the higher strain rate when the deformation process proceeds closer to adiabatic conditions.
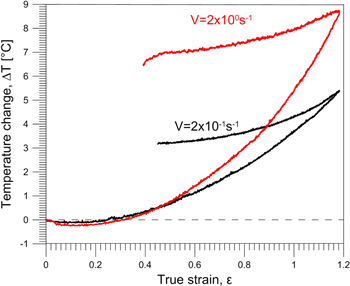
Figure 12. Comparison of temperature versus strain curves obtained for PU-SMP tension with two different strain rates in room conditions.
Download figure:
Standard image High-resolution imageFigure 13 presents a comparison of the stress versus strain curves obtained at various strain rates and strain ranges in room conditions.

Figure 13. Comparison of stress versus strain curves obtained for PU-SMP tension at various strain rates and strain ranges in room conditions.
Download figure:
Standard image High-resolution imageWith the increase in the strain rate, the stress during loading becomes significantly higher. In turn, during the unloading, a lower stress is recorded at the higher strain rate, so the stress versus strain curve obtained for the lower strain ranges are internal loops of the curve obtained for the higher strain rate 2 × 100 s−1 (figure 13). The observed widening of the stress–strain loops with the increasing strain rate manifests as an augmented contribution of the dissipative mechanisms active during the PU-SMA loading [11].
4.2. PU-SMP in tension at constant temperature—influence of strain rate on the mechanical characteristics
Next, the influence of the strain rate on the SMP mechanical behaviour was investigated in a thermal chamber at constant temperature equal to 25 °C, i.e. at the glass transition temperature. The chamber was used to eliminate the effect of the varying surroundings' temperature. The results elaborated for strain rates 2 × 10⁻⁴ s−1, 2 × 10⁻³ s−1, 2 × 10⁻² s−1 and 2 × 10⁻¹ s−1 within the true strain range of approximately 0.7 are compared in figure 14.

Figure 14. Stress versus strain obtained for PU-SMP tension performed with various strain rates at constant temperature 25 °C.
Download figure:
Standard image High-resolution imageThe results confirm the tendency observed for the tension tests performed in room conditions that during the loading-unloading cycle the width of the hysteresis loop increases with the strain rate (figure 13). However, it is also seen that the width of the loops for 2 × 10⁻⁴ s−1 and 2 × 10⁻³ s−1 is almost the same, and the significant widening of the loop is observed for the strain rates above 2 × 10⁻³ s−1 (figure 14). In other words, up to 2 × 10⁻³ s−1 the studied PU-SMP can be treated as a strain-rate-independent material. The performed analysis of the hysteresis loops is an important result in terms of the PU-SMP applications as energy absorbers, and it will be presented by the authors in the following paper.
4.3. PU-SMP in tension in a thermal chamber with constant strain rate—influence of temperature on the mechanical characteristics
In order to investigate the influence of temperature on the PU-SMP mechanical properties, the following tension tests have been conducted with the same strain rate 2 × 10⁻³ s−1 at various constant temperatures: 45 °C (Tg + 20 °C), 25 °C (Tg) and 5 °C (Tg − 20 °C) and, additionally, at 19 °C. The obtained results presented as the stress–strain curves are shown in figure 15. As could be expected, the mechanical response observed below and above the glass transition temperature is entirely different. The maximal stress obtained for the same strain rate at the temperature Tg − 20 °C = 5 °C is over six times higher than those obtained at Tg + 20 °C = 45 °C.
Moreover, it is seen that well below the Tg the shape recovery of PU-SMP is almost not observed; the material demonstrates typical elasto-plastic properties, whereas above the Tg the PU-SMP exhibits very good shape recovery and superelasticity behaviour, related to the micro-Brownian motion of soft segments, active at high temperature [4].
5. Influence of strain rate and test temperature on PU-SMP thermomechanical properties—discussion
A summary of the maximal stresses and the estimated maximal temperature changes obtained for the reversible loading within true strain 1.18 at various strain rates is presented in table 1.
Table 1. Maximal stress and temperature changes obtained for the PU-SMP during tension within strain range 1.18 at various strain rates.
| Strain rate | Strain range | Maximal stress of loading (MPa) | Residual strain (after unloading) | Maximal temperature change (°C) |
|---|---|---|---|---|
| 2 × 10⁻² s−1 | 1.18 | 43.6 | — | 2.35 |
| 2 × 10⁻¹ s−1 | 1.18 | 44.0 | 0.49 | 5.45 |
| 2 × 100 s−1 | 1.18 | 57.7 | 0.43 | 8.75 |
As could be expected, the higher strain rate is accompanied by the higher temperature change. There are two main reasons for the temperature increase: the decreasing heat transfer through the sample and between the sample and the surroundings (due to the shortening of the process duration), as well as the increasing contribution of dissipative mechanisms of deformation at the level of the PU-SMP microstructure. In this case, such mechanisms are probably associated with internal friction and breaking of hydrogen bonds. The increasing contribution of the thermal dissipation to the total energy expended on the irreversible deformation with the increasing strain rate is known from the literature. Adams and Farris have shown for polycarbonate strained in the calorimeter that the internal energy change inversely depends on the strain rate [11]. This means that the ratio of thermal dissipation to the total energy of irreversible deformation increases. Moreover, observed widening of the stress–strain loop, i.e. increase of the total energy expended on irreversible deformation, can also intensify the observed effect.
The influence of thermomechanical coupling on the mechanical characteristics seems to be significant, especially at higher strains where it accompanies the sample necking, localization and rupture. As reported in [15], at the true strain equal to 1.6 and at the strain rate 2 × 100 s−1 the temperature change exceeds 20 °C. Such a temperature increase can lead to shifting of the sample state into the SMP rubbery region and, in consequence, evoke a significant stress decrease. Further on the stress decrease is followed by its subsequent increase, observed just before the sample damage.
In the case of the equal strain range the results reveal that a higher strain rate leads to a more instant recovery. Such SMP behaviour is probably caused by the return of the stretched polymer chains closer to equilibrium in a coiled state (conformation). Similar results were obtained in [3], where the PU-SMP, also produced by SMP Technologies Inc., was subjected to tension with various strain rates and at various temperatures, i.e. in the range of and above Tg (usually easier to control). The tendency obtained for the influence of the strain rate and the temperature was the same as in the present research. Nevertheless, no measurements of the sample temperature changes accompanying the deformation process were reported in [3], so the effects of thermomechanical couplings cannot be compared.
Table 2 presents a summary of the maximal stress and strain recovery values estimated for the PU-SMP reversible loading within true strain 0.73 carried out at the strain rate 2 × 10⁻³ s−1 at various constant temperatures.
Table 2. Summary of maximal stress and strain recovery estimated for the PU-SMP at strain rate 2 × 10⁻³ s−1 at various constant temperatures.
| Strain rate | Strain range | Average temperature of thermal chamber (°C) | Maximal stress of loading (MPa) | Residual strain after unloading |
|---|---|---|---|---|
| 2 × 10⁻³ s−1 | 0.73 | 5 | 45.2 | 0.60 |
| 2 × 10⁻³ s−1 | 0.73 | 19 | 20.3 | 0.09 |
| 2 × 10⁻³ s−1 | 0.73 | 25 | 13.6 | 0.14 |
| 2 × 10⁻³ s−1 | 0.73 | 45 | 8.0 | 0.02 |
As is shown in figure 15, at the low temperature (5 °C) the polymer is getting closer to the elasto-plastic material behaviour. Namely, a more distinct yield point is observed, and the shape of the stress–strain curve is similar to metals or alloys. It is probably caused by the significant contribution of the hard segment's structure below Tg temperature [3, 4, 13]. However, some shape recovery (≈10%) recorded during the unloading is an indicator of a participation of viscosity related to an activity of the soft segments in the shape memory polymer structure (figure 15).
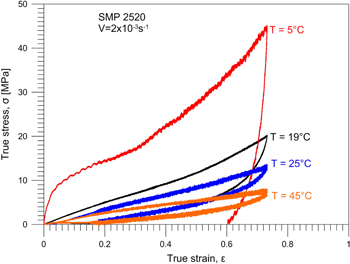
Figure 15. Comparison of stress versus strain curves obtained for SMP subjected to tension with strain rate 2 × 10⁻³ s−1 at various temperatures 45 °C (Tg + 20 °C); 25 °C (Tg); 19 °C; 5 °C (Tg − 20 °C).
Download figure:
Standard image High-resolution imageConcerning the shape recovery, the residual strain obtained after the loading up to the true strain 0.73 and unloading at the same strain rate 2 × 10⁻³ s−1 at temperature Tg − 20 °C = 5 °C is approximately four times higher than those obtained at a higher temperature at Tg or at Tg + 20 °C = 45 °C. On the other hand, it was also noticed that at the high temperature (45 °C) the shape recovery is almost complete (figure 15) such as that observed in SMA [26, 27]. In the case of superelasticity in SMA, the austenite phase is stable at high temperatures, and the stress-induced martensitic phase returns to the austenite phase during unloading, resulting in the shape recovery, whereas the SMP at high temperatures is in the rubbery state, and the micro-Brownian motion of soft segments is activated [4]. The deformed shape is therefore recovered during unloading.
Taking into account the regularity of the observed effects and repeatability of the obtained mechanical and thermal responses, it should be emphasized that the PU-SMP MM2520 is a very well-prepared material, exhibiting high mechanical and shape memory properties.
6. Modelling of shape memory polyurethanes—constitutive model foundations, parameters identification and comparison to experimental results
In the literature some works are found concerning the characterization toward applications of various types of shape memory polymers [13, 32]. Much less work is dedicated to modelling of these materials [12, 33]. One of the first proposals is a 1D model, discussed in [34, 35]. Basically, two categories of models can be distinguished: approaches in which the SMP is described as a two-phase material [14, 36, 41–45] in which, following the temperature changes, the phase transition takes place, and the thermoviscoelastic phenomenological models treat the SMP as a homogeneous material [46–50]. The first type of models seems to be better founded on physical grounds. Respective models are proposed in the small deformation format [14, 44, 45, 53, 54] as well as in the large deformation format [33, 41, 45, 48, 50]. Taking into account the strain regimes considered in the reported experiments the large strain formulation is necessary. In recent years, increasing activity can be observed in the scientific community in the field of SMP modelling [51–56], and there is still much work to be done in this field, especially concerning the cyclic thermomechanical response of the SMP in a large strain regime.
Taking into account the features of the analysed SMP material, such as the presence of soft and hard segments and the separation of the respective domains [4, 38, 39], the selected approach belongs to the first category of models mentioned above. We mainly follow the proposal outlined in [36] and adopted in [15, 40]. Thus, at a given temperature T, the SMP is assumed to be a mixture of two conceptual phases: a soft rubbery phase r and a hard glassy phase g. The first phase corresponds to the material regions in the rubbery state, and the second phase to the regions in the glassy state. In the model the volume fraction of each phase within the representative volume of the SMP is postulated as a logistic function of temperature (figure 16) using the relation proposed in [36]
where the material parameters Tref and A are established on the basis of the variation of mechanical characteristics obtained in the DMA experiments. During cooling another phase is assumed to be formed within the material volume: a frozen rubbery phase. This phase encompasses the material regions in the glassy state and is transformed from the regions in the rubbery state before cooling. However, since in this paper only the isothermal processes or the processes characterized by the increase of temperature are simulated, further details concerning description of this third phase are not included.
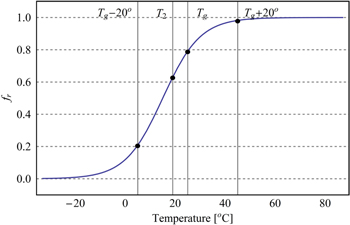
Figure 16. Assumed dependency of the volume fraction of rubbery phase fr in the SMP volume element on temperature. The volume fractions fr calculated for temperatures Tg − 20 °C, T2 = 19 °C, Tg = 25 °C and Tg + 20 °C used in the experiments in the temperature chamber are marked.
Download figure:
Standard image High-resolution imageThe constitutive relations are formulated separately for each phase, and the resulting behaviour of the material depends on the actual material composition. Below, the constitutive relations are subsequently presented for the rubbery phase and the glassy phase. They are specified in the large strain framework. A one-dimensional rheological scheme of the model is shown in figure 17(a), next to the schematic tensile curves for the two phases to be obtained with the use of the proposed constitutive relations assumed for the phases; see figure 17(b).

Figure 17. (a) Rheological 1D representation of a two-phase model of SMP, (b) schematic tensile curves for the assumed constitutive models for a rubbery and glassy phase.
Download figure:
Standard image High-resolution image6.1. Rubbery phase
For this phase, the hyperelastic Arruda–Boyce model [57] is assumed, which describes properly the behaviour of isotropic homogeneous elastomers in large deformations. The Cauchy stress tensor σr (true stress) is related to the deformation gradient Fr using the following formulae

where kr is the elastic bulk modulus, μr is the initial shear modulus, Nr defines the limit stretch (see figure 17(b)) and αr is recognized as a coefficient of thermal expansion (CTE); ΔT = T−T0 is a temperature change, L−1[x] is an inverse Langevin function, I is a second-order identity tensor and additionally
6.2. Glassy phase
This phase, which is responsible for the presence of permanent deformation and the hysteresis in the stress–strain curve, is assumed to be hyperelastic-viscoplastic with the Zener-type behaviour [37] (see figure 17), viz.

where the stress σgI is related to FgI again by the Aruda–Boyce model (equation (4)) but with different material parameters compared to the rubbery phase. The stress σgII is related to the elastic part Fge of the deformation gradient FgII by the relation employing the logarithmic strain measure, i.e.
and Gg, λg are the elastic Lame parameters and αg is the CTE. The terms multiplied by ΔT in equation (7)1 vanish for isothermal processes.
The evolution equation for the viscoplastic part Fgv of the deformation gradient FgII remains to be specified. The multiplicative decomposition of the deformation gradient (equation (6)2) results in additive decomposition of the velocity gradient Lg

where Dv and Wv are a symmetric part and a skew-symmetric part of the viscoplastic velocity gradient Lv, respectively. Without introducing additional restrictions to the model, in the case of isotropic materials, Wv = 0 is prescribed. The viscoplastic strain rate tensor Dv is assumed to be given by the following relation

where  is the deviator of the Cauchy stress
  At a variance with [36], in the proposed model the description of the evolution of viscoplastic deformation in the glassy phase follows the 1D proposal outlined in [34, 35] so that the equivalent viscoplastic shear rate in the glassy phase
  (equation (9)1) depends on the equivalent stress τgv according to the power-law

where  is a reference shear velocity, and an exponent m describes the degree of strain rate sensitivity. A critical shear stress τcgv evolves exponentially with the accumulated viscoplastic strain, i.e.

where τ0, τsat and b are additional material parameters: τ0 is the initial yield stress, h is a linear hardening modulus, b is a coefficient responsible for the rate of saturation of an exponential term and τsat specifies the level of saturation. Finally, the evolution of the viscoplastic part of FgII is calculated as follows:

6.3. Overall Behaviour
The effective behaviour of the shape memory polyurethane is the resultant response of individual phases. At this stage, a simple Voigt-type averaging scheme is used. Accordingly, each phase is assumed to share the same deformation gradient equal to the macroscopic one: F. The total Cauchy stress tensor σ in the material is an average of stresses in the individual phases. It is assumed that the volume changes are negligible. Thus, one has

For a better description of the redistribution of stresses and strains between phases, the advanced averaging schemes, proposed for two-phase elastic-viscoplastic materials [53, 58], is planned to be considered in the future.
Using the experimental data the material parameters of the proposed model of PU-SMP have been identified. The following identification procedure has been proposed: first, the initial values of parameters A and Tref present in f(T) dependence equation (3) are assumed on the basis of DMA results presented in [15]. Then, the parameters: Gg, τo, τsat, h, b, μg, Ng describing the elastic-plastic behaviour of a glassy phase have been identified using the results of loading-unloading test at Tg − 20 °C, performed at a temperature chamber (figure 15). Next, similar material parameters μr, Nr describing hyperelastic behaviour of a rubbery phase have been established using the results of the similar test performed at Tg + 20 °C (figure 15). Note that for these two opposite cases the material behaviour is predominantly governed by one of the phases and is thus independent on the behaviour of the second one. In both cases a curve fitting method is used. The procedure was supported by an extensive parametric study. The influence of the parameters Gg, τo, Ng and μr, Nr is easily deduced from figure 17(b). Concerning the remaining parameters it was observed that for low temperatures the shape of the stress–strain curve after initial yielding is most sensitive to the value of b, τsat and μg, in particular the level and the slope of curve increase with increasing τsat and μg for advanced deformation. The moduli λg, kg and kr are assumed high enough to ensure incompressibility, and they are kept constant during the fitting procedure. Also, the stress–strain curves for the intermediate temperatures, presented in figure 15, have been used to verify the validity of parameters and to tailor A and Tref parameters. All these tests are performed at engineering the strain rate 2 × 10⁻³ s−1. This value of the strain rate has been assumed as a reference viscous strain rate  in equation (10) in order to make the material response at the considered processes not sensitive to m. Finally, using experimental results for different strain rates performed at constant temperature equal to 25 °C (figure 14), the strain-rate sensitivity parameter m has been established. The procedure has been repeated recursively in order to obtain the best fit. The parameters have been optimized, with a focus on valid predictions for low strain rates and for processes taking place at room temperature. The identified material parameters are collected in table 3.
Table 3. Identified material parameters for the two-phase model of the SMP.
| Element | Rubbery phase | Glassy phase |
|---|---|---|
| hyperelastic | μr = 1.0 (MPa) kr = 1000 (MPa) Nr = 17 | μg = 11.5 (MPa) kg = 1000 (MPa) Ng = 17 |
| hyperelastic- viscoplastic | — | Gg = 120 (MPa), λg = 1500 (MPa),  (1 s−1), m = 3.0 (1 s−1), m = 3.0  (MPa), (MPa),  (MPa), b = 6, h = 20 (MPa) (MPa), b = 6, h = 20 (MPa) |
| CTE | αr = 2.53 × 10⁻⁴ (1/K) | αg = 1.48 × 10⁻⁴(1/K) |
| A = 7.5; Tref = 15 °C | ||
The CTE values αr, αg for the two phases have been established based on the literature [35, 36, 56] concerning similar materials. It has been observed that in the reasonable range of values, the change of CTEs does not change the material response significantly, at least in the considered cases of varying temperature presented in figure 20.
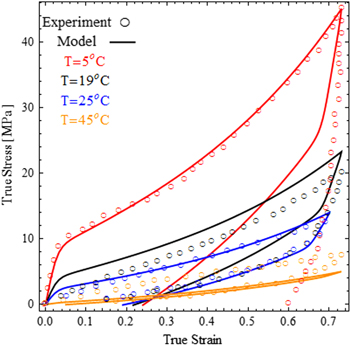
Figure 18. Comparison of experimental results and modelling predictions for stress versus strain curves obtained for the PU-SMP subjected to tension with strain rate 2 × 10⁻³ s−1 at various temperatures (see figure 15).
Download figure:
Standard image High-resolution image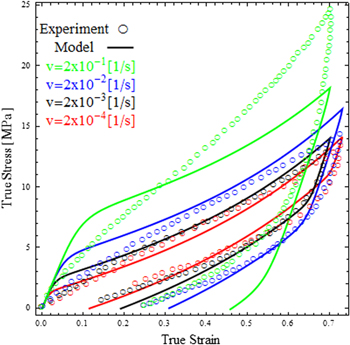
Figure 19. Comparison of experimental results and modelling predictions for stress versus strain curves obtained for the PU-SMP subjected to tension with different strain rate 2 × 10⁻³ s−1 at constant temperature 25 °C (see figure 14).
Download figure:
Standard image High-resolution image
Figure 20. Comparison of experimental results and modelling predictions for stress versus strain curves obtained for the PU-SMP subjected to tension with different strain rates at room temperature (see figure 13): (a) neglecting the temperature change, (b) with the temperature change (see figure 21).
Download figure:
Standard image High-resolution imageA comparison of model predictions and experimental results for the two sets of experiments mentioned above are presented in figures 18 and 19. It is seen that the model satisfactorily predicts the dependence of material response on temperature (figure 18), although some discrepancies are visible concerning the unloading part of the curve for the lowest temperature and the width of the hysteresis loop for the highest strain rate. The latter discrepancy is due to the model assumption that the rubbery phase is purely hyperelastic. As seen in figure 19, the influence of the strain rate at constant temperature 25 °C is also well accounted for by the model for the strain rate up to 2 × 10⁻² s−1. The stress level is underestimated for the highest strain rate 2 × 10⁻¹ s−1.
The simulations of the material response in a tensile loading-unloading test at room temperature are presented in figure 20. Simulations have been conducted, first assuming the constant temperature (figure 20(b)) and then imposing the temperature change (figure 20(b)), following the one measured in the experiments. The variation of the temperature imposed in the modelling is presented in figure 21. For simplicity the insignificant drop in temperature during unloading, visible in the experiments (see figures 10 and 11), has been neglected. For the strain rate of 2 × 10⁻¹ s−1 the predictions obtained assuming the temperature change are closer to the experimental results concerning the stress level. However, for the highest strain rate, the reduction in stresses due to the increase of temperature obtained using the model is too strong, so that the comparison between the model predictions and the experimental results is not satisfactory.
Figure 21. Temperature change assumed on the basis of experimental results and used as an input data in the modelling of tension of the PU-SMP at room temperature (see figure 12).
Download figure:
Standard image High-resolution image
In general, the model predictions are in fair accordance with the experimental results for all the cases considered, especially concerning moderate strain rates and processes taking place around room temperature. This is achieved by constructing the model on account of microstructural features of the SMP, namely the presence of two types of segments/domains in different proportions, depending on the temperature.
In spite of a good performance of the proposed model, some discrepancies between the simulations and experiment are observed for higher temperatures at which the material response is dominated by a rubbery phase. This can be caused by neglecting the viscosity of this phase in the model. Similarly, the model formulation needs further improvement in relation to the stress–strain response at higher strain rates. For this regime strong thermomechanical coupling, related to the adiabatic type of the process, is observed; thus, probably a fully coupled thermomechanical problem should be considered.
The model also requires further validation of its performance in a typical thermomechanical cycle used in the application. Such a cycle also involves the cooling process and is used to assess the shape fixity and shape recovery, which are crucial parameters for the SMP applications [2, 3]. The experiment and simulations concerning these issues are currently underway [59].
7. Concluding remarks
- (1)It was found from DMA, WAXS, DSC and a wide program of mechanical and thermomechanical investigation that the shape memory polyurethane (PU-SMP MM 2520) is a well-prepared shape memory material, characterised by a large reversible strain and good mechanical and high shape memory properties.
- (2)WAXS analysis revealed that the PU-SMP is in an amorphous state but contains a very small fraction, lower than 0.1% of the oriented low-symmetry phase, which consists of hydrogen-bonded clusters. Upon uniaxial deformation this phase becomes more oriented along the tension direction.
- (3)The PU-SMP is very sensitive to the temperature. When the temperature is higher than its glass transition temperature Tg, it manifests rubbery-like viscoelastic properties, whereas at the temperature below Tg, the polymer is in the glassy state and can be considered as elasto-viscoplastic material.
- (4)For the tension tests performed at a constant temperature, within or above the glass transition region, similar values of residual strain are obtained for various strain rates after the PU-SMP unloading, while for the test performed at low temperature, very large (six times higher) residual strain is recorded.
- (5)PU-SMP is very sensitive to the strain rate: during loading at the higher strain rate higher values of the stress and the sample temperature are obtained. It has been shown that up to 2 × 10⁻³ s−1 the studied PU-SMP can be treated as rate-independent material.
- (6)Observed widening of the stress–strain loop (especially during deformation at constant temperature) for the strain rate over 2 × 10⁻³ s−1 indicates the increasing contribution of dissipative mechanisms in deformation with higher strain rates. The analysis of the hysteresis loops can be important in terms of the PU-SMP applications as energy absorbers.
- (7)The PU-SMP whitening effect, observed at advanced strains, is more pronounced at higher strain rates. According to the WAXS analysis the effect is definitely not due to the crystallization phenomenon and may be related to appearance of cavitations: stress-induced micro-voids.
- (8)It has been shown that IR thermography is a useful tool in studying the thermal effects during straining of the PU-SMP. The results obtained using this method can be applied for determination of the range of strain rates and/or strain values at which the PU-SMP may operate properly, i.e. when there is no influence of temperature change on the mechanical properties.
- (9)The two-phase constitutive model of the shape memory polymer formulated in a large strain framework has been presented. In the model the soft rubbery phase is hyperelastic, while the hard glassy phase is hyperelastic-viscoplastic.
- (10)The model satisfactorily predicts dependence of the stress–strain PU-SMP response in tensile loading on temperature and the strain rate, especially for the temperature range close to room temperature and for moderate strain rates.
Acknowledgments
The research has been carried out with the support of the Polish National Centre of Science under Grant No. 2011/01/M/ST8/07754 and the Japan Society for Promotion of Science under Grant-in-Aid for Scientific Research (C) No. 23560103. Part of the investigations (WAXS analysis) was carried out with the use of CePT infrastructure, financed by the European Union—the European Regional Development Fund within the Operational Programme 'Innovative economy' for 2007–2013. The authors are grateful to Leszek Urbański for obtaining the mechanical data, to Robert Mines for his useful remarks on the text and to SMP Technologies Inc., Tokyo, Japan for providing the PU-SMP material.