
Abstract
This paper presents a novel force sensitive structure exploiting a dynamic mode for probing the elastic properties of living cells. A key feature of this structure is the possibility of conducting measurements in liquid environments while keeping high dynamic performances. The structure indeed provides a steady area that can be adapted so that suspension or adherent cells can be placed in a culture medium. The steady area is also connected to two adjacent beam resonators. Because these resonators never need to be immersed into the culture medium during measurements, forces applied to cells can be estimated with a high sensitivity via frequency shifts. In this paper, we conduct an extensive theoretical analysis to investigate the nonlinear effects of large static pre-deflections on the dynamic behavior of the structure. As a proof of concept, we also report the fabrication, characterization and calibration of the first prototype intended to deal with suspension cells with a diameter ranging from 100 to 500 μm. This prototype currently offers a quality factor of 700 and a force sensitivity of ∼2.6 Hz mN−1. We also demonstrate that the prototype is capable of measuring the elastic modulus of biological samples in a rapid and sufficiently accurate manner without the need of a descriptive model.
Export citation and abstract BibTeX RIS
1. Introduction
Measuring the elastic properties of individual living cells turns out to be of increasing interest. In particular, scientific evidences have revealed connections between alterations in the elastic modulus (i.e. Young's modulus) of single cells and pathophysiological states [1]. For instance, a dramatically reduced Young's modulus is a characteristic feature of cancerous cells [2–7]. By contrast, red blood cells infected with malaria or sickle cell disease have a significantly higher Young's modulus than their healthy counterparts [8, 9].
The elastic modulus of cells hence appears as a meaningful marker to differentiate pathogenic cells and healthy cells. For diagnostic purposes, knowing Young's modulus of cells may hence help to detect the presence of cancer as well as other cell-based degenerative diseases at earlier stages. Furthermore, elasticity measurements also have the potential to disclose the specific effects of pharmaceuticals at the cellular level [10–12]. Therefore, cell elasticity measurements may also prove advantageous in drug development.
Among the large variety of macro- and microscale devices that have been developed to investigate various mechanical aspects of living cells (see [13–17] and references therein), the atomic force microscope (AFM) probably remains the most widespread tool for quantifying Young's modulus of different types of cells. By way of example, results published in [2–9] were all derived from measures obtained with AFM cantilevers.
Notwithstanding indisputable advantages, using an AFM in order to evaluate Young's modulus of a living cell remains a delicate, time-consuming task. Basically, the extremity of the AFM cantilever must be cautiously and precisely positioned so that it can be used to indent or compress the cell. Then, a force-deformation curve must be acquired. Conventionally, a laser that reflects off the back surface of the cantilever onto a position sensitive photodiode is used to detect the contact point with the cell and to monitor the static deflection of the cantilever. However, if the cells are maintained in a culture medium during measurements, the alignment of the laser beam may become delicate. Moreover, in the presence of aqueous solutions, capillary meniscuses arise at the air–liquid interface when the AFM cantilever is immersed and removed. The compliant cantilever must then withstand large capillary forces that may engender measurement artifacts. Alternatively, an optical microscope and a video camera can be utilized [18]. The resolution is however limited by the optical components of the microscope and measurement uncertainties can occur. Furthermore, such vision-based techniques solely prove to be suitable for suspension cells with a spherical shape (e.g., red blood cells).
This paper introduces a novel force sensitive structure that has been designed with the aim to bring new solutions to these problems. In particular, the structure exploits a dynamic mode to quantify Young's modulus of both suspension and adherent cells so that valuable information on the cell state can be obtained in a simple and sufficiently rapid manner for diagnosis applications.
2. Overall description of the structure
2.1. Concept
Structures exploiting resonance phenomena can outperform equivalent structures operated in a static mode [19]. Despite this potential advantage, resonant cantilevers are rarely used for determining Young's modulus of living cells. Indeed, a major issue is that dynamic performances of AFM cantilevers are dramatically deteriorated as soon as they are surrounded by a viscous medium. Thereby, the quality factor of typical resonant AFM cantilevers immersed in liquids rarely exceeds 10–30 [20, 21].
To extract Young's modulus of a single living cell while taking full benefit of a dynamic mode, even in the presence of a liquid environment, we propose the suspended structure shown in figure 1(a). It consists of a planar structure clamped at its extremities. It also incorporates two rectangular apertures. Finite Element Analysis (FEA) conducted with COMSOL V.4 shows that if the structure is mechanically excited at the proper frequency, it can provide an antisymmetrical vibration mode where the two outer beams (OBs) oscillate in antiphase. In the mean time, the third central beam (CB) remains immovable, as depicted in figure 1(b).
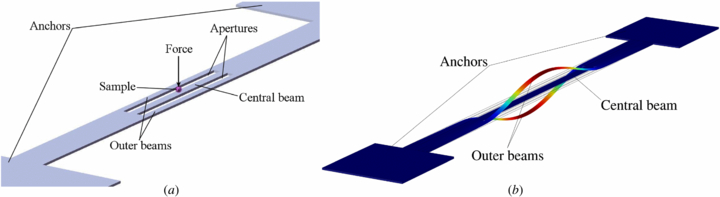
Figure 1. (a) Three-dimensional schematic of the structure illustrated with a suspension cell (trapping system not represented). (b) FEA showing the antisymmetrical vibration mode exploited to extract the elastic properties of a biological sample: the two outer beams oscillate in antiphase whereas the third central beam remains immovable.
Download figure:
Standard image2.2. Sensing principle
Measuring the force applied to a cell is a prerequisite to extract its Young's modulus. Conceptually, if a static force normal to the structure's plane is applied to the half-span of the CB, the whole structure deflects. Therefore, the OBs are forced to deflect as well. When the OBs oscillate as illustrated in figure 1(b), interactions between static and dynamic behaviors occur. Thereby, the static deflection imposed by the normal force affects their initial resonance frequency. In fact, even slight static pre-deflection of beam resonators may significantly impact their dynamics [22]. Accordingly, it is possible to recover the magnitude of the normal force applied upon the CB by monitoring frequency shifts of the OBs, as it is demonstrated in section 3.
2.3. Key features
The balanced mode of vibration shown in figure 1(b) is of particular interest for determining Young's modulus of individual cells. Indeed, it enables high sensitivity rates offered by resonators without exposing cells to vibrations. Thereby, the area located at the half-span of the CB can be adapted to place suspension or adherent cells in liquids (see figure 2). A main advantage offered by such a configuration is that, unlike conventional AFM cantilevers, the oscillating OBs do not need to be immersed in the liquid in order to measure a force applied to a cell. Therefore, major energy losses are avoided and high quality factor can be guaranteed. Because the OBs always oscillate in air, potential difficulties related to laser alignments in liquids are eliminated and measurements based on vision techniques are not required. It is also worth noting that since the CB is inherently force sensitive, low-cost and commercially available microindenters can be used to apply forces on cells during experiments. Moreover, artifact measurements due to capillary effects are minimized since the microindenter is not directly used as a force sensor.
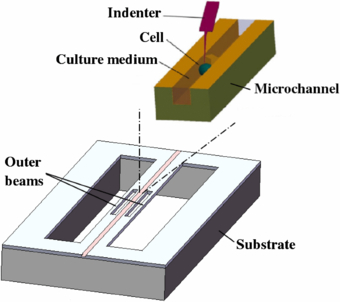
Figure 2. Top: Illustration of an open microfluidic channel for cell studies, as reported by Ryu et al (adapted from [23–25]). Bottom: conceptual view showing the structure equipped with a similar open microfluidic channel (fluid inlet and outlet not represented).
Download figure:
Standard image3. Theoretical analysis
In this section, we demonstrate that the resonant structure can act as a force sensitive cell substrate. To predict frequency shifts engendered by a normal force F applied to the CB, static and dynamic behaviors are studied independently. We mention here that the experimental implementation of an open microchannel such as the one sketched in figure 2 is currently under investigation and is not addressed in this paper. Consequently, the presence of an open microchannel is not considered in the following analysis.
3.1. Static behavior: large deflection of the structure
A static analysis including nonlinear effects is first conducted in order to detail how the OBs exactly behave during large deflections of the whole structure. Due to symmetry, and without loss of generality, our analysis can be limited to one-fourth of the structure, as sketched in figure 3.
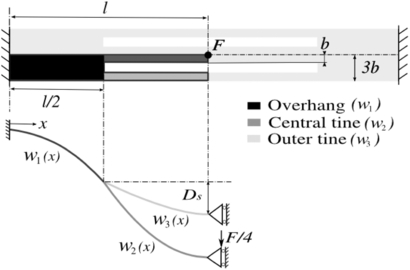
Figure 3. Top: for predicting the quasi-static deflection of the structure engendered by a normal force F, only the darker 'tuning fork' (top view) is considered. Bottom: equivalent one-dimensional model (side view) of the colored beams (proportions exaggerated for illustration purposes).
Download figure:
Standard imageThis quarter structure, similar in shape to a tuning fork, is composed of three segments: the overhang (black), the central tine (dark gray) and the outer tine (light gray). All segments are assumed to satisfy Bernoulli's beam theory. One-dimensional coordinate functions are used to approximate the displacement field of each segment. To guarantee enough degrees of freedom, the flexural displacement w1, 2, 3(x) of each segment is modeled by third-order polynomial expressions:

The three polynomials in (1) are then used to calculate the total potential energy stored by the tuning fork during deflection:

where Ub is the sum of strain energies developed by each segment during bending:

In (3), c1 = 0, d1 = l/2, c2, 3 = l/2 and d2, 3 = l. Ii are the moments of inertia of the three segments with I1 = bh3/4 and I2 = I3 = bh3/12, E represents Young's modulus of the structure's material, the width b and the length l are defined in figure 3 and h is the structure's thickness.
In addition, Us is the sum of energy contributions due to the midplane stretching of the segments that occurs during deflection:
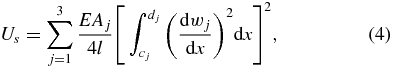
where c1 = 0, d1 = l/2, c2, 3 = l/2 and d2, 3 = l. Aj in (4) represents the cross section areas of the three segments with A1 = 3bh and A2, 3 = bh. The total potential energy function can hence be written as:

where W = F w2(l) is the work done by the punctual force F.
Applying the principle of minimum potential energy, one sets for each unknown coefficient ai:

The problem is then augmented with Lagrange multipliers by considering a set of constraints. To obtain satisfactory results, mechanical constraints do not need to be considered. Enforcing geometrical constraints is enough to provide an accurate solution. Assuming that the central tine and the outer tine are rigidly linked to the overhang at x = l/2, and that the central and outer tines are terminated by sliding conditions (see figure 3), the following set of conditions can be enforced:


The augmented system can then be numerically solved for different values of F. To compute such a system, an algorithm such as the one reported in [26] was used with the following numerical values: l = 12.5 mm, b = 0.25 mm, h = 0.1 mm and E = 212 GPa.
To validate this modeling approach, FEA was used as a reference tool. COMSOL simulations were conducted in the nonlinear deflection mode with the values of l, b, h and E aforementioned. We also specified a density of 8030 kg m−3 and a Poisson's ratio of 0.29 for the structure's material. These values were selected in accordance with the material utilized for the prototype of section 4. For a point forceF = 260 mN applied at the half-span of the CB, figure 4 shows the deflection profile of the structure. Analytical results are in good agreement with FEA simulations and permit to predict the deflection of the structure accurately. It can also be seen that the deflection amplitude of the OB is smaller than the deflection of the CB.
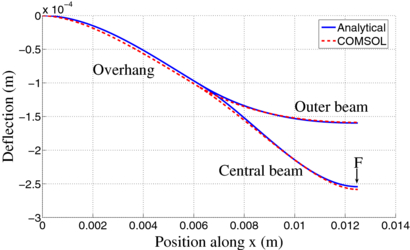
Figure 4. Deflection profile and deflection amplitude when a normal force F = 260 mN is applied at the half-span of the CB.
Download figure:
Standard imageThis intuitive result is also confirmed by figure 5 which compares the deflection amplitude of both beams as a function of the force F applied. Analytical and FEA results are again in accordance. Figure 5 also clearly illustrates that the stretching (i.e. nonlinear) effect progressively dominates as the beams deflection increases. Thereby, for deflections above ∼50% of the structure's thickness, the structure becomes clearly stiffer.

Figure 5. Half-span deflections of the CB and one OB as a function of the force F applied to the CB. Due to symmetry, the second OB deflects exactly in the same manner.
Download figure:
Standard image3.2. Dynamic analysis: effects of a static pre-deflection on the oscillation of the outer beams
We now demonstrate that, if the force F is applied while the OBs oscillate as shown in figure 1(b), the variations of deflection imposed by F actually impact the initial resonance frequency of the OBs. To demonstrate such a coupling between static and dynamic behaviors, a symmetric structure again simplifies the analysis. Indeed, valuable insights into the structure's dynamics can be grasped by restricting the analysis to a single OB (see figure 6).

Figure 6. For predicting frequency shifts, only one OB is considered. Vibrations (dashed green lines) take place around an equilibrium position (thick green line). The curved shape is indirectly engendered by static deflections (proportions not to scale).
Download figure:
Standard imageTo a first approximation, one can choose to model the OB as a hinged–hinged beam terminated by two rotational springs of stiffness kr1 (see figure 6). The presence of rotational springs is justified by the facts that extremities of the OB are attached to the overhangs. Intuitively, it can be foreseen that, although the overhangs can be considered as axially immovable ends, they should not act as ideal clamping supports. In the literature, elastic rotational springs are often used to model such a flexibility [27–29].
Again, energy approaches can be exploited to conveniently handle the configuration of figure 6. Because the OB is terminated by rotational springs attached to pinned ends supports, it is conventional to assume a displacement function in the form of a sine:

where Ds is the midspan deflection of the OB.
Ds is related to the force F applied upon the central steady beam, and can be estimated from the previous static analysis (see figure 3):

Conceptually, it is however more convenient to consider that Ds is rather due to an unknown equivalent virtual force Fv (see figure 6). With an energy approach, a relationship between Ds and Fv can be derived. Considering that Fv is applied at the beam midspan, the potential energy stored by the beam is the sum of the following contributions:

In (13), Ub is the bending energy of the beam:

Us is the energy developed during the midplane stretching of the beam:

and Urs is the energy stored by the two rotational springs of stiffness kr1:

where θ0 and θl are the slopes  evaluated at x = 0 and x = l, respectively.
Considering that the work done by Fv is W1 = Fv w(l/2), the total potential energy function Φ1 is:

Minimizing (17) with respect to Ds yields a cubic force-centered-deflection law:

where

In (19), k1 and k3 are linear and nonlinear spring constants, respectively.
As in [30], it can now be assumed that small deflections of the beam about a mean deflection Ds can be described approximately by a single stiffness value. An effective spring constant is found by deflecting the beam from its equilibrium position by an arbitrary amount Δd (see figure 6), so that:

Considering that vibration amplitudes Δd are sufficiently small, terms proportional to Δ2d and Δ3d in (20) can be neglected. Then, an equivalent stiffness of the OB may be approximated by:

As often in structures involving coupled beams, vibrating beams can be modeled to a first approximation as one degree of freedom oscillators (e.g., [31, 32]). If the single OB is assumed to oscillate as an undamped lumped-parameter system, the static deflection Ds affects its natural frequency as follows:
As previously, the numerical values E = 212 GPa, b = 0.25 mm, l = 12.5 mm and h = 0.1 mm were used to compute (22). An order of magnitude for the rotational stiffness kr1 was also found by using [33]:

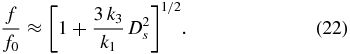
Equation (23) gives kr1 ≈ 5.6 × 10⁻³ Nm rd−1. Nonetheless, (23) is originally intended to estimate the rotational spring constant of anchors for clamped–clamped beams. In our case, the OBs are attached to the overhangs (see figure 3) which do no act as ideal clamps. Therefore, the value of kr1 was slightly adapted to fit prestressed modal analyses conducted with COMSOL. For kr1 = 3.45 × 10⁻³ Nm rd−1, figure 7 proves that (22) accurately predicts the amount of frequency change engendered by a force F applied to the CB.

Figure 7. Evolution of the resonance frequency of the OBs when a vertical force F is applied upon the half-span of the CB.
Download figure:
Standard imageAlternatively, and because displacements of the CB can also be predicted with respect to the force F applied, the amount of frequency change can also be estimated as a function of a displacement imposed on the CB (see figure 8). It is of interest to note that in both cases, quasi-linear regions are predicted around points P. In particular, a force sensitivity of 2.91 Hz mN−1 is predicted if the force applied to the CB exceeds 100 mN (see figure 7).
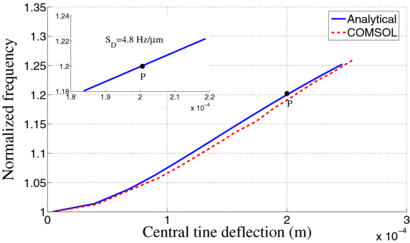
Figure 8. Evolution of the resonance frequency of the OBs when a vertical displacement is imposed upon the half span of the CB.
Download figure:
Standard image4. Experiments
To demonstrate the possibility of extracting Young's modulus of living cells with the structure, we fabricated a first prototype intended to deal with suspension cells whose diameter approximately ranges from 100 to 500 μm. This monolithic prototype was fabricated from a single sheet of biocompatible stainless steel. All dimensions are those used for the theoretical analysis. Considering the total length of the prototype (25 mm), precision wire cut electric discharge machining (EDM) was favored for rapid prototyping. Wire cut EDM, however, did not permit to implement an open microchannel.
Mechanical excitation was provided by a 3 mm long, 2 mm wide and 200 μm thick piezoelectric (PZT) element (Physik Instrumente PIC151). This PZT element was bonded onto the prototype with conductive paste and driven by an ac signal with a function generator (Agilent 33120A) connected to a laboratory power amplifier (Newtons4th LPA400).
During experiments, the prototype was suspended between two clamps. One of the clamps was fixed to a manual micropositioning stage that allowed horizontal translations along the y direction. To ensure a firm attachment of the prototype and to avoid slipping, the clamps were tightened with screws. The whole setup (see figure 9) was mounted on a pneumatic antivibration isolation table to minimize the presence of external disturbances. To measure small static deflection as well as beam oscillations, we do not use a laser coupled to a sensitive photodiode. Instead, we used a home made optical fiber displacement probe. This probe was constituted of two step index multimode fibers having a diameter of 50 μm at their extremity. Such dimensions offered a compact sensing head that could also be implemented in a future microfabricated version of the structure. Further details about this fiber displacement probe can be found in [34].
Figure 9. Top view of the prototype and experimental arrangement. The inset provides a microscope view of the area indicated by dashed lines. Scale bar equals 1.5 mm.
Download figure:
Standard image4.1. Evaluation of static deflections
Experiments were first carried out to investigate the static deflection of the prototype. To bend the structure, an indenter terminated by a metal bead with a diameter of 500 μm was placed beneath the CB. The stiffness of the metal bead was much higher than the stiffness of the structure. With a micropositioning stage (Physik Instrumente M112-1DG), incremental motions of 10 μm along the z direction were imposed to the CB. Considering the prototype symmetry, deflection data were acquired only for one OB.
Figure 10 demonstrates that the prototype deflected as expected during experiments, even though the deflection of the OBs tends to be 12% overestimated by theory when the deflection of the CB is above 30 μm. Several uncertainties sources could explain this slight estimation error (e.g., values of Young's modulus and Poisson's ratio used for calculations, uncertainties related to the fabrication process, the clamping of the prototype, etc).
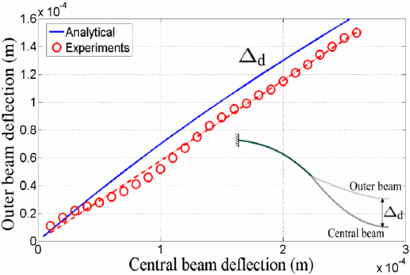
Figure 10. Difference of static deflection Δd between the central and the OBs. Solid line is plotted thanks to the curves from figure 5. Circles represent experimental data. Dashed line is a fitting curve.
Download figure:
Standard image4.2. Evaluation of dynamic performances
The dynamic behavior of the prototype was then explored. In the first step, the indenter was removed and no force was applied to the CB. To actuate the prototype, the PZT element was driven with a sinusoidal voltage. The peak–peak amplitude of this sine signal after the power amplifier was 9V. The excitation frequency was then swept with the function generator in order to find the resonance modes of the prototype. As illustrated by figure 11(a), the antisymmetrical mode of interest was found at 3180 Hz.
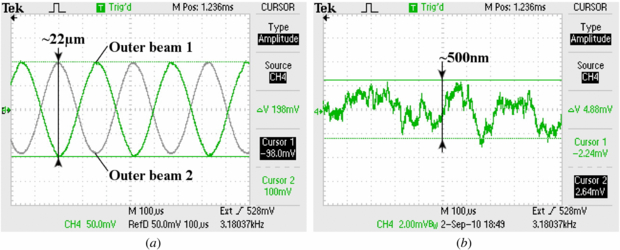
Figure 11. Oscilloscope screenshots showing: (a) The two OBs oscillating in antiphase when the structure is driven at 3180 Hz. (b) Vibrations measured at the half span of the CB with no force applied.
Download figure:
Standard imageWhen the PZT element was driven with a voltage supply of 9 V, the peak–peak oscillation amplitude of the OBs was 22 μm. During oscillations of the OBs, a lot of attention was paid to check if potential vibrations were transferred to the CB. As a matter of fact, they were very limited. As shown in figure 11(b), they never exceeded 500 nm, that is to say 2% of the oscillation amplitude of the OBs. Droplets of water were also deposited upon the CB with a micropipette. No particular effect on the droplets was observed. It was also confirmed that the presence of the small amount of liquid on the CB did not alter the vibration mode.
In addition, we explored the frequency response of the antisymmetrical vibration mode. With the OBs oscillating in air, a quality factor of 700 was obtained (see figure 12). This quality factor was not deteriorated when a liquid droplet was deposited on the CB. This is a high value when compared to typical quality factors of AFM cantilevers in liquids (10–30).
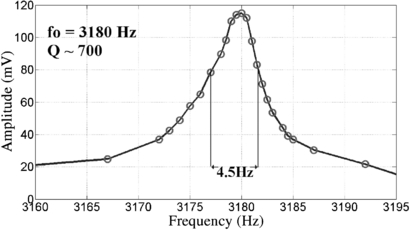
Figure 12. Experimental frequency response for the prototype of figure 9 driven around 3180 Hz.
Download figure:
Standard image4.3. Frequency variations induced by large displacements
The coupling between static and dynamic behaviors was then investigated. To that end, oscillations of the OBs were monitored while the CB was bent with the indenter. For a total displacement of the indenter of 250 μm, the oscillation frequency of the OBs evolved as shown in figure 13.
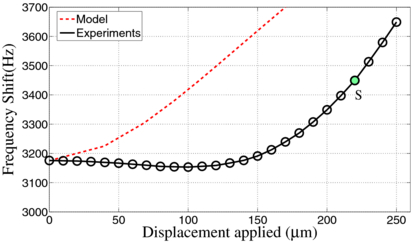
Figure 13. Frequency variations measured for a normal displacement applied to the half span of the CB. Circles and solid line correspond to experimental data. Dashed line represents variations predicted by figure 8 for the same initial frequency.
Download figure:
Standard imageContrary to theoretical predictions, it is experimentally observed that for small deflections of the CB (i.e. deflections lower than 100 μm), the frequency of the OBs actually decreases. Such a behavior has been reported for buckled and deflected beams subjected to axial loads [35–39]. Nevertheless, this decrease finally appears as a transition period. Indeed, once the stretching effect dominates at large deflections, a behavior very similar to the one initially predicted is retrieved. In particular, it is worth noting that the curve in figure 13 offers a linear displacement sensitivity of 5.75 Hz μm−1 around the point S. This displacement sensitivity is actually ∼17% better than the one expected initially by theory (4.8 Hz μm−1).
4.4. Frequency variations induced by small forces
From the analysis of figure 13, it is clear that the prototype provides a much better sensitivity when the CB is largely bent. The CB was hence maintained permanently curved (i.e. even with the indenter removed) to exploit the region around the point S. Obviously, this axial translation compressed the whole structure. As a result, the initial resonance of the antisymmetrical vibration mode decreased from 3180 to 3080 Hz. Nevertheless, no significant impact on the dynamic behavior of the prototype was noted.
To estimate the force F applied to the CB during small displacement intervals, the force developed by our indenter was characterized. By pressing the indenter against a precision electric scale (Kern 440–33), a linear relationship was found (see figure 14(a)). Then, frequency variations with respect to the force generated by the indenter were measured. With the prototype pre-deflected, only a linear increase of the frequency was observed, as expected (see figure 14(b)). This linear increase corresponded to a force sensitivity of 2.56 Hz mN−1. Although a pre-deflection of the whole structure was not included in our theoretical analysis, the force sensitivity measured experimentally was only ∼12% lower than expected.

Figure 14. (a) Experimental force–displacement relationship obtained for small displacements of the indenter. (b) Linear frequency shift measured for the structure maintained slightly curved. Circles correspond to experimental data. Solid lines are fitting curves.
Download figure:
Standard image4.5. Direct extraction of the elastic modulus of a suspension cell
With the suspended structure, the force applied to a cell can be measured. In addition, the cell deformation must also be determined. Conventionally, force-deformation information is then used in conjunction with Hertz theory to retrieve Young's modulus of the cell. Hertz theory, however, is subjected to a number of important assumptions. In particular, when dealing with a living cell, the condition of negligible force adhesion is not always fulfilled. Furthermore, for suspension cells, Hertz theory requires to know the radius of curvature of the cell to be probed. As an alternative, we preferred to calibrate our structure so that a sufficient estimation of Young's modulus of the cell could be rapidly obtained without the use of a descriptive model. For calibration, two gel samples T7 and T5 were bought from the company Gelmec. They had a Young's modulus of 37.5 kPa and 119 kPa, respectively.
The gel samples were manually prepared so that their size was as similar as possible to the size of the cells targeted. Thereby, efforts were made to obtain small cubic pieces whose edges measured approximately 500 μm. The gel samples were then cautiously placed on a flat indenter and compressed upon the CB of the structure. To probe only the elastic properties of the gels, the amount of compression applied did not exceed 10% of their thickness [40]. Moreover, the velocity of the translation steps was kept very slow (4 μm s−1) to minimize the occurrence of viscoelastic effects [18, 41].
The same protocol was repeated with a biological entity. Because embryos or oocytes could not be obtained easily, we used a lobster egg with a diameter of 500 μm as a viable alternative (see figure 15). Linear frequency variations induced during the compression of the gel samples and the lobster egg are compared in figure 16(a).
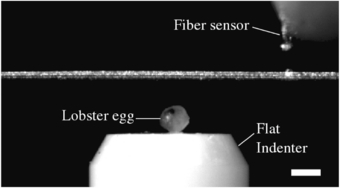
Figure 15. Side view of the slightly curved prototype for measuring the Young's modulus of a lobster egg. The optical fiber probe used for monitoring frequency shifts of the OBs is visible in the upper right corner. Scale bar represents 500 μm.
Download figure:
Standard image
Figure 16. (a) Frequency variations measured during the compression of the commercial gel samples and the lobster egg. (b) Interpolation curve for extracting Young's modulus of the lobster egg.
Download figure:
Standard imageTo determine more precisely the elastic modulus of the lobster egg, slopes ST5 and ST7 indicated in figure 16(a) were used as single values plotted against Young's modulus of the gels (see figure 16(b)). Since only the elastic properties of the materials were probed, a linear regression equation linking these two values could be determined [42]:

where Segg is the slope of frequency variations measured for the lobster egg and Eegg is its Young's modulus. For Segg = 2.03 Hz mN−1, (24) yields a Young's modulus of 78 kPa for the lobster egg. Although no reference value has been found for lobster eggs in the literature by the authors, Young's modulus obtained is in accordance with orders of magnitude usually reported for most living cells [43–45].
5. Conclusion
This paper has presented a new force sensitive structure exploiting a dynamic mode for probing the elastic modulus of living cells. A key feature of the triple beam configuration reported is the possibility of conducting measurements in liquids while keeping high dynamic performances. Another potential advantage is the possibility of adapting the structure's design for addressing both suspension and adherent cells. The first mesocale prototype has been characterized and calibrated with commercial gel samples. Young's modulus of a lobster egg has also been experimentally measured without the need of a descriptive model. Such an indirect technique might prove to be useful for diagnosis applications since relative changes or observation of tendencies may be sufficient to bring valuable information on the cell state.
Although performance characteristics of the prototype are encouraging, several challenges still need to be addressed. In particular, presently it remains difficult to obtain repeatable results due to our current clamping system. Likewise, maintaining the structure in a slightly curved position turns out to be a delicate task. A microfabricated version of the structure aimed at solving these problems is presently under investigation. The implementation of an open fluidic channel coupled to a simple positioning and/or trapping system is also ongoing. In the near future, tests with a larger number of cells will also be conducted to validate the possibility of implementing the suspended structure in a workable platform.