

Abstract
Using magneto-optical imaging, we map the local magnetic field distribution inside a hexagonally ordered array of blind holes patterned in BSCCO single crystals. The nature of the spatial distribution of local magnetic field and shielding currents across the array reveals the presence of a non-uniform vortex configuration partially matched with the blind holes at sub-matching fields. We observe that the filling fraction is different in two different regions of the array. The mean vortex configuration within the array is described as a patchy vortex configuration with the patches having different mean filling fraction. The patchy nature of the vortex configuration is more pronounced at partial filling of the array at low fields while the configuration becomes more uniform with a unique filling fraction at higher fields. The metastable nature of this patchy vortex configuration is revealed by the application of magnetic field pulses of fixed height or individual pulses of varying height to the array. The metastability of the vortex configuration allows a relatively easy way of producing flux reorganization and flux focusing effects within the blind hole array. The effect of the magnetic field pulses modifies the vortex configuration within the array and produces a uniform enhancement in the shielding current around the patterned array edges. The enhanced shielding current concentrates magnetic flux within the array by driving vortices away from the edges and towards the center of the array. The enhanced shielding current also prevents the uninhibited entry of vortices into the array. We propose that the metastable patchy vortex configuration within the blind hole array is due to a non-uniform pinning landscape leading to non-uniform filling of individual blind holes.
Export citation and abstract BibTeX RIS
1. Introduction
In type-II superconductors dissipation is produced by vortex motion, which is suppressed by localizing vortices on pinning centers. Enhancing the pinning strength increases the threshold critical current density (jc) of superconductors below which the current flow is dissipationless. Thus jc is a measure of the vortex pinning strength. Recent strategies to artificially enhance pinning involve making the vortex lattice commensurate with an artificially generated lattice (ordered array) of pins [1–18]. The vortex lattice is said to be commensurate with an ordered array of pins when the inter-vortex spacing (a0),  (where B is magnetic field) matches with the inter-pin spacing (d) (here we consider that each pin can accommodate only a single vortex). Thus the B at which a0 = d, defines a characteristic magnetic field, viz., the matching field,
  (where ϕ0 is the magnetic flux quantum). At B = Bϕ the vortex density corresponds to an average of one vortex per pinning site. The presence of a periodic pinning array in a superconductor [7, 19, 20] modifies the magnetic field distribution [21–23] inside the material. Studies with periodic pins have usually used antidot lattices patterned in superconductors (antidots are through holes patterned in a superconductor) [1–11]. These studies have shown enhancements in vortex pinning at B = nBϕ, where n is an integer or fraction. Unlike antidots, there exists another alternate structure called a blind hole array where the holes terminate inside the superconductor, i.e. these are holes open only at one end. Studies suggest superconducting and vortex pinning properties associated with blind holes are quite distinct from those of superconductors with antidots [24, 25]. A blind hole array produces a simply connected superconducting medium which is uniformly connected below the pins, as each hole in the array terminates inside the medium. A blind hole array has been considered as a prototype for a tuneable pinning landscape akin to Wigner crystals [26]. Theoretical studies [27–29] on superconductors with a correlated array of holes (pins) show vortex configurations with different symmetries at sub-matching fields, along with novel dimer, trimer and giant vortex configurations possible within a blind hole array. While a large number of studies have investigated vortex configurations in antidot arrays, comparatively fewer studies exist on blind hole arrays [11–16, 24, 25]. In this paper using high sensitivity magneto-optical imaging we map the gradients in the local magnetic field across a high quality Bi2Sr2CaCu2O8 (BSCCO) single crystal patterned with a hexagonal array of blind nanoholes. Measurements at different applied field (H) and temperature (T) indicate the blind holes have a mean effective pinning strength of 70 K. We observe an enhancement in the pinning strength associated with partial filling of the blind hole array (matching effect) at sub-matching field conditions. The mean filling fraction and the associated pinning strength is found to be different in two different regions inside the array. Thus the vortex configuration in the array is described as a patchy configuration, with different patches possessing different vortex filling fraction. The patchy non-uniform vortex configuration becomes more uniform at higher fields close to the matching field. The patchy vortex configuration of vortices at sub-matching fields is found to be metastable. At low fields we find the vortex configuration is quite amenable to reconfiguration by the application of a drive with a train of magnetic field pulses. The train of magnetic field pulses of constant pulse height produces an enhancement in the shielding currents uniformly around the array which helps in concentrating the magnetic flux towards the center of the array where they are trapped and vortices are driven away from the edges of the array. The uniformly large shielding current circulating around the edges of the array inhibits further easy entry of vortices into the array unless the magnetic field pulse height is increased. We propose the presence of a non-uniform vortex pinning landscape and the non-uniformly filled blind holes as possible sources of producing a metastable patchy vortex configuration within the blind hole array at low fields.
2. Experimental details and results
Our experiments are performed on a high-quality single crystal of BSCCO [30] of dimensions 0.8 × 0.5 × 0.03 mm3 and Tc = 90 K (see figure 1(a)). The sample surface ('ab' crystal plane) was milled with a focused ion beam (FIB) machine (dual beam FEI make Nova 600 NanoLab) with a focused Ga ion beam (diameter ∼ 7 nm) to create a hexagonal array of blind holes on the surface of the crystal, covering an area of ∼ 39 μm × 44 μm. Figure 1(b) shows a magnified scanning electron microscope (SEM) image of a portion of the hexagonal array of holes. The mean diameter of each hole is 170 nm with mean center-to-center hole spacing (d) 350 nm (BSCCO penetration depth λab ∼ 200 nm for 'ab' crystal orientation). The blind holes are open only on the top surface of the crystal with an average depth ∼ 500 nm (<thickness of the crystal = 30 μm). For our hexagonal array of holes, Bϕ = 195 Oe. We use high-quality high-Tc single crystals to ensure weak intrinsic pinning in the pristine crystal.

Figure 1. (a) SEM image of the crystal. The patterned region is the bright rectangular area (∼ 39 μm × 44 μm) indicated by the arrow. (b) Zoomed SEM image of the triangular array of holes with diameter 170 nm and center-to-center spacing 350 nm. (c)–(f) Bz(x, y) distribution in a 160 μm × 160 μm area around the patterned region at 60 K and H = 36, 51, 144 and 216 Oe, respectively. The scale bar beside each image represents the Bz distribution (in Gauss) across the image. The patterned region is identified by the dashed square in (c).
Download figure:
Standard image High-resolution imageWe employ high-sensitivity magneto-optical (MO) imaging [30, 31] to map the Faraday rotated light intensity distribution  across the surface of the superconductor. This technique enables us to image the distribution of the z-component of the local magnetic field
  (as I(x, y) ∝ Bz(x, y)2). Figures 1(c)–(f) show at 60 K and different H the zero-field cooled Bz(x, y) distribution in a 160 μm × 160 μm region in and around the patterned area. At 60 K and 36 Oe (figure 1(c)), the colour contrast (or difference in Bz) across the edge of the patterned region (identified by the dashed square in figure 1(c)) is found along three edges of the patterned region. Unlike the right edge, the left edge of the patterned region does not show any significant difference between the Bz value inside and outside. Outside the patterned area, the differences in Bz are due to small variations in pinning in the pristine crystal. At H = 51 Oe and higher (figures 1(d)–(f)), Bz outside the patterned region becomes uniform as the orange shaded region begins to uniformly encircle the patterned region. With increasing H (figures 1 (d)–(f)) a strong contrast difference develops between the region with uniform orange shade outside and the bluish region inside the patterned area. The change in contrast across the edges of the patterned region indicates that a strong gradient develops in Bz (between the inside and outside of the patterned region there is a slope in Bz ∝ Jc) which in turn suggests the presence of stronger pinning inside the blind hole array relative to that outside.
Figures 2(a) to (c) show Bz(r) measured across the patterned region (i.e. across a 120 μm line shown by a dashed line in figure 1(c)) at different (increasing) H for T = 50 K, 60 K and 70 K. It is clear from the line scans that inside the blind hole patterned region the Bz(r) gradients are comparatively much larger than those outside. The contrast in the gradients inside and outside the patterned region suggests that the pinning inside the blind hole array is stronger that that outside. Other studies have indicated that strong pinning is possible with blind holes [32]. From figure 2(c) note that at 70 K, enhanced thermal fluctuations smear out the effective blind hole pinning inside the patterned region, and as a result the Bz(r) profiles become flat and featureless, i.e. there is no difference in the Bz(r) between inside and outside the patterned region. Therefore the absence of gradients in Bz(r) at 70 K suggests that the average effective pinning strength in the blind hole array is ∼ 70 K.

Figure 2. (a)–(c) Bz(r) profiles at different H measured across the line shown in figure 1(c), at 50 K, 60 K and 70 K, respectively. Panels (1)–(3) show Bz(r) determined along lines 1–3 marked in figure 1(d). Panel (1) also shows the Bz(r) profile measured along the line labelled '0' in figure 1(d). Solid lines (red and purple) approximately represent the gradient (slope) of the Bz profiles near the right or left edges of the patterned region, respectively. The dashed (red) line is a mirror reflection of the solid (red) line drawn near the left edge. (d) |jc(r)| profiles across lines 1 and 2 (see figure 1(d)). For clarity the |jc(r)| for line 2 is vertically offset by 6.7 × 10³ A cm−2. The vertical dashed lines in (1)–(3) and (d) identify the edges of the patterned region. The solid (blue) curves represent |jc(r)| calculated using the conventional Bean critical state model (see text for details). (e)–(f) |jc(H)| profiles at four locations labelled A, B, C and D in (b) obtained from |jc(r)| profiles at different H, at 60 K and 50 K, respectively.
Download figure:
Standard image High-resolution image2.1. Non-uniform gradients in the Bz profile within the blind hole array
Across the unpatterned region of the crystal the Bz(r) profile measured across line 0 in figure 2(1) shows a weak gradient (weak as compared to that inside the patterned region); see line 0 location in figure 1(d). The weak slope in Bz(r) across line 0 suggests a weak pinning in the unpatterned regions of the sample, though it is much weaker as compared to that inside the patterned region. The standard deviation σ in Bz(r) across line 0 is ∼ 0.4 G. Panels 2(1) to 2(3) show Bz(r) profiles at 51 Oe and 60 K measured across the lines marked 1 to 3 across the patterned region in figure 1(d). In figures 2(1) to (3) we draw solid lines (red and purple) to represent the average gradients (slope) in Bz(r). In figures 2(1) to (3) near the right edge of the patterned region we sketch a dashed (red) line which is a mirror reflection of the solid (red) line drawn near the left edge, i.e. the dashed (red) and solid (red) lines in figures 2(1) to (3) have the same magnitude of slope. The difference in slope of the dashed (red) line and the solid (purple) line shows the gradient in Bz(r) is non-uniform inside the patterned region. The unequal magnitude of the slopes in Bz(r) should correspond to differences in shielding currents inside the patterned region.
By numerically inverting [33, 34] Bz(x, y), we determine the absolute value of the two dimensional shielding current distribution |jc(r)| inside the patterned region. Figure 2(d) shows |jc(r)| determined across lines 1 and 2 (figure 1(c)) (for clarity |jc(r)| for line 2 is artificially offset by 6.7 × 10³ A cm−2). In figure 2(d) the smooth (blue) curves represent |jc(r)| calculated using the modified Bean model [22, 23]. The calculation is restricted to within the patterned array and in the calculation we consider the array as a conventional superconducting medium without blind holes. Note from figure 2(d) tha |jc(r)| on the left and right half of the patterned region is non-uniform. The non-uniformity in |jc(r)| reconfirms the non-uniformity in gradients of Bz(r). Figures 2(e) and (f) show |jc| versus H at four locations indicated in figure 2(b) at 60 K and 50 K, respectively. The |jc(H)| values are measured at locations B and C at 60 K and 50 K (see B and C locations in figure 2(b)). Similarly figures 2(e) and (f) show |jc(H)| (pink and green curves) measured at A and D outside the patterned region (see locations in figure 2(b)). At different H the difference in |jc| between the red (left half) and blue (right half) curves inside the patterned region, i.e. different in |jc| at B and C, is clearly identifiable. The non-uniformity in gradients of Bz inside the patterned region diminishes only at H values close to Bϕ = 195 Oe, where the B and C curves approach each other in figures 2(e) and (f). At lower T = 50 K (figure 2(f)) the non-uniformity in |jc(H)| inside the patterned region is much larger than that outside. The small difference in |jc(H)| values in the left (A) and right (D) regions outside the patterned array at 50 K suggests the intrinsic pinning of the pristine crystal is also not completely uniform.
2.2. Evidence of a partially filled vortex configuration and variation in the filling fraction across the blind hole array
Using the Bz(r) and |jc(r)| profiles determined at 50 K at different H inside the patterned region (for example, see figures 3(a) and (b)) we determine the behaviour of |jc| versus Bz inside the patterned region. Figures 3(c) and (d) show the |jc(Bz)| behaviour at 50 K inside the patterned region at different H. |jc(Bz)| in figure 3(c) shows that on the right half (R) of the patterned region, the maximum |jc| is reached at Bz ∼ 60 G (at a location which is inside the patterned region; see figure 3(a)). This maximum in |jc| corresponds to a vortex configuration partially filling the blind hole array where the pinning strength and hence |jc| peaks. Bz = 60 G (arrow location in figure 3(c)) is associated with a filling fraction nf = Bz/Bϕ of ∼ 0.31. At the same H and T, figure 3(c) shows that in the left half of the patterned region, nf is different (0.27) and the maximum |jc| value is down by about 50%. Therefore we observe a difference in nf between the left and right half of the patterned region along with difference in |jc|. Figure 3(d) shows that at H = 144 Oe, a small difference in nf and |jc| maxima values between the right and left edges of the patterned region persists. With further increase in H the difference in nf and peak |jc| between the left and right sides of the patterned region also reduces. At H = 216 Oe, nf = 0.87 is identical on both sides of the patterned region and the peak in |jc| is also similar. Figure 3(e) shows |jc(Bz)| at different H at 50 K for only the right half of the patterned region. The inset of figure 3(e) shows that as H is increased the filling fraction nf = Bz/Bϕ increases monotonically, approaching unity (i.e. one vortex per hole). Figure 3(e) also shows that the maxima peak in |jc| and hence the peak in pinning strength at partial filling increases with nf (located by arrows). Since increasing H results in a larger fraction of vortices getting pinned on blind hole sites, an increase in pinning with nf is expected. Similar behaviour for |jc(Bz)| is also found at 60 K (data not shown). We have already noted that the filling fraction (nf) of the vortex configuration which is matched with the blind hole array is not uniform across the blind array, especially at low H. The above non-uniformity in nf values seen between the left and right sides of the patterned region suggests that the vortex configuration which is partially matched with the blind holes in the array is like patches of vortex configuration where each patch has a different nf. One patch resides close to the right edge of the patterned region and another one on the left.

Figure 3. (a), (b) Bz(r) and |jc(r)| profiles, inside the patterned region at 50 K, 96 Oe extracted from data along line 1 in figure 1(d). (c) |jc(Bz)| at 50 K, 96 Oe (see text for details). (d) |jc(Bz)| at 50 K at different H as indicated. In (c) and (d), the red and blue arrows indicate the maxima in |jc| corresponding to the left (L) and right (R) halves of the patterned region, respectively. (e) |jc(Bz)| only for the right side of patterned region at 50 K at different H. The inset of (e) shows variation of the filling fraction nf versus H at 50 K. The red dashed line is a straight line fit through the origin.
Download figure:
Standard image High-resolution image2.3. Behaviour of local magnetization relaxation rate within the nanopatterned region
Figure 4 shows the relaxation of the local remnant magnetization [30] (Mrem versus t) measured within the patterned region. MO images are captured at intervals t = 200 ms to determine the Bz(t) averaged over the patterned region and we determine the relaxation of Mrem(t) = Bz(t) − H. The remnant state is produced by field cooling the sample in a field of 150 Oe from 100 K down to 60 K and then switching off H. Figure 4 shows ln  versus ln(t) at 60 K. The relaxation rate of Mrem(t) is related to thermally activated hopping of vortices over the pinning potential barriers [35, 36], which in turn gives a measure of the effective strength of the pinning potential. Figure 4 shows weak Mrem relaxation outside the patterned regions (squares) indicating weak intrinsic pinning in the pristine region of the crystal. In figure 4 the two linear fits (solid (red) and dashed (red) line) with a change in slope indicate that at shorter time scales the average relaxation rate is slower than that at longer times. The above suggests a distribution in the pinning strength of the vortex configuration which partially fills the blind hole array.
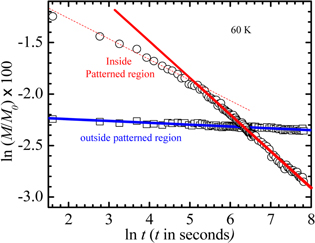
Figure 4. Magnetization relaxation response ln(M/M0) versus ln t inside the patterned (circles) and unpatterned (squares) regions as determined from MO images at 60 K (see text for details).
Download figure:
Standard image High-resolution image2.4. Effect of magnetic field pulse of varying pulse height on vortex distribution within the array
We now study the effect of a non-contact drive on nf inside the blind hole array. For applying a non-contact drive on the vortex configuration within the array we apply magnetic field pulses in the following way. The crystal is first zero-field cooled to below Tc and subsequently a field H1 is applied and MO images are captured at H1. H is then increased abruptly to a higher value H2 (H1 + δH, where we have used a pulse of height δH of 12 Oe). H is held constant at H2 for 20 s, after which H is reduced back to H1 and MO images are captured at H1. The above protocol is repeated by increasing the pulse height from δH to 2δH, 3δH, 4δH... and so on (see schematic in figure 5(g)). Note that irrespective of the size of δH, the MO images before and after the pulse are always captured when H returns back to H1, they are not captured at H2. In our measurements H1 is set at 36 Oe as, at 60 K, 36 Oe is just above the bulk penetration field of the crystal ∼ 30 Oe (estimated from M(H) curves at 60 K (not shown) similar to those shown in [13] at 50 K). We wanted to check if nf inside the patterned region increases easily with the application of magnetic field pulses of increasing height.
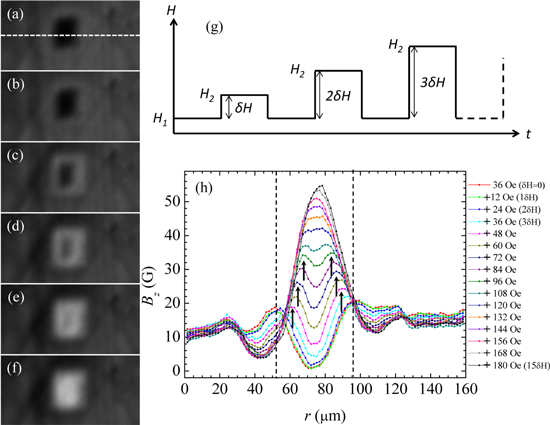
Figure 5. (a) MO image obtained at 60 K, 36 Oe before applying a higher field pulse. (b)–(f) MO images at 36 Oe obtained after one step change of field from H1 = 36 Oe to H2 = 60, 84, 108, 132 and 156 Oe, respectively (i.e. pulse height kδH = 24, 48, 72, 96 and 120 Oe, respectively), and back to H1 = 36 Oe. (g) Schematic showing the sequence of application of successive increasing field pulses. (h) Bz(r) profiles across the line shown in (a) at 60 K, 36 Oe after application of successive field pulses. The pulse height kδH corresponding to each profile is indicated alongside (see text for details).
Download figure:
Standard image High-resolution imageFigure 5(a) shows a zoomed in image of the patterned region obtained at H1 = 36 Oe before applying any field pulse. Figures 5(b) to (f) show the same region at 36 Oe after applying field pulses H2 = H1 + kδH = 60 (k = 2), 84 (k = 4), 108 (k = 6), 132, (k = 8) and 156 (k = 10) Oe, respectively. Figure 5(h) shows Bz(r) profiles measured across the line in figure 5(a) after application of successive field pulses. Clearly from the images in (a)–(f), as the pulse height is increased, the contrast of the patterned region changes from a darker to brighter contrast as compared to the surrounding unpatterned regions, and the brightened regions appear to be moving from the edges and towards the center of the array. This is also seen in the line scans in figure 5(h), where the peak in Bz (located by arrows) progressively moves inside the patterned region from the edges of the array with the application of pulses of increasing height. Thus it appears that with every succesive magnetic field pulse of increasing height magnetic flux is swept from the edges to the center of the array. This sweeping of flux from the edges of the patterned region towards the center of the array also results in a depletion of vortices near the edges of the array where we find a reduction in Bz at the edges of the array (see figure 5(h)). This effect naturally leads to a reversal and enhancement in the Bz gradient across the array; compare the Bz gradients inside the patterned region at H = H1 and at H = H1 + 15δH in figure 5(h) and note that the gradient in Bz for field pulse H = H1 + 15δH is opposite in sign and larger compared to that at H = H1. Note that we are always measuring Bz when H returns to H1 after the field pulse. However the difference in the profiles suggests a significant hysteretic response.
One may consider that the above effect is a result of additional vortices introduced in the patterned region by the field pulse (kδH), and these additional vortices are pushed deeper into the array with successive pulses. These vortices get trapped inside the array and collect near the center of the array and this would explain Bz increasing in the center of the array and the gradient inside the array reversing in sign. If this scenario were to be correct, then nf inside the patterned region would have increased quite rapidly with increasing pulse height. However we observe only a modest increase in Bz in the center of the array when a large kδH pulse is applied. Figure 5(h) shows that for k = 15, i.e. H2 = 216 Oe (= 36 Oe + 15 × 12 Oe), the mean Bz at the center of the array is about 54 G which corresponds to nf ∼ 0.28, while the size of the field pulse 15δH = 180 Oe is of the order of the matching field of the array (195 G). It is worthwhile comparing nf ∼ 0.28 obtained with these pulsing experiments where the peak value of 216 Oe is reached momentarily, with nf ∼ 0.87 obtained at a constant dc field of 216 Oe (see figure 3(d)) when H was applied by ramping the magnetic field slowly from 0 Oe towards the target field of 216 Oe. It appears that the effect of applying magnetic field slowly or quickly affects the blind hole patterned region differently. The increase in Bz inside the patterned region in the above experiment does not seem to be explained by trapping of flux inside the patterned region due to cycling of magnetic fields. From these measurements it appears that although there exists a sizeable number of sites available for occupation by the vortices they are not easily accessible with the application of magnetic field pulses. The mechanism does not appear to be one of pushing additional vortices into the blind hole array by increasing the magnetic field and trapping them on the blind hole pins. The above measurements suggest the metastability of the vortex configuration within the array. The metastable nature of the vortex configuration in turn allows a relatively easy method of reconfiguring vortices inside the patterned array as we shall show below.
2.5. Effect of multiple field pulses of fixed height on vortex distribution within the array
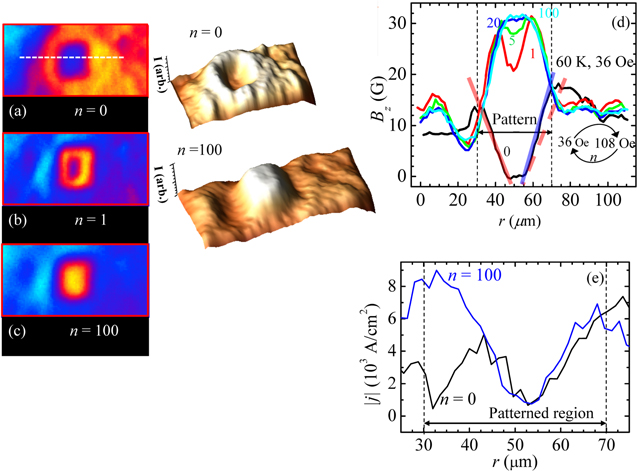
We investigate the above effect more closely. In this experiment, instead of applying single pulses of increasing height (as in the above experiment) we keep the height of each pulse fixed and apply the pulses a multiple number of times (n) and observe the effects on the flux distribution in and around the patterned region. Does the application of multiple pulses of fixed height lead to an enhancement in nf at the center of the array? In this experiment a single pulse cycle (n = 1) corresponds to H1 → H2 → H1. Higher field pulse cycles correspond to repeating H1 → H2 → H1, n number of times (n = 0 to 100), with H2 kept fixed at 108 Oe, and MO images are captured only after H returns to H1 = 36 Oe after n cycles. Figures 6(a) to (c) shows zoomed in images of the patterned region obtained at H1 = 36 Oe for n = 0, 1 and 100, respectively (H2 = 108 Oe). The three-dimensional maps adjoining figures 6(a) to (c) show that inside the patterned region, while there is a valley-like feature in the MO intensity I(x, y) (≡ Bz(x, y)) for n = 0, it transforms into a dome-shaped feature for n = 100 as flux is driven from the edges of the patterned region towards the center where they are trapped. Figure 6(d) shows Bz(r) profiles measured across the patterned region (along white line in figure 6(a)), for n = 0, 1, 5, 20 and 100. Note that in figure 6(d) for n = 0 at 36 Oe, the Bz(r) profile has the same non-uniformity (between the red dashed line and the purple solid line) as noted in figures 2(1) to (3). The profile near the left edge of the patterned region has a lower slope compared to the right edge. With n = 1 pulses, the concave like Bz profile in figure 6(d) transforms into a convex profile (red curve). In the MO image of figure 6(b) this behaviour shows up as orange MO contrast (regions with high Bz) entering inside the patterned region from the edges compared to figure 6(a) with a bluish core near the array center for n = 0. With successive pulses, for example by n = 20, Bz(r) near the center of the patterned region has significantly enhanced (see figure 6(d)). Figure 6(c) shows for n = 100, Bz ∼ 32 Oe (orange shade) is concentrated in the center of the patterned region.
Figure 6. (a) MO image obtained at 60 K, 36 Oe (n = 0). (b) MO image at 36 Oe obtained after one step change (n = 1) of field from H1 = 36 Oe to H2 = 108 Oe back to H1 = 36 Oe. (c) MO image at 36 Oe, with n = 100. The colour code represents the Bz variation shown in figure 6(d). The adjoining figures are three-dimensional maps of the MO intensity distribution shown in (a) and (c). (d) Bz(r) behaviour across the line shown in (a) for n = 0 (black), 1 (red), 5 (green), 20 (blue) and 100 (cyan). (e) Average current density distribution |j(r)| across the patterned region for n = 0 (black) and 100 (blue) (see text for details).
Download figure:
Standard image High-resolution image
Note that between n = 20 to 100 cycles the Bz profile remains almost unaltered, suggesting a maximum trapping of flux has been achieved with this procedure. The peak in Bz saturating to ∼ 32 G with n > 20 implies a peak filling fraction of nf ∼ 0.16 in the center of array and nf does not increase any further. In principle one would have expected that with H2 = 108 Oe applied during the pulses, nf should come close to a value of nf ∼ 108/195 ∼ 0.55. Figure 6(e) shows the behavior of the |jc(r)| profile [33, 34] determined across the patterned region for n = 0 and n = 100 cycles. Like figure 2(d), figure 6(e) shows the non-uniformity in the |jc(r)| profile for n = 0. With the application of pulses (n = 100) |jc| near the left edge increases significantly compared to the right edge. Thus it appears that with the application of field pulses the patterned array responds by uniformly enhancing the shielding currents circulating around the patterned regions. These enhanced shielding currents play an important role in preventing the enhancement of nf within the array when magnetic field pulses are applied. This effect does not happen when H is increased slowly. The above would help explain the difference in nf when H is increased slowly compared to when it is increased with a field pulse, as noted in the earlier section.
3. Discussion of results
The difference in the arrow locations (red and blue arrows) in figures 3(c) and (d) indicated that nf is not uniform in different regions of the patterned array at low H. As has already been mentioned, this observation suggests the existence of patches of vortex configuration within the array where each patch has a different filling fraction, nf, i.e. different patches have different nf. The patchy nature of the vortex configuration is more pronounced at partial matching conditions, i.e. at low field values which are less than the matching field. The patchy configuration becomes more uniform as the magnetic field approaches Bϕ; in figure 3(d) the location of the red and blue arrows begin to nearly coincide as H is increased. Recall from figure 2(f) that at 50 K we had found the right side outside the patterned region (location D) has slightly higher |jc| compared to the left side outside the patterned region (location A). We believe that the intrinsic pinning landscape in the pristine crystal is not uniform and in this non-uniform pinning background the crystal affects the uniformity of blind hole pinning. Due to a superposition of the pinning landscapes, that present in the pristine crystal and the blind hole pinning, the effective blind hole pinning landscape is not uniform. Due to this non-uniformity of the effective blind hole pinning landscape we observe non-uniform gradients in Bz(r) and |jc(r)| inside the patterned region in figure 2. Matching of vortices with the blind holes with a particular nf inside the patch depends on a balance between inter-vortex and vortex-pin interactions [27, 28] in the patch. As there exists small differences in the effective blind hole pinning within the array, patches with different nf begin to appear in different regions of the array. The presence of vortex states inside the blind hole array with different pinning strengths was also evident from different magnetization relaxation rates measured inside the patterned region at 60 K in figure 4. We investigated the possibility that the non-uniformity in the effective underlying pinning landscape within the blind hole pinning array may be a possible source of producing the metastable patchy vortex configuration. In figure 2(1), a comparison shows that the gradient in Bz inside the patterned region (that is for the orange line in figure 2(1)) is about 10 times that in the unpatterned region of the sample. Therefore it seems that the pinning in the underlying pristine unpatterned crystal is far weaker than the pinning of the blind holes. In such circumstances the extent of non-uniformity produced in the effective pinning of the blind holes by intrinsic (pristine crystal) pinning does not appear to be a very significant effect. Hence it seems unlikely that the effect of the non-uniformity of the underlying effective intrinsic pinning landscape on the pinning of the holes could be the only possible source for generating the metastable response inside the array. Another likely source of metastability at sub-matching fields could be the blind hole array itself. Even when the intrinsic pinning in the crystal is uniform vortices approaching from the edge of the patterned region towards its center would always experience a barrier due to vortices already present inside blind holes. The presence of these barriers would prevent the vortex state system from easily accessing the theoretically predicted ordered ground state vortex configuration composed of an ordered collection of multiple vortices pinned on each blind hole pin [27]. Experimentally it has been shown that unlike antidots, blind holes do not capture an equal number of vortices [24, 25]. Below the matching field, a situation could arise where multiple vortices are pinned at some blind holes while other holes remain unfilled. In such cases, patches with different nf could appear in different regions within the patterned area depending on the local balance between inter-vortex and vortex-pin interactions. Such a situation would be encountered even if the effective blind hole pinning is considered identical for all holes. Recent experiments show by direct observation that a one-dimensional (1D) periodic thickness modulation in a thin film can provide a scale invariant random potential, when the vortex lattice is oriented at an arbitrary angle with the periodic modulation [37]. At high magnetic fields, detailed observations including many thousands of vortices show that the scale invariant random potential disorders the vortex lattice. The 1D periodic modulation does not provide any 1D pinning features. Instead, it leads to disorder through the misorientation of the vortex lattice with respect to the 1D modulation. Here, we are investigating a two-dimensional (2D) periodic pinning array at sub-matching fields, which is quite a different situation. Nevertheless, we can speculate that incomplete filling within the 2D blind hole array, or misorientation between both lattices, modifies the collective pinning landscape within the 2D array. The observed patchy nature of the vortex configuration within the patterned region could arise from interactions between the pinning and the vortex lattices. At low fields, the barrier for the penetrating vortices can lead to additional disorder, enhancing the non-uniformity in the pinning landscape. Stronger inter-vortex interactions at high magnetic fields would reduce the degree of non-uniformity of vortices filling the blind holes. At higher fields, close to the matching field, both lattices would lock, reducing the non-uniformity in vortex arrangements. In fact we observe the non-uniformity in nf decreases with increasing H (see figure 3(d)). Some of the above features pertaining to the nature of the pinning landscape within a 2D periodic pinning array of blind holes are worth investigating in future.
We have explored the nature of metastability of the patchy vortex configuration within the array by cycling the magnetic field. Earlier studies on dynamic reordering effects [38] had investigated the effects of drive on a uniformly pinned vortex medium. Instead here we are studying the effect of drive on the non-uniform vortex state. To explain the details of the results reported in figure 6, we suggest the following. The magnetic field pulse generates a shielding current js. As different regions have patches of vortices with different effective pinning, js exceeds jc locally for a weakly pinned patch near one side of the array, while js would be smaller than jc in another stronger pinning patch within the array. Thus vortices in the weakly pinned patch near the left half of the patterned area are depinned and driven deeper into the array by the pulse while those in the strongly pinned regions near the right half remain unaffected. Thus the asymmetry in pinning around the patterned region may result in a directional flow of vortices into the patterned region, i.e. flow from weaker pinned patches inside the array towards the center of the array. In fact figure 6(e) shows that the |jc| value near the right edge of the patterned region is not affected much in comparison to the left edge where there is a significant increase in |jc| value as n changes from 0 to 100. The drive induced by the field pulses drives the weakly pinned patch of vortices towards the center of the array where they get pinned, resulting in an enhancement in Bz gradient near the left edge. By driving the metastable patchy vortex configuration, the magnetic field pulses enhance the |jc| circulating near the left edge and consequently the non-uniformity in jc between two edges (as seen in figures 2(d) and 3(b) and (c)) diminishes (see figure 6(e)). With multiple field pulses the shielding current circulating around the patterned array becomes uniformly large. This large shielding current circulating around the patterned array edges drives vortices away from the edges and compresses [39–41] the magnetic flux towards the center of the array. The presence of uniformly enhanced shielding currents circulating around the patterned array edges shields the interior of the array from continuous entry of flux as H is switched between 36 Oe and 108 Oe, due to which nf saturates to about 0.16 as noted earlier. Increasing the height of the field pulse is not sufficient to make additional vortices enter into the patterned array, due to which we do not observe an increase of nf with the pulse height. The presence of large shielding currents around the patterned array prevents any large increase in nf within the array. If H is increased gradually as in figures 2 and 3 to reach the target H at which measurements are performed then the shielding currents are much weaker and allow for easier flux entry into the patterned region. Thus the metastability and patchy nature of the vortex configuration allows a relatively easy way of producing flux reorganization and flux focusing effects within the blind hole array. To the best of our knowledge, such flux reorganization effects with field pulses within a nanopatterned array created in a single crystal have not been shown before either for blind holes or antidot lattices patterned in superconductors.
The metastable nature of these systems could be further explored by other means; for example, by studying the effect of thermal cycling on the vortex state that is reached with n = 100 in figure 6(d) or by repeated fast switching of driving current, which in turn would correspond to subjecting the vortex state to a high effective shaking temperature [38]. The high shaking temperature would allow the vortex state to reach a lower energy state. If the metastability arises solely due to the blind hole array, the consequent flux reorganization could lead the system to gradually approach a more ordered, and eventually, a completely ordered state. On the other hand, if the metastability arises due to an interplay between intrinsic pinning in the sample and the blind hole array, the system might continuously evolve into different metastable configurations without being able to approach a more ordered state. In this regard recall our observation of a dome-shaped Bz profile developed across the blind hole array with n = 100 field cycling (see figure 6, bottom figure in second column of figures). It is known that in bulk single crystals of high-Tc superconductors with ordered vortex configuration where the bulk pinning is negligible, the barriers from the sample edges result in a dome-shaped Bz profile [39, 42]. Thus the observed dome-shaped Bz profile with n = 100 field cycling suggests the vortex state within the array approaches a uniform distribution with repeated field cycling rather than becoming more metastable.
4. Conclusion
A superposition of a non-uniform intrinsic pinning landscape and uniform blind hole pinning results in an non-uniform pinning landscape within the blind hole array. We emphasize that although one may fabricate a nanopatterned structure (blind hole array in our case) which appears geometrically symmetric, there is an underlying non-uniformity in the effective pinning which leads to non-uniform field gradients inside the patterned region. The non-uniform pinning landscape within the blind hole array results in a patchy like vortex configuration of the array where each patch has a different filling fraction. Such a configuration is found to be metastable. We observe that the application of multiple field pulses of fixed height on such a configuration enhances the shielding current uniformly around the patterned array and consequently compresses the trapped flux towards the center of the array. The enhanced shield current prevents further entry of flux into the array unless the height of the pulse is increased. We believe our work is interesting for future studies on controllable pinning landscapes and flux focusing for applications. We believe our work suggests potential ways by which we can fabricate arrays of blind holes or pinning centers with comparable characteristics of mesoscopic dimensions in pure weakly pinned crystals where flux can be locally concentrated. These results are relevant not only for blind hole arrays, but also one could possibly explore similar behaviour in systems with different artificial pinning centers, like dopants, nano-rods etc, where the superconducting medium is singly connected and is present above or below the pins, as is the case for blind holes. Such studies would not only help in verifying the significance of the peculiarities of these pinning centers in inducing metastability in these systems, but also open up further possibilities for the generation of controllable pinning landscapes and flux focusing techniques for applications.
Acknowledgments
SSB acknowledges help from Dr Amit Banerjee and funding support from IIT Kanpur for the MOI facility setup in IIT Kanpur where all the experiments have been performed and DST Indo Japan and Spain (reference ACI 2009-0905) joint programs.