
Abstract
Interband magneto-absorption in semiconductors is reviewed in the light of the diamagnetic exciton (DE) concept. Beginning with a proof of the exciton nature of oscillating-magnetoabsorption (the DE discovery), development of the DE concept is discussed, including definition of observation conditions, quasi-cubic approximation for hexagonal crystals, quantum-well effects in artificial structures, and comprehension of an important role of the DE polariton. The successful use of the concept application to a broad range of substances is reviewed, namely quasi-Landau magnetic spectroscopy of the 'Rydberg' exciton states in cubic semiconductors such as InP and GaAs and in hexagonal ones such as CdSe, the proof of exciton participation in the formation of optical spectra in narrow-gap semiconductors such as InSb, InAs, and, especially, PbTe, observation of DE spectra in semiconductor solid solutions like InGaAs. The most fundamental findings of the DE spectroscopy for various quantum systems are brought together, including the 'Coulomb-well' effect, fine structure of discrete oscillatory states in the InGaAs/GaAs multiple quantum wells, the magneto-optical observation of above-barrier exciton. Prospects of the DE physics in ultrahigh magnetic field are discussed, including technological creation of controllable low-dimensional objects with extreme oscillator strengths, formation of magneto-quantum exciton polymer, and even modelling of the hydrogen behaviour in the atmosphere of a neutron star.
Export citation and abstract BibTeX RIS
1. 'Chronicle' of diamagnetic exciton
The first observation of the diamagnetic-exciton effect was presumably made by Zakharchenya [1]. In as far back as 1956, he studied the spectrum of the Wannier–Mott exciton in copper oxide crystals, making use of high electric and magnetic fields (see figure 1). In addition to the expected Stark and Zeeman effects, he has noted that there is a new unknown and unexpected phenomenon, namely slight periodic oscillations in the continuum (continuous absorption edge). Those oscillations had the frequency of the cyclotron resonance, which was reflected in the title of the article by Gross, Zakharchenya and Pavinskiy: 'Diamagnetic levels of an exciton in Cu2O and cyclotron resonance' published in 1957 [2]. Almost simultaneously, two articles went out in 1957 too, that belonged to American authors, Burstein and Picus [3] and Lax and Zwerdling [4] who had observed the magnetic-field absorption-continuum oscillations in indium antimonide and germanium, respectively. Excitons either in germanium or in indium-antimonide crystals had not been observed by that time (in germanium crystals that happened in 2 years [5], and in InSb in 22 years [6]). That is why the effect was unambiguously attributed to the continuum-density oscillations associated with the appearance of the Landau levels. No reference to the excitons or, accordingly, to the article [2] was made.
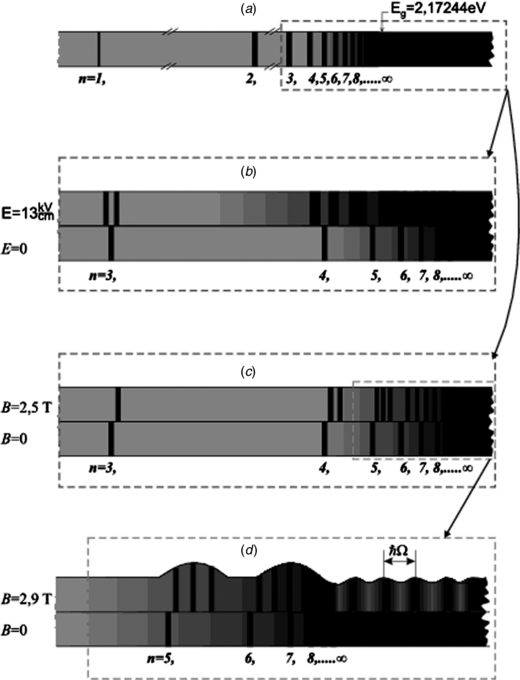
Figure 1. Spectroscopic photos of cuprous-oxide yellow series (a), the same if placed in a high electric field (b) or in a high magnetic field (c). Eg or n0 = ∞ correspond to 2.17244 eV. (d) The first observation of the oscillating magnetoabsorption. Spectral intensity variations are symbolically shown as undulations of the top border to guide the eye.
Download figure:
Standard imageWorks [3] and [4] have caused an unprecedented boom in magneto-optical studies of semiconductors. This helped to fill most of the data bank on the parameters of the band structure of the significant semiconductor crystals.
2. Proof of the exciton nature of the oscillating magnetoabsorption
Naturally, there appeared a task to find indisputable evidence for the exciton nature of this effect. Zakharchenya formulated this objective to the author of this work, a graduate student of the Ioffe Institute at that time. Provided that the commonly accepted interpretation of the phenomenon had been correct, there was seemingly full compliance with the requirements for the effect observability. However, an initial attempt to solve the problem with the use of a promising new semiconductor, gallium arsenide, did not produce results. In magnetic fields available at that time, the GaAs absorption edge remained smooth without any signs of oscillatory behaviour. This prompted us to perform test experiments with germanium crystals. Reproducing the experimental conditions of paper [4], we tried to find the necessary proofs in Ge first. We built a proof making use of three specific properties of the exciton absorption. First, excited states in the exciton spectrum can belong to different principal quantum numbers of the exciton. Second, the exciton states can be suppressed by the screening of the Coulomb interaction between the electron and hole. Third, a high magnetic field makes exciton 'one-dimensional', providing it with properties of a one-dimensional (1D) state. Figure 2 shows both the spectrum of oscillating magneto-absorption (OMA) in germanium crystals registered by us [7] and its modulated form obtained under the electric-field influence. There were additional weak peaks which could not be presumably (because of their energy positions) assigned either to the ground states of the exciton or to transitions between the Landau subbands. They could be most likely attributed to the excited states of exciton. In order to find out their nature, we applied the electric field parallel to the magnetic one (E//B). In this configuration, the electric field does not affect the energy positions of the peaks. In differential spectrum, these weak peaks grow with modulated electric field almost to the level of the ground state peak. Since the intensities of lines correspond here to the states' sensitivities to modulating field (the more the sensitivity the more the radius of the state a*), this effect has shown the exciton nature of the excited and ground states.
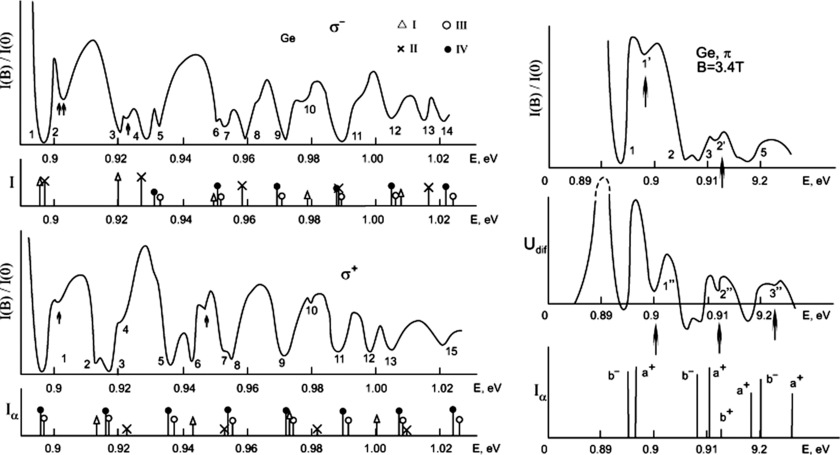
Figure 2. Oscillations in germanium registered under conditions close to those in experiments by Zwerdling and Lax [4]. The Faraday geometry, T = 4.2 K, B = 6 T. Transitions: (I) a+(l)ac(l+1), (II) b+(l)bc(l+1), (III) a−(l)ac(l+1), (IV) b−(l)bc(l+1). Hereinafter, the following notification for the Landau subband systems is used in the text : ac and bc—electrons with spin projections on the magnetic-field direction +1/2 and −1/2, correspondingly); a− and b−—heavy holes and a+ and b+ light holes with momentum projection M = ±3/2 and ±1/2, accordingly. The right part shows the low-energy fragment of this spectrum (π-polarization, B = 3.4 T) in comparison with the differential spectrum (modulation by the electric field E//B). The vertical lines correspond to the theoretical positions of the first DE transitions with the electron Landau quantum numbers lc = 0, 1 and 2. Numeration gives serial numbers of spectral lines. Positions of DE excited states are marked with arrows.
Download figure:
Standard imageAs a rule, the Coulomb interaction in an electron–hole pair can not be completely 'turned off' and exists in any of the cases of interband magneto-optical spectra. It can be destroyed only by screening with the charges of opposite signs. The condition of the complete screening can be written as a* > rscr, where rscr is the radius of the Debye–Hueckel screening. Depending on the exciton-state nonstationarity due to the exciton–scatterer interaction, screening charges and electric fields, there are various state lifetimes and the corresponding line widths. The latter predetermine the possibility of registering spectral lines from the excited states of the exciton series or of bound states in general. Magnetic field modifies the interaction of excitons with free carriers and defects, resulting mainly in the stabilization of the exciton states. Moreover, in a high magnetic field reducing the problem to a 1D model, there may already be arbitrarily weak bound state. A magnetic field application leads to a general 'flare-up' of absorption up to the values which correspond to those of the pure crystal on the average [8].
The effect of the exciton-absorption 'flare-up' in a magnetic field is illustrated by figure 3. It shows a general rise of the absorption level with increasing magnetic field in the germanium crystal doped up to the critical concentration ND*≈ 8 1015 cm−3. In the case of a crystal doped above this critical concentration, the total absorption at the edge (as a function of the incident radiation) is much lower than that in an undoped crystal without magnetic field.
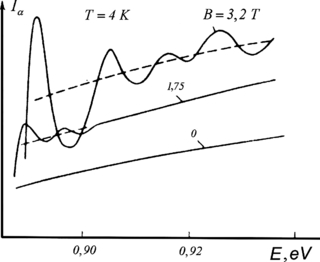
Figure 3. Signal proportional to the absorption intensity at different values of the magnetic field ('flare-up effect') for Ge samples with critical impurity concentration, Nd = 8 1015 cm−3. The dashed line shows the average level of absorption.
Download figure:
Standard image3. The concept of 'diamagnetic excitons'
Further investigations of both the OMA and exciton in semiconductors in a high magnetic field have enabled us to formulate the concept of the 'diamagnetic exciton' (DE) [9]. We have given such a name to special exciton states arising from the placement of the Wannier–Mott exciton in a high magnetic field. The criterion of the high magnetic field is the Elliott–Loudon criterion [10] (see figure 4):

where a* = (ℏ2/e2) (ε0/μ), Ω = ωcc + ωvc ≡ eB/μc is the sum of the cyclotron frequencies of electron and hole, and Ry* = μe4/2ℏ2ε20 is the effective Rydberg of the Wannier–Mott exciton. The DE state energies in the magnetic field are

Here ElM represents a series of transitions between the Landau levels without taking into account the Coulomb electron–hole interaction, ν is the principal quantum number of the one-dimensional exciton and the quantum defect δνug is a correction of ν for the finiteness of the magnetic field B. ElM depends on the Landau number l, moment projection M and magnetic field B. The effective Rydberg of the 1D exciton R∞(1) also turns out to be a function of l, M, and even B through the 1D reduced mass in the most common case. The quasi-discrete spectrum of these exciton states is clearly not restricted by the edge of absorption Eg as in the three-dimensional case. That is to say, it is stretched far into the region E > Eg.

Figure 4. Schematic representation of the ground-state wavefunction of the Wannier–Mott exciton (the sphere), the same for the diamagnetic exciton (the ellipsoid of rotation inside the sphere), and the Elliott–Loudon criterion.
Download figure:
Standard imageThus, the spectrum of hydrogen-like system in a high magnetic field can be described as follows. First, there is a sequence of the Landau subbands interacting in optical transitions. Second, each pair of subbands is accompanied by a singlet (ν = 0) and a number of doublet levels (ν > 0). Finally, these levels form Coulomb series for the large enough ν. With increasing magnetic field B, quantum defects δνug decrease. This, in its turn, leads to the increase of binding energy of the vth state. The binding energy of the ground state (ν = 0) increases infinitely (but logarithmically slowly) with B, what corresponds to a collapse to the centre. Figure 5 illustrates the overall picture of magneto-optical effects in the transitions between the Landau subbands and in transitions into DE states.
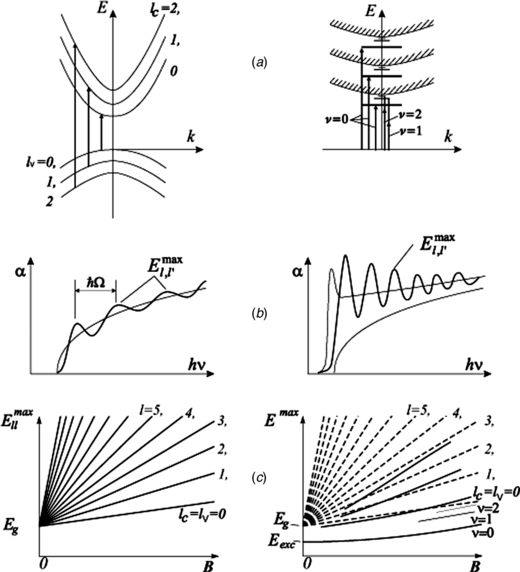
Figure 5. Diamagnetic exciton and transitions between Landau subbands: (a) optical transitions between Landau subbands (left) and between diamagnetic-exciton states with different Landau numbers (right); (b) absorption coefficients; (c) 'Fan charts' for transitions between Landau subbands (left) and for the diamagnetic excitons (right), dashed lines are for transitions between Landau subbands.
Download figure:
Standard image4. Quasi-Landau magnetic spectroscopy of the 'Rydberg' exciton states
The DE concept has been developed in detail for diamond-like semiconductor crystals in particular [11]. It has allowed us to satisfactorily explain and describe most of the available experimental data. The band structure parameters thus obtained for various semiconductors are of especial value.
However, it should be noted that this concept has proved to be inefficient to explain and simulate the magneto-optical data on some relatively wide-gap semiconductor crystals. In particular, it does not work in the very copper oxide, which the DE history began with. The crucial feature of this case is the existence of expanded series of the Wannier–Mott exciton even before the application of a magnetic field. As is well known, the copper oxide is unique in this respect. There are many excited (Rydberg) states of the hydrogen-like exciton series (up to the principal quantum number n0 = 10!) observed in the optical spectrum of the absorption edge of the most perfect samples. The inferior members of the series exhibit low-field effects, such as the Stark and Zeeman effects and diamagnetic shift, whereas the superior ones come to the dissociation edge as a result of the giant diamagnetic shift. The latter states form the oscillations of the continuum (a high-field effect). Along with copper oxide, 'lengthy' series were previously observed also in the tin oxide [12] and some other crystals.
Registration of 'lengthy' series is especially difficult in the case of diamond-like semiconductors with allowed direct interband transitions. It requires not only the material of the highest crystal-physical perfection but also the ability to produce extremely thin samples with thicknesses approximating the absorption length d ∼ αmax−1 (from submicrons to several microns). In doing this, defects or nonuniform stresses should not be brought in, and the density of surface states should be kept minimum.
For the first time in the case of diamond-like semiconductors, we have succeeded to do it when we used relatively 'thick' homoepitaxial layers of GaAs, which showed the low-temperature electron mobility (1–2) × 105 cm2 (V s)−1. The mechanical treatment, chemical etching and annealing in pure hydrogen had been consecutively applied. During the measurements, the samples were placed in special boxes of the cover glass. Next, they were deposited in the evacuated liquid helium immediately in a cryostat. Using these samples, the first 'lengthy' series of the Wannier–Mott GaAs exciton were registered. Without magnetic field, it included the states with principal quantum numbers n0 = 1, 2 and 3 and quasi continuum at n0 ≥ 3 (see figure 6). Placing these samples in a high magnetic field made it possible to observe unique spectra of magnetoabsorption (see figure 7). These spectra had a number of fundamental features, being the DE spectra in fact. Their interpretation required the application of both the quasi-one-dimensional DE-series concept and a theory of transitions obeying various additional selection rules [13, 14]. In these spectra, the Fano resonances were also first observed. These resonances are characteristic of the interaction of the discrete DE states with its own 1D continuum. This was first noted by Chemla (see paper [15]) who analysed our spectra (see figure 7). The GaAs DE spectra already obtained by us in 1973 had a very unusual view and consisted of many narrow lines. These lines resembled by the structure rather atomic absorption spectra than the 'classical' OMA, i.e. oscillating magnetoabsorption. We observed 'lengthy' series for the first time in GaAs (1971–1972) [13, 14]. In addition, figure 8 shows a quantitative GaAs DE spectrum, namely the absorption-coefficient spectrum, measured later [16]. We have carried out similar experiments in InP (1982) [17], in CdTe (1988) [18], and also in ZnTe and ZnSe [19–21]. Let us besides emphasize the InP experiments [22] demonstrating both a row of the DE series and a very sharp transition from the low- to the high-field mode (see figure 9).
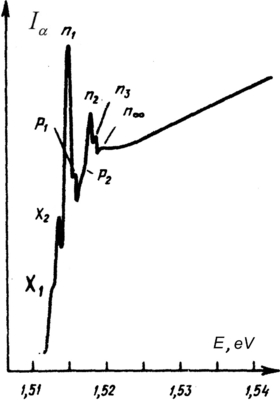
Figure 6. The spectrum of the absorption edge of GaAs crystals at T = 1.7 K (a 'lengthy' series, which includes the states with n0 = 1, 2, and 3). X1,2—exciton-impurity-complex (EIC) transitions, p1,2—EIC first excited states.
Download figure:
Standard image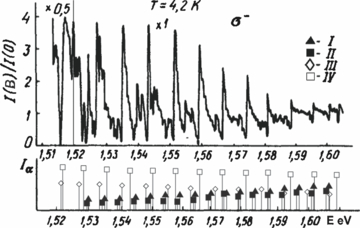
Figure 7. The first observation of diamagnetic excitons in GaAs with fine multiple-line structure (1972–1973). Note the form characteristic of the Fano effect. T = 4.2 K, B = 2.5 T. Transitions in the Faraday geometry: I—a−ac, II—b−bc, III—a+ac, IV—b+bc.
Download figure:
Standard image
Figure 8. The absorption coefficient in GaAs under a high magnetic field: (a) σ+ spectrum, (b) σ − spectrum. The Faraday geometry, T = 1.7 K. The dashed line corresponds to B = 0. Spectral fragments characteristic of the Fano effect are shown in the frames. Bottom: theoretical spectra, right top: transition notations.
Download figure:
Standard image
Figure 9. Diamagnetic exciton in indium phosphide. The Faraday geometry, T = 2 K, B = 7.5 T, σ+ polarization. Bottom: DE theoretical spectrum, DE binding energies being marked. Dissociation edges are shown by short vertical lines connected with DE ground states by declined lines. Symbols designating DE ground states are the same as in figure 8.
Download figure:
Standard image5. Developing the concept of Quasi-Landau magnetoabsorption by the exciton 'Rydberg' states in semiconductors: InP, GaAs and CdTe (years 1990–94)
As is well known, the studies of the behaviours of highly excited states of atoms and molecules have formed the basis of a new physics field. It played a prominent role in the development of the interstellar-matter physics and was named 'Rydberg States of Atoms and Molecules' [23]. The properties of Rydberg atoms are to be naturally considered with the aim of applying the results to the analogue of the hydrogen atom in semiconductors, i.e. to the Wannier–Mott exciton. Table 1 compares the hydrogen excited-state properties and those of an exciton in a typical semiconductor compound of A3B5 type, namely in indium phosphide, InP [22].
Table 1. Comparison of parameters of the ground and excited states of hydrogen atom and those of the Wannier–Mott exciton in InP.
| Hydrogen atom | Semiconductor | |||||||
|---|---|---|---|---|---|---|---|---|
| Parameter | Dependence on n0 | Measure unit | n0 = 1 | n0 = 30 | Coefficient | n0 = 1 | n0 = 2 | n0 = 3 |
| <r>, a* | a0n02 | 10−8 cm | 0.53 | 480 | ε0 /µ | 106 | 424 | 954 |
| τ | τ0n03 | 10−12s | 10−4 | 4.1 | ε02 /µ | 0.2 | 1.6 | 5.4 |
| Ry* | Ry*/n02 | 10−3 eV | 13 600 | 15 | µ/ε02 | 6.8 | 1.7 | 0.8 |
| ΔE (Δn0 = 1) | 2Ry*Δn0n0−3 | 10−3 eV | 10 000 | 1 | µ/ε02 | 5.0 | 0.6 | 0.2 |
| B*(βn02 = 1) | a0−2n0−2 | T | 2.5 · 105 | 2.7 · 102 | µ2 /ε02 | 6.25 | 1.56 | 0.69 |
We can see that the InP excitons with principal quantum numbers n0 = 3–4 correspond to the excited hydrogen-atom orbits with principal quantum numbers n0 of an order of 30. It is so due to both the high permittivity ε0 and low reduced effective mass µ. In relation to the Rydberg states of excitons in semiconductors, this allows us to propose the following modification of the Elliott–Loudon criterion:

which implies that the high-field mode for the excited states can be achieved in the magnetic field n02 times lower. When this condition is fulfilled, the corresponding magnetic-field dependences of the absorption-maximum positions will be linear (as for the Landau levels). If not, in the fields below critical (β n02 = 1), the dependences are approximately quadratic in accordance with the diamagnetic shift in semiconductor crystals. Figure 10 demonstrates this fact well for InP taken as an example [22]. The same situation takes place for GaAs, CdTe and a number of other semiconductor crystals. Figure 11 presents fragments of the InP absorption spectrum [22], which show DE series including a number of quasi-1D excited states.
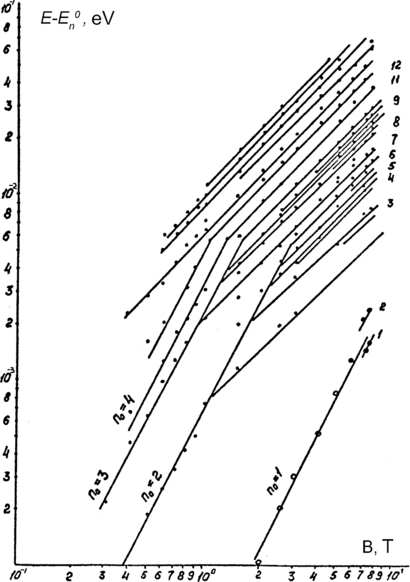
Figure 10. Fan chart for InP in logarithmic energy coordinates (Emax − E0n) versus B, where E0n represent different excited-state energies with n0 = 1,...,5 at B = 0. Kinks mark transitions from the weak-field conditions to the strong-field ones. Any weak-field part has a nearly quadratic slope (diamagnetic shift) whereas a strong-field part is quasi-linear.
Download figure:
Standard image
Figure 11. Fragments of the InP DE spectrum corresponding to the quasi-one-dimensional DE series. The DE states with quasi-one-dimensional quantum numbers ν = 0,2,.. are detectable. Numeration gives serial numbers of spectral lines the same as in figure 10.
Download figure:
Standard image6. Diamagnetic excitons in hexagonal crystals
The overwhelming majority of the DE studies had been performed in diamond-like semiconductors. For them, the theory of the spectra of transitions between the Landau subbands (they form the basis of the DE spectra) was formulated long ago, as far back as 1966 (Pigeon and Brown [24]). In recent years, the role of hexagonal-type GaN crystals significantly increased. That is why we had constructed a theory of the spectra of transitions between the Landau subbands for hexagonal semiconductors too [25]. This allowed us to further develop the quasi-cubic approximation for hexagonal crystals, which is suitable for the analysis of their magneto-optical spectra and calculations of key band-structure parameters [26]. Figure 12 shows a fan diagram typical for the hexagonal A2B6 crystals. In the case of CdSe, it consists of two 'fans' separated by the value of the crystal splitting of the valence band.
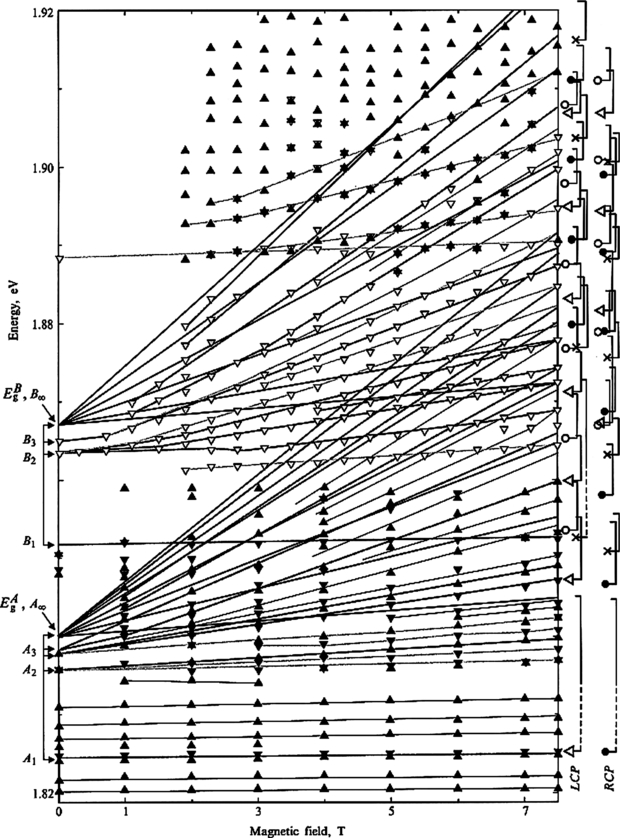
Figure 12. Fan charts for the DE series A and B in a hexagonal CdSe crystal. A vertical scale on the right shows an interpretation of transitions in the quasi-cubic approximation. Designations are analogous to those for cubic GaAs crystals, see figure 8.
Download figure:
Standard image7. The first observations of excitons in narrow-gap semiconductors: InSb, InAs, HgCdTe (1979–83) and diamagnetic excitons in narrow-gap (gapless) semiconductors
Prior to the 1980s, the exciton absorption in narrow-gap semiconductors was not observed. It seemed to be natural because of microscopic exciton binding energy predicted theoretically in such crystals. For example, it would be merely 0.5 meV in InSb. Nevertheless, InSb was one of the first objects where the OMA with typical DE signs was observed, as early as 1957. Taking into account the magnetic-field exciton-absorption flare-up effect found by us, it was natural to assume that excitons in InSb appear in the presence of the field.
The exciton-absorption spectra were first obtained in InSb crystals in the following way [6]. We had preliminarily selected samples with extremely low concentration of free carriers in order to avoid the screening of the Coulomb interaction between the electron and hole by free charges. Next, to detect excitons in InSb, we applied a magnetic field. Figure 13 represents the results thus obtained.
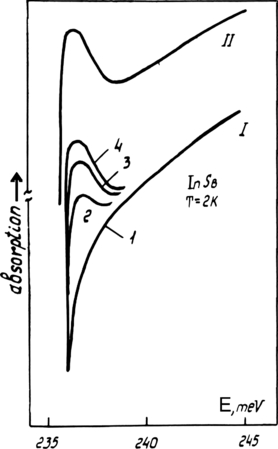
Figure 13. The Wannier–Mott exciton registration in indium antimonide. Magnetic-field-induced flare-up of exciton-absorption maximum: (I) before annealing, for different magnetic fields ((1) B = 0; (2) B = 5 mT; (3) B = 9 mT; (4) B = 12.5 mT); (II) after annealing, no magnetic field, T = 2 K, p = 6×1012 cm−3, d = 13 µm. I and II are separated simply to aid the eye.
Download figure:
Standard imageThe spectra of the exciton in InAs [27] were obtained in a similar scenario. In a similar way we have dealt with quasi-binary solid solutions CdHgTe [28] where the corresponding band gap is close to that in InSb at the cadmium concentration of x = 0.2 (see figure 14).
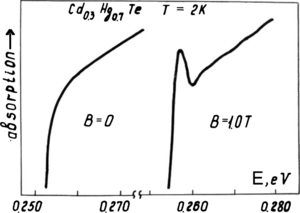
Figure 14. Flare-up of the exciton ground state in Cd0.3Hg0.7Te under magnetic field.
Download figure:
Standard image7.1. Observation of a quasi one-dimensional behaviour of excitons in InSb in a high magnetic field (1982–85)
When working with InSb, the Elliott–Loudon criterion values β > 102 are easily achieved. This implies the possibility of modelling the entirely one-dimensional behaviour of the exciton. Figure 15 shows two first absorption maxima in an InSb crystal in the magnetic field. One can see that the view is similar to the spectrum calculated for a quantum wire [29]. The spectrum consists of a series of discrete levels of the 1D exciton with ν = 0, 1, etc. which move into a continuum with the absorption level obeying the inverse-square-root dependence on energy. The states are described by the Landau numbers 0 and 1 and registered in a field less than 4 T. With further increase of the field up to about 8 T, an additional structure appears at the continuum tail. The structure reproduces the distance between the Landau levels of holes [30] (see figure 16). Figure 17 represents an InSb DE spectrum and our interpretation of it. They have allowed us to calculate the most comprehensive set of band structure parameters of this crystal [31].
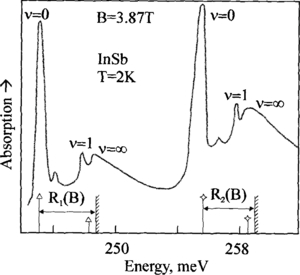
Figure 15. One-dimensional series of diamagnetic exciton in InSb. Line shapes of the first OMA maxima in the σ− spectrum in InSb at 2 K, B = 3.87 T. Bottom: theoretical positions of the maxima for the DE series originating from the transitions: (I) a+(−1)ac(0), (II) b+(−1)bc(0), including dissociation edges.
Download figure:
Standard image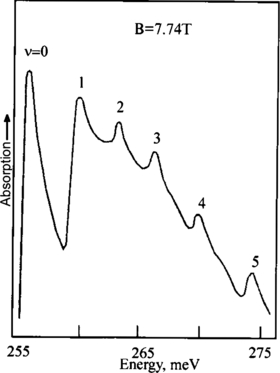
Figure 16. The appearance of fine structure against the background of the continuum of the DE states in InSb at more high magnetic field.
Download figure:
Standard image
Figure 17. Diamagnetic exciton spectra in InSb for principal orientations of crystallographic axes relative to magnetic field, T = 1.8 K. Transitions involved: (I) a+(l)ac(l±1); (II) b+(l)bc(l±1); (III) a−(l)ac(l±1); (IV) b−(l)bc(l±1). The theoretical spectra include the binding energy of the DE ground state (ν = 0). The maxima corresponding to DE excited states are specified by arrows. The additional transitions appearing in the B//[1 1 1] orientation are indicated by dashed arrows.
Download figure:
Standard image7.2. Proof of exciton participation in the formation of magneto-optical spectra of PbTe (1986)
Observations of exciton spectra in narrow-gap semiconductors have significantly expanded the range of semiconductors with the dominance of the Coulomb interaction in the processes of interband optical absorption. It has been possible owing to the original use of the effect of exciton-absorption flare-up of in the magnetic field.
A clarification of the exciton role in the case of PbTe magneto-optics is an extreme task. Here, the permittivity reaches 600–1000, and substantially greater value β can be easily achieved.
As a result, possible exciton binding energy is so microscopic that it has the order of a few tenths of µeV. Therefore, the exciton can be destroyed by the thermal motion even at cryogenic temperatures. However, for such an exciton binding energy, any low magnetic field makes exciton one-dimensional (see the Elliott–Loudon criterion, Formula 1). As is well known in the 1D case, the bound state can form in an arbitrarily small attractive potential. A paradoxical situation comes out: (1) an exciton is formed in any very low magnetic field, and (2) its formation probability is the higher, the lower is the probability of the electron–hole binding in the absence of a magnetic field. Then, the question arises: what is the role of excitons in the OMA formation in crystals like PbTe, in which the direct (without magnetic field) observation of excitons is almost impossible? So, the proof of the essential role of the diamagnetic excitons in the observation of an oscillatory dependence of the absorption edge of these crystals is the key moment of the DE physics.
To answer the above question, we have registered the PbTe OMA (see figure 18) and got differential electro-absorption spectra in crossed electric and magnetic fields [32]. The differential signal appeared to be very peculiar. Its amplitude rapidly increased with the fixed bias up to 3 V cm−1 and then fell again to almost zero (see figure 19). This decline is linear in the scale corresponding to the dependence of probability of impact ionization of large-radius excitons by free electrons in the accelerating electric field (see figure 20). Using these experimental data, we have been able to extract the PbTe-exciton radius and binding energy as a function of applied magnetic field as well as the values of the effective masses of electrons and holes [32].
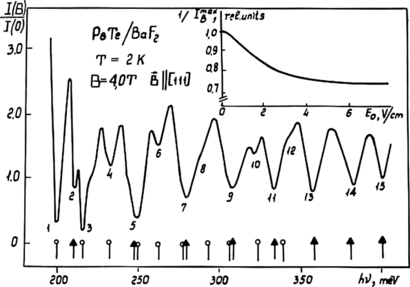
Figure 18. Oscillatory magnetoabsorption in heteroepitaxial films of PbTe/BaF2. B//[1 1 1], T = 2 K. Bottom: the theoretical spectrum calculated for the heavy-mass (o) and light-mass (Δ) series. Inset: reciprocal transmission versus E0 [32]. Numeration gives serial numbers of spectral lines.
Download figure:
Standard image
Figure 19. Differential electroabsorption in PbTe/BaF2 for E0 < E0* and E0 > E0* plotted against a magnetic field B//[1 1 1]. λ = 3.39 µm, T = 2 K, E1 = 0.2 V cm−1. Values of E0: (a) 3 V cm−1, (b) 10 V cm−1. Extremum notation: 'l' and 'h' denote the light- and heavy-mass series, the number specifying the Landau quantum number for Δl = 0 selection rules. Inset on the right compares, on an enlarged scale, fragments of the electroabsorption spectrum with the OMA spectrum for E = 0 near the extremum to explain the experimental evaluation of RB. Inset on the left presents magnetic-field dependence of (c) exciton Rydberg and (d) E0* [32].
Download figure:
Standard image
Figure 20. Shape of the dependence of differential signal on electric field E0 at the extremum of the OMA spectrum. The inset presents a fragment of this dependence on the form of ln(ΔI/E0m) plotted against E0−2 for m = −3/2. (Light-mass extrema, with Bmax = 5.2 T, 1, 2 and 3 stand for different samples) and the same for Bmax = 4.26 T (4 and 5 identify different samples). The calculated values of E0* obtained from the slopes of the straight lines are: 1,2,3–0.5 V cm−1; 4–6.2 V cm−1; 5–5.8 V cm−1 [32].
Download figure:
Standard image8. Observation of the diamagnetic-exciton spectra in semiconductor solid solutions
The magnetic-field growth contributes to the formation of exciton states until there occur potential wells able to capture electrons and holes separately, which destroys the exciton. Such a role could be played, for example, by a defect potential or by potential fluctuations in either solid solutions or doped semiconductors.
We have investigated the formation of the DE spectra in semiconductor solid solutions and carried out the first observation of the DE spectra in semiconductor compounds InGaAs [33] (see figure 21) and HgCdTe (1989–93) [34] as well as in AlGaAs [35] (2004–2008). These experiments allowed us to observe the DE extended spectra, which creates a possibility of accurate determination of band parameters for a given composition.

Figure 21. The spectrum of the diamagnetic excitons in InxGa1-xAs solid solution (x = 0.53) epitaxially grown on InP substrates. B = 7.5 T, T = 2 K, free samples. Markings are analogous to those for cubic GaAs crystals, see figure 8.
Download figure:
Standard imageHowever, further magnetic-field increase leads to the broadening of the DE lines and, finally, to presumable destruction of the spectrum (see figure 22).

Figure 22. The dependence of the linewidth and oscillator strength of the diamagnetic excitons in In0.53Ga0.47As on the magnetic field. T = 2 K, free sample. The dashed fragment is given simply to aid the eye. Magnetic field dependence of the oscillator strength f(B)∝(B)αmax (B): (1) σ+ spectrum, a−(1)ac(0) and b−(1)bc(0) transitions, (2) σ− spectrum, a+( − 1)ac(0) and b+( − 1)bc(0) transitions. The dashed lines show contribution of magnetic (spin) line splitting not resolved experimentally.
Download figure:
Standard image9. Development of the diamagnetic-exciton concept and its application to a broad range of semiconductor crystals
We have used the DE concept in a wide range of semiconductor crystals. Among the experimentally studied crystals, there were more than 15 semiconductors including compounds most attractive from the standpoint of practical applications. Figure 23 presents a chart of substances, that shows their positions on the scale of energy gaps. The values of the parameters β and magnetic fields needed to meet the criterion β = 1 are also indicated. The observed pattern appeared to depend to a great extent on the initial spectrum of the Wannier–Mott exciton (or lack thereof). Possible variants of initial spectra for various typical cases are also shown in figure 23. A suitable method to calculate the accurate parameters of the crystal band structure was developed in all of these cases. Both the approximate interpretation of the spectra and the binding-energy calculation for each DE state were the common part of the methods. This has allowed us to find out the energy of transitions between the hidden Landau subbands [11, 36].
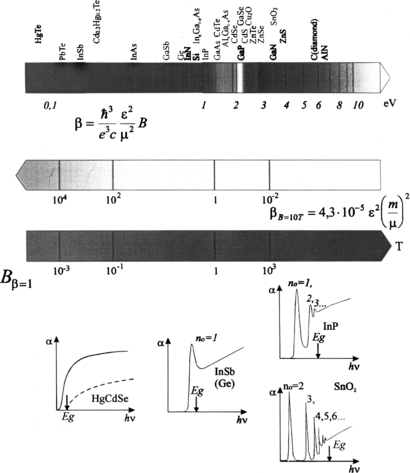
Figure 23. Scheme of the fulfilled DE researches in semiconductor crystals. The bottom shows the typical absorption edges prior to magnetic-field application. The upper arrow shows the forbidden-gap range of used crystals, Eg (eV). The β values increasing from left to the right are given underneath at B = 10 T. The last arrow shows the magnetic fields necessary to achieve β = 1.
Download figure:
Standard imageSeveral methods of calculating the band parameters from the DE spectra were developed. The comparison of transitions in the right- and left-circular polarizations is one of the simplest and most convenient methods. It is based on the difference in the corresponding selection rules for transitions (Δl = + 1) and (Δl = −1) where l is the Landau quantum number. Subtracting the transition energies from each other, one can find the sum of two adjacent cyclotron energies for electrons and light and heavy holes (see figures 24 and 25). A more fundamental though laborious method implies the creation of an optimizing program, which would compare a full set of experimental data with the calculated spectrum constructed with varied parameters. Figure 26 illustrates the results obtained with the use of such a program. Here, absolute minima of standard deviations for each of the varied parameters are well monitored. The method sensitivity is high and allows us to determine not only the parameters evidently involved in the formation of the spectrum of transitions between Landau subbands but also the permittivity controlling the DE binding energy. In doing this, an optimization graph can be constructed for each of the optimizing parameters apart. The latter can make evident the possible error for each determined value.

Figure 24. The method of calculating the parameters of the band structure of semiconductors, which uses a comparison of DE spectra in right- and left-circular polarizations. InP crystals at T = 2 K, B = 7.5 T, the Faraday geometry. The straight lines are least-squares fits.
Download figure:
Standard image
Figure 25. (a) Dependence of m/m*c in InSb on Eg/(2Ec + Eg) obtained from a direct analysis of the OMA spectra with isolation of double cyclotron energies for the electron. The straight line is a least-squares fit. (b) Dependence of dimensionless differences ΔE and half-sums on Eg/(2Ec+ Eg) for light hole transitions from lv+ = −1,0 states. The straight lines are least-squares fits.
Download figure:
Standard image
Figure 26. Sums of squared deviations between experimental OMA spectrum (after Coulomb-interaction corrections for interband transitions) and theory for the diamagnetic excitons in InSb under variation of the energy band parameters Ep, F, γ1,2,3, k, q, N1 and dielectric constant ε0 obtained by computer fitting.
Download figure:
Standard imageA substantial portion of these experimental and theoretical studies has been described in two books [11, 36]. In the latter there is a chapter entitled 'Interband magneto-optics of semiconductors as diamagnetic exciton spectroscopy'. Mainly, these books covered the results of earlier DE studies included in the doctoral R P Seisyan's thesis, 'Spectroscopy of diamagnetic excitons', 1978. They did not include research into low-dimensional systems carried out later. Among them, there are, first of all, studies of quantum wells and, further, of the exciton polariton.
10. Quantum-well magneto-optics (diamagnetic exciton in a quantum well)
We have carried out one of the first observations of the OMA in GaAs/AlGaAs quantum wells [37]. To analyse magneto-optical spectra, a theory of DE in a quantum well was proposed. It allowed us to calculate the binding energies of the DEs related to various Landau numbers at different size-quantization levels [38] (see figure 27). We used both this theory and the corresponding technique in all subsequent works where the 2D-state magneto-optical effects appeared in one or another way. Making use of the binding energies, one can restore the positions of the Landau levels. In doing this, one can determine the reduced effective mass of excitons involved in the quantum-well optical absorption. The exact value of the initial energy of a size-quantization level (see figure 27) can be also found out. Besides, we have studied some new specific magneto-optical effects of low-dimensional states. Let us dwell on 'the Coulomb-well effect', the magneto-optics of superlattices and the artificially created 'above-barrier' exciton.

Figure 27. Right: quantum-well magneto-optics (diamagnetic excitons corresponding to different size-quantization and Landau levels lN). MQW in the GaAs/AlGaAs heterosystem taken as an example. Lz = 8 nm, lN = 0...19 are the electron Landau-level numbers in the first size-quantization subband. Left: DE binding energy calculation for different size-quantization subbands and for different Landau level numbers: 0...3 correspond to I...IV; 1...5 correspond to the quantum well transitions: HH1E1, LH1E1, HH3E1, HH2E2 and HH3E3, accordingly for Lz = 13 nm [32].
Download figure:
Standard image10.1. First magneto-optical observation of the 'Coulomb-well' effects and oscillatory states in the InGaAs/GaAs quantum wells (1993–94)
The 'Coulomb well' effect [39] appears as one of the most specific manifestations of the magneto-optics of 2D state. It exists due to an additional localization of the hole and owing to its Coulomb attraction to the electron confined by the quantum-well potential. In principle, such an effect exists in any type of quantum wells, in quantum wires, and in quantum dots. However, most distinctly, it manifests itself in the case of the mixed-type heterojunction, e.g. in the (In,Ga)As/GaAs heterojunction. In such a system, there concurrently exists a 'mixture' of heterojunctions of types I and II. As a result, an attractive potential for both electron and heavy hole as well as a repulsive potential for both electron and light hole are simultaneously present in a layer of InGaAs ternary solution. In such objects, magneto-optics of exciton with a heavy hole is described within the conventional theory [40–42], whereas the 'light-hole' exciton gets a number of specific features. The 'light-hole' exciton does not create the usual 'fan' diagram (see figure 28) until the magnetic field becomes high enough. The 'Coulomb well' reveals itself by the formation of a series of discrete oscillatory states (see figures 29 and 30). We observed such a magneto-optical phenomenon for the first time. In the most complete form, the work by R P Seisyan with co-authors on the 'Coulomb well' formed in the (In, Ga)As/GaAs heterostructure was described in the book [43], published in Kerala, India. The relevant chapter is called 'Fine structure of excitons in high quality InGaAs/GaAs quantum wells'.

Figure 28. Fan diagrams of an InxGa1-xAs sample; x = 0,045, Lz = 8 nm, Lb = 82.2 nm in LCP and RCP polarizations. The true Landau fans are shown by straight lines (Landau-level reconstruction for excitons of the first heavy hole size-quantization level). l denotes the Landau quantum numbers. The rectangles are for GaAs barrier first maxima, circles are for HH1E1, diamonds are for LH1E1 and LH3E1, and the triangles are for additional transitions in the LH–E1 system of DE maxima.
Download figure:
Standard image
Figure 29. Observation of the Coulomb-well oscillatory levels in the (In,Ga)As/GaAs heterosystem. n = 2...10 are numbers of the oscillatory levels.
Download figure:
Standard image
Figure 30. Calculated 'Coulomb well' and CW oscillatory levels.
Download figure:
Standard image10.2. Observation of above-barrier exciton and its magneto-optics (1996–2000) [44]
The behaviour of artificially produced 'above-barrier' exciton in the magnetic field is another peculiar magneto-optical phenomenon of the 2D system of quantum wells and superlattices. The above-barrier exciton occurs in a system of superlattices separated by enlarged barriers. Whereas the band structure of a superlattice is an alternation of allowed and forbidden 1D minibands, the enlarged layer (barrier) is analogous to an impurity centre in a primary crystal lattice. As a result, discrete 'impurity' levels form in the forbidden minibands. Among the levels are the ones situated at the above-barrier energies.
Bragg ordered superlattices are optimal from the standpoint of spatial localization of an above-barrier electron. In them, the thicknesses of the layers are one quarter of the de Broglie wavelength of electrons with energy corresponding to the above-barrier state. At the same time, the enlarged barrier is to be formed by the layer with a thickness equal to half de Broglie wavelength. Under such conditions, as calculations show, the depth of penetration of electrons into the region of superlattice mirrors is quite limited. The DE magneto-optics was observed just in such a heterostructure. Figure 31 shows the design of the developed heterosystem, and figure 32 presents the corresponding fan chart and their analytical treatment taking into account the DE binding energies for the minibands and localized state. As follows from the experimental data, the oscillator strength of the artificial above-barrier exciton exceeds that of the exciton ground state in a superlattice. This fact confirms the exceptional efficiency of interferencial above-barrier localization in the Wigner–von Neumann scenario.

Figure 31. Schematic band structure and cross-section of the sample for upper-barrier exciton localization. The structure consists of 10.5 periods, each including a 13 nm GaAs layer surrounded by 10 In0.1Ga0.9As/GaAs supperlattices with layer thicknesses 3.4 and 6.5 nm, correspondingly. Computed electron and hole envelopes of the waive functions for above-barrier states are shown at the top and bottom of the band scheme.
Download figure:
Standard image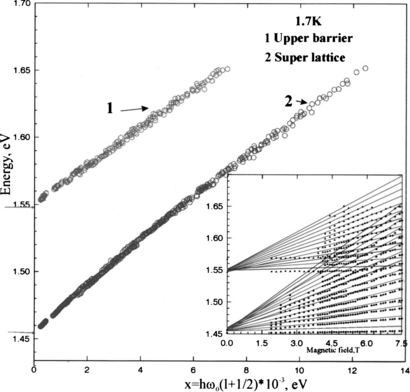
Figure 32. Fan diagram formed by the main SL exciton state (SLE) and an above-barrier exciton (ABE) in the coordinates x = ℏω0(l+1/2). The diagram was constructed according to the energies of experimental peaks adjusted by the computed binding energies of excitons (see inset). The slope of these lines gives the reduced cyclotron mass as a function of the transition energy.
Download figure:
Standard image11. Exciton polariton and its role in the interband magneto-optics of semiconductors
To study the exciton polariton (EP), the integrated absorption K of the exciton absorption line can be chosen as the most useful and informative response function. It is defined as  where γ = Γ/ℏ is the EP non-radiative damping parameter. For bulk-EP waves propagating in a quasi-homogeneous medium with some spatial dispersion, the integrated absorption is expressed by an analytical dependence derived and studied in paper [45]. As was shown, when parameter γ increases from γ = 0, the integrated absorption also increases in accordance with the law K(γ) = (4Kmax/π)(γ/γc). At γ = γc, the maximum value
  is achieved. Further increase in γ (γ/γc > 1) does not change K(γ). The critical value
  of the dependence inflexion corresponds to the equality of radiative and non-radiative dampings. Here, ω0 and ωLT are the resonance frequency of the transition into exciton ground state and longitudinal-transversal (LT) splitting, correspondingly, ε0 is the background permittivity and M is the exciton translational mass.
This dependence is fundamental in analysis of both the exciton absorption and exciton-polariton one. At γ/γc > 1, it provides a possibility of determining the LT splitting and transition oscillator strengths. When the non-radiative damping is below the critical value, the EP integrated absorption is its linear function and decreases to zero together with it, irrelatively to the damping physical nature. Among the factors of the non-radiative damping, there may be impurities, defects, phonons, electric fields, free carriers, other excitons, etc.
Observations of the fine structure of the exciton-polariton absorption in the broadened quantum wells and barriers (1999–2003) were conducted using samples with multiple quantum wells. In those experiments, the barrier layer was relatively wide, so that it did not fit the definition of 'quantum' one. Nevertheless, in some 'above-quantum' range of thicknesses, such a layer can be considered as quantizing the exciton as a whole. In the InGaAs/GaAs system, we observed a fine line structure belonging to the exciton polariton from the GaAs barrier between quantum wells InGaAs. When the physical barrier thickness differed from the exciton one by the doubled radius of the light-and-heavy-hole exciton [46] (see figure 33), this structure demonstrated 'exciton interference'.

Figure 33. DE interference in enlarged barrier of the (In,Ga)As/GaAs heterosystem. Optical density of MQW heterostructure enlarged GaAs barriers with thickness 82.2 nm (1) and 75.8 nm (2). The theoretical spectra of exciton-polariton interference and exciton quantization as a whole are given at the bottom.
Download figure:
Standard imageIn the case of phonons, one can introduce the critical temperature Tc determined by the condition γ(Tc) = γc, provided that the function γ(T) is monotonous. The study of temperature dependence of the integrated absorption of various crystals and multiple quantum wells allowed us to observe the typical behaviour of this quantity (see figure 34), which was described above. We have been also able to determine such parameters as oscillator strength and the longitudinal-transverse splitting [46–49] (see figure 35). We partly use these results below to verify the EP nature of the diamagnetic exciton. A series of new observations of the effects of the EP integrated absorption was carried out in 1991 to 2003. These included the first observation of EP in semiconductor solid solutions AlGaAs [49] (see figures 36 and 37; 2003) as well as the recent study of the EP integrated absorption in multiple quantum wells [50] (2006–2011).

Figure 34. The dependence of the integrated exciton absorption in ZnSe on the temperature (increasing right to the left, initial ZnSe exciton spectrum at 2 K is shown on the right).
Download figure:
Standard image
Figure 35. Temperature dependence of the exciton-polariton integrated absorption in a variety of crystals and in AlGaAs/GaAs MQW.
Download figure:
Standard image
Figure 36. Extraction of absorption spectra from the optical transmission and reflection spectra (at different temperatures increasing from 5 K to 300 K in the direction to the coordinate origin).
Download figure:
Standard image
Figure 37. Temperature dependence of the integrated exciton absorption in AlxGa1-xAs (x = 0.15) solid solution. The inset shows the theoretical dependence of the integrated absorption on the damping.
Download figure:
Standard image12. Polariton nature of the diamagnetic exciton
At present, it can be regarded as fully established that the properties of the quasi-particle named 'diamagnetic exciton' determine practically any interband optical phenomenon in semiconductors placed in a high magnetic field [9, 11, 36]. The DE concept has passed examinations in more than ten and half as much again of semiconductor crystals. However, detailed analysis of the DE quantitative data shows a more complicated nature of the diamagnetic exciton when one takes into account the results on the EP integrated absorption. It can be precisely described only in a framework of another concept, namely the concept of diamagnetic-exciton polariton (DEP).
The DEP problem was in a shadow since the qualitative analysis of the spectral features was quite sufficient to establish the nature and magnitude of the crystal band parameters in earlier magneto-optical studies. In fact, quantitative measurements could be performed in some rare cases only. Those cases required special actions, for example, simultaneous registration of transmission and reflection spectra. Such spectra have been measured, e.g. in paper [16], where some new facts were found out. Foregoing figure 8 presented a quantitative magneto-absorption spectrum [16]. It reveals rather unexpected behaviour of the spectral peak at least for the most long-wave state characterized by the electron Landau number l = 0. The peak amplitude αmax decreases with increasing magnetic field down to some value αmax* and only then increases (see figure 38). At the same time, in a general consideration, both the transition oscillator strength f and amplitude of the magneto-absorption could only grow with the magnetic field B (in proportion to B2) because of the field compression of the exciton wavefunction in the plane perpendicular to the field. The oscillator strength versus magnetic field dependence is f(B) = f(0)(1 + dn B2), where dn is the dipole moment of the exciton with principal quantum number n, ground state magnetic susceptibility d0 = ε aexc3/µc2.

Figure 38. The amplitude of the 'bottom' (the most short wave) DE state with increasing magnetic field (left to right).
Download figure:
Standard imageSome conclusions can be drawn from available data. At low temperature (T = 1.7 K) and B = 0, the exciton ground state will have the integral equal to 8 eV cm−1 for GaAs and 16 eV cm−1 for AlxGa1-xAs where x = 0.15, saturation level Ksat being 69 and 87 eV cm−1 for GaAs and Al0.15Ga0.85As, respectively. Figure 39 presents the spectrum of the absorption edge of GaAs at two different temperatures, typical for the EP. Having measured line half-width at liquid-helium temperature and provided that the line shape is Lorentzian, one can find that the exciton amplitude appears to be significantly below the level of the states' continuum. The integral absorption changes non-monotonously with magnetic field, namely first decreases and then increases (see figure 40). Thus, the structure of the exciton absorption edge is rather typical for the exciton polariton when the ground state does not reach the level of the continuum. The levels are aligned with increasing temperature, i.e. with a significant increase in the damping factor Γ (see figure 37).

Figure 39. Right: exciton absorption edge of GaAs at T = 5.5 K. Left: same when the temperature is raised to T = 60 K. The dashed line represents the Lorentzian fit, the numbers 1 and 2 corresponding to the exciton states with n0 = 1 and 2.
Download figure:
Standard image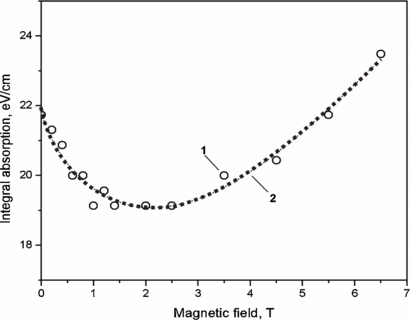
Figure 40. AlGaAs integrated-absorption dependence on the magnetic field.
Download figure:
Standard imageThe initial part of the K(B) dependence is another interesting peculiarity. This dependence turns out to be sinking despite the expected increase in oscillator strength. For both GaAs and AlGaAs, the dependence of K (B) has the shape of the curve with a minimum (see figure 40), which is usably approximated by the expression: K(B) = K(0) (1+dnB2)(1 − pB1/2). When magnetic field increases up to the values of an order of Bmin = 2–2.5 T only, the increase of oscillator strength in the magnetic field begins to dominate, and there is overall growth of the integral absorption. The decrease can only be explained using the EP concept. On the basis of the dependence shown in the inset to figure 37, this decrease corresponds to reduction of the damping with increasing magnetic field.
To explain the decreasing part of the dependence, one can involve the magnetic 'freezing out' of the impurity, which has been studied in papers [49–50]. Magnetic-field increase results in an increase in the binding energy of a donor ED. The latter affects the concentration of charged donors, i.e. leads to its reduction. ND+ = ND [1 + 2exp{(EF + ED − ℏħωc/2)/k0T}]−1, where EF is the Fermi level energy, ħωcc is the electron cyclotron energy. Variational calculation of ED has been made in paper [51, 52] making use of the test Pokatilov–Rusanov functions [53]. It has given the theoretical dependence ED(B), which agrees with the results of Hall measurements at the low field (high-field Hall-effect measurements are distorted by the field 'freezing out' of electrons due to the growth of ED(B)). Considering the change in the exciton damping to be Γ(B) = σ ND+ where σ is the cross section of the exciton scattering on a charged impurity centre, using the data of the experimental dependence K(B), and taking into account both the impurity compensation rate and the formation of near-surface volume charge, one can obtain satisfactory agreement for GaAs.
The behaviour of the integrated absorption in a magnetic field is a bit more complicated in solid solutions as well as in heavily doped semiconductors [54, 55]. Taking into consideration the potential fluctuations, the calculated magnetic-field variation of the concentration of charged donors ND+ turns out to be much more efficient. This explains the fact that the fall of integrated absorption K with the magnetic-field increase is deeper in AlGaAs than in GaAs.
So, the analysis of integrated absorption K as a function of the magnetic field for two kinds of semiconductor crystals (compound GaAs and quasi-binary solid solution Al0,15Ga0,85As) clearly shows (by an example of the lowest state related to the zero Landau level) that magneto-excitons (excitons modified by the magnetic field) are indeed not just DE but a quasi-particle of more complicated nature, namely diamagnetic-exciton polariton (DEP).
A question arises: can one extend these conclusions to the other DE states, e.g. ones with the Landau number l > 0? It is worth noting that, to observe polariton effects, the 'subcritical' damping γ < γc is necessary. Besides, one can ascertain that switching on magnetic-field keeps polariton properties of the first DE series at least. So, looking at the behaviour of half-widths of lines related to higher states with greater Landau numbers lc > 1, we can suppose that the γ < γc rate is observed up to energies exceeding Eg significantly (see, for example paper [16]). Furthermore, the oscillator-strength increase together with a possibility of simultaneous decrease of damping lead to moving up (towards higher damping) the border line of the observation of the EP effects.
There is no doubt that the DEP will become a basis of interband magneto-optical phenomena in other crystals studied usually using the most perfect samples which show the 'exciton' behaviour without a magnetic field already.
13. Modelling the low-dimensional state of matter in the experiments with excitons in high and ultra-high magnetic fields
Due to specific properties of low-dimensional systems, the latter will be the main 'constructional base' for micro- and opto-electronics of this century. However, the practical materialization of these properties straightforwardly depends on both the technological progress and improvement in the synthesis of appropriate nanostructures. In the case of 'quantum-well'-like structures (quasi-two-dimensional systems), the modern growth techniques, such as molecular-beam epitaxy (MBE), allow one to control the layer-by-layer growth and to ensure nearly ideal structure quality. Still, such a success has not been achieved in the cases of either 'quantum-wire'-like structures (one-dimensional) or 'quantum-dot'-like ones (zero-dimensional). Such structures require the quantum confinement in more than one direction, and they cannot thus be grown in a wholly controllable process without the use of the nanolithograph technique. Besides, the processes related to the self-organization of nanostructures are the only solution in the latter case. Indeed, these processes turn out to be very effectual for the 'quantum-dot' synthesis, although not ensuring either ideally identical sizes or a perfect order arrangement of the 'dots'. For 'quantum wires', there is not even a possibility of such a kind. Consequently, the case of creation of a 1D structure through applying either magnetic or electric restraining fields is especially important. In this case, the cyclotron orbits guarantee the confinement within the plane perpendicular to the applied magnetic field, free movement along the field axis determining the 1D state. This offers a chance to study processes that are inaccessible in practice when dealing with real technological structures. Using an MBE-grown quantum well as an initial object, one can produce an artificial zero-dimensional structure of a controllable size by means of the application of a magnetic field (see figure 41).

Figure 41. Simulation of zero-dimensional state of an exciton in a high magnetic field by using the 'technological' quantum well.
Download figure:
Standard imageThus, the simulation of low-dimensional processes with the ultrahigh magnetic field allows one to investigate the prospective quantum-dimensional phenomena under conditions equal to the ideal quality of a real structure.
In quasi-1D systems, an increase in the oscillator strength is governed by the system proximity to the ideal one-dimensional case. Since the application of ultrahigh magnetic fields simulates an ideal 1D situation (see figure 42), such magnetic-field experiments become very attractive and promising. It is all the more so since, here, the influence of geometrical and other structural imperfections is excluded.

Figure 42. Simulation of one-dimensional state of an exciton in a high magnetic field by using the 'technological' quantum well.
Download figure:
Standard image14. Magneto-quantum exciton polymer
Another unique aspect of the DE studies is associated with the simulation of behaviour of the matter in ultrahigh magnetic fields of the order of 105–107 T, which presumably exist in the vicinity of neutron stars 56, 57, 58. In such intense fields, the interaction of the electron shells with the external magnetic field becomes stronger than the Coulomb interaction between the electrons and nucleus. In other words, the Larmour radius becomes less than the Bohr radius for the hydrogen atom. Under these circumstances, the behaviour of the atom is quite analogous to that of the DE. There is the only difference. Because of lesser exciton mass (µ ≪ m0, where m0 is the free electron mass) in the substance with the permittivity ε0 ≫ 1, the effective magnitude of the magnetic field turns out to be ε02/µ times larger than that for the atom. Thereby, the effective magnetic field affecting an exciton is 104–107 times higher than 'the same' external field affecting an atom. In PbTe taken as an example, where the significant role of excitons in the magnet-optical absorption was disclosed in paper [32], the magnitude of the laboratory 10 T magnetic field corresponds to the 108 T field applied to a hydrogen atom.
The ultrahigh magnetic fields cause remarkable modification of electronic states in an atom. Precessing around the nucleus, all the electrons begin to move in comparatively thin cylindrical regions with the cylinder axis directed along the field. The spectrum of the atomic excited states is also modified by the high magnetic field, so that it consists of the equidistant Landau levels and spin-rotation levels. Besides, there is a broad band due to longitudinal movement near each level. Furthermore, the atom binding energy increases with the field. In fields of an order of 108 T, this energy for the hydrogen atom reaches several hundreds eV (see figure 43).

Figure 43. The binding energy of the 'one-dimensional' hydrogen atom (exciton) depending on the magnetic field.
Download figure:
Standard imageSuch atoms have got large electric quadruple momentum and have to form stable molecules. Thus, the formation of unusual molecules becomes possible, when collectivization of the electronic cloud takes place and the electrons constitute a negatively charged needle, the atoms locating along its direction. Remarkably, the binding energy for the diatomic molecule of this substance is much higher than the energy of an isolated atom. As a result, the atoms inevitably form diatomic molecules.
The energy of inter-atomic interaction in ultrahigh magnetic fields may be so high that the substance in the vicinity of a neutron star can solidify in condensed matter even at temperatures 106 °C [56, 57]. In this case, the solid phase will have rather the structure of a polymeric wire than the crystal structure (see figure 44). Magnetic fields of the order of 103 T can now be created under laboratory conditions, namely in 'explosion-generators' [59]. Thus, there is a unique opportunity to observe the behaviour of such a DE substance under terrestrial conditions making use of extremely high laboratory magnetic fields as well as of semiconductor crystals with narrow forbidden gaps.

Figure 44. Exciton 'polymer' in the ultrahigh magnetic field (a model).
Download figure:
Standard image15. Conclusion
I have attempted to force into a short paper all the interband magneto-optics of semiconductors after 65 years of its progress, beginning with a brief chronicle of the discovery of a key interband magneto-optical phenomenon, that is diamagnetic exciton (DE), and finishing with relatively new ideas that emerged in recent years.
Upon a short discussion of the DE concept as the very core of any interband optical phenomenon in semiconductor crystals in a high magnetic field, I have reviewed special features of the DE effect in the majority of research objects of the practical interest as well as methods of the extraction of exact parameters of crystal band structures from the magneto-optical spectra. Among the materials, wide- and narrow-gap semiconductor crystals, their solid solutions, diamond-like semiconductors, and hexagonal crystals have been considered. There is an example of special interest, PbTe, where, due to possibly negligible binding energy, the idea itself of the exciton origin of spectra might seem dubious. The Rydberg exciton states and their magneto-optics is another important topic. It covers a wide range of crystals with relatively wide forbidden gaps. The calculation methods developed for them are however quite effective and even preferable in cases of relatively narrow-gap crystals. The DE-science application to low-dimensional semiconductor systems such as multiple quantum wells (MQW) and superlattices (SL) is also very efficient. The correct determination of the DE binding energies is the key to analysing magneto-optics here too. These energies depend on any quantum number of the state as well as on the magnetic field strength and help to 'restore' the virtual spectrum of transitions between the Landau subbands. The magneto-optical analysis of more complex low-dimensional systems is an interesting elaboration of the subject. Among them, I would mention MQW with the mixed-type heterojunctions ('type I–type II'), where the 'Coulomb wells' are formed, or the 'MQW–SL' systems with Bragg mirrors for the electrons that form the 'above-barrier' exciton. I deliberately discuss only the main phenomenon of the absorption oscillations, not mentioning its many derivatives such as the interband Faraday and Voigt effects, or a lot of modulation effects, etc. since they are limited and controlled by the same physical principles. In all these cases, DE appears to be both a physical phenomenon the same by nature and a source of valuable information on the energy spectrum of states.
The question arises whether the interband magneto-spectroscopy (DE spectroscopy) is exhausted or some new discoveries are possible. At last, do we need new research? Zakharchenya, one of the discoverers of the DE effect, once answered in the following way (see the Preface to [9]): '... it is clear that such an effective method as the magnetooptics of semiconductors will be never deposited in the depot of former methods of studying the electronic processes in crystals. It is safe to say that this method will many times manifest itself in all its glory in fundamental and applied physics of semiconductors, just as seemingly archaic Hall effect revived and shone with new facets in recent years after the discovery of quantum oscillations in this effect ... '. It is worth recalling that the boom in research of magneto-optics of semiconductors soon after the discovery of the effect in 1957 was replaced by a noticeable decline after a while. There had been at least three reasons for that. First, the DE spectra could be easily observed in crystals of high perfection level only, whereas the crystal-growth technologies did not provide a sufficient amount of new such crystals. Second, to observe the most informative transmission spectra, ultrathin samples are necessary, and this is not easy. Third, to obtain the necessary information about the energy spectrum of a crystal, one must be able to calculate the DE binding energies correctly. Only the use of accurate DE energies to adjust positions of the experimental extrema of obtained spectra allows one to restore the positions of relevant transitions between the Landau subbands. Thus, only in this way can an accurate and self-consistent computation be assured for all parameters of the crystal energy spectrum by one of the methods mentioned above. The accurate information on the band parameters is needed to develop new semiconductor devices that make use of a variety of semiconductors: monocrystalline diamond; silicon carbide; aluminium, gallium, and indium nitrides; zinc sulphide and oxides. This is anything but a complete list of crystals in the 'queue' for studying DE. For example, the DE spectra of GaN crystals have been obtained in magneto-reflection experiments only. They remain untreated because the well-known computational methods do not work in this case, either those for the binding energies or ones for the band parameters, which use, e.g., quasi-cubic approximation as in the case of hexagonal CdSe. The spectra of InCuSe2, which is crystallizing in the chalcopyrite lattice, will be possibly soon treated in this approximation. Simulation of low-dimensional state is another direction of the DE spectroscopy development. Here, the narrow gap crystals can play a key role, opening even the possibility of penetration into the physics of neutron stars.