
Abstract
The high harmonic generation (HHG) from the CS2 molecule in intense laser fields is investigated using the extended Lewenstein method. The initial state is the highest-occupied molecular orbital of the CS2 molecule, which can be well described by Gaussian wave packet using GAMESS-UK package. Compared with the case of the elliptical laser, the HHG can be extended in two-color circularly polarized laser field. The time-frequency analysis and classical electron trajectory as well as the ionization yield curve are also presented to further explain the underlying mechanism. After adding a static electric field on the z-direction, the single quantum path control is realized and the supercontinuum spectra are obtained. Moreover, an isolated 110 as pulse can be obtained by superposing the harmonics from 130th to 180th order.
Export citation and abstract BibTeX RIS
In strong-field physics, high harmonic generation (HHG) from molecules such as N2, O2 and CO2 has attracted much attention in recent years.[1–3] It can be used as tools for measuring and controlling the dynamic process of electrons in molecules, especially in ultrafast electron dynamics. Explicitly, such a phenomenon can be described as follows:[4] a molecule emits its electron to the continuous state through tunneling or multi-photon ionization, then the electron is propagated in the continuum and accelerated in the laser field; finally, it comes back to the core and recombines with the parent ion. Recently, the HHG of atoms has been almost well understood theoretically and experimentally by scientists. The interaction between laser and molecules shows more extensive phenomena, such as the multicenter structure,[5–7] molecular orbital tomographic imaging,[8] and the quantum interference between high-order harmonics originated from different cores. Furthermore, much effort has been given to broadening the bandwidth of the supercontinuum of HHG and shortening the pulse duration for the potential applications with much higher time resolutions.[9–11] It has been shown that HHG depends on the ellipticity of the pulse sensitively, thus the recombination electrons can be gated into one half cycle by using the few-cycle polarization gating (PG) technique, and then a broadband supercontinuum in the plateau region can be produced.[11–14] With the development of the laser technology, the mid-infrared wavelength laser can be generated.[13–15] Under this condition, the tunneling process is predominant, thus the dynamics of molecules and atoms shows some new phenomena, which attract a great deal of interest and have been widely investigated recently.[16–18] In 2005, Itatani et al.[8] realized control of the high-order harmonic generation process by changing the alignment of molecules. Recently, the influence of nuclear motion in a molecule has been widely studied.[19–23] In 2014, Guo et al.[24] investigated the influence of different vibrational states on HHG and isolated attosecond pulse from a molecule. Recently, the CS2 molecule has attracted some attention in theory and experiment.[25, 26]
The strong-field Lewenstein model for molecules has been widely used.[28–31] In this work, we choose the system of the CS2 molecule and consider its highest occupied molecular orbital (HOMO) as the initial state, which is constructed by the GAMESS-UK package. The transition amplitude is
where ![${d}_{\mathrm{ion}}[{p}_{\mathrm{st}}(t,\tau )-{\boldsymbol{A}}(t-\tau )]$](https://content.cld.iop.org/journals/0256-307X/34/1/014206/revision1/cpl_34_1_014206ieqn1.gif) is the transition amplitude of ionization,
is the transition amplitude of ionization, ![${d}_{\mathrm{rec}}^{* }[{{\boldsymbol{p}}}_{\mathrm{st}}(t,\tau )-{\boldsymbol{A}}(t)]$](https://content.cld.iop.org/journals/0256-307X/34/1/014206/revision1/cpl_34_1_014206ieqn2.gif) is the transition amplitude of recombination, ε, τ,
is the transition amplitude of recombination, ε, τ,  and
and  give the positive regularization constant, the traveling time of free electron in the laser, the electric field and the vector potential of the electric field, respectively,
  is the stationary momentum, and
  is the quasiclassical action of the electron, which can be calculated as follows:
where  is the ionization potential of the CS2 molecule,
  ,
,  and
and  ,
,  are the stationary momentum and vector potential in the y and z directions, respectively.
In our calculation, the lasers are set on the y and z directions. Thus the transition amplitude would be written as
The corresponding HHG power spectrum is proportional to the time-dependent dipole moment (in acceleration form)
The attosecond pulse can be calculated by superposing several harmonics as follows:
where  .
.
We first present the initial density function of the CS2 molecule with symmetric stretch mode, which is calculated by GAMESS-UK in Fig. 1. As can be seen, there are four parts distributed like a butterfly, and the initial density function is symmetric with respect to the axes y and z. In our simulation the expression of the elliptical field is

and the two-color circularly polarized field can be represented as

where ![$f{(t)=\exp [-2\mathrm{ln}2(t-T/2)}^{2}/{\tau }^{2}]$](https://content.cld.iop.org/journals/0256-307X/34/1/014206/revision1/cpl_34_1_014206ieqn13.gif) is the pulse envelope,
is the pulse envelope,  W/cm2 is the amplitude of laser field,
  a.u. and
  a.u. are the frequencies corresponding to the laser field of 1200 nm and 600 nm, respectively, and
  is the ellipticity of the elliptical field. The durations of t for the time evolution are
  and
and  fs, where T0 is the optical cycle (o.c.) of a 1200-nm pulse. Figure 2(a) is the electric field of elliptical laser field (red solid line) which shows the clockwise spiral along the axis of time, and the black dashed line is the projection to the y–z plane. Figure 2(b) shows the two-color circularly polarized laser field (red solid line). The projection to the y–z plane represents a three-fold spatiotemporal symmetry like a clover leaf. The laser has three peaks per cycle, which means that the electron can recombine three times per laser cycle. Figure 3 shows the HHG spectra from the CS2 molecule driven by the elliptical laser and counter-rotating laser as well as the H atom driven by the counter-rotating laser, respectively. The black solid line is the spectra driven by the elliptical laser with the cutoff of about 50th order. The red dotted line is the one driven by a two-color circularly polarized laser with extended cutoff of about 80th order. Moreover, the intensity has been increased by three orders of magnitude. The blue dashed line is the spectra driven by the two-color laser of the H atom, which shows the similar cutoff order with the decreasing emission efficiency of HHG above the 40th order.
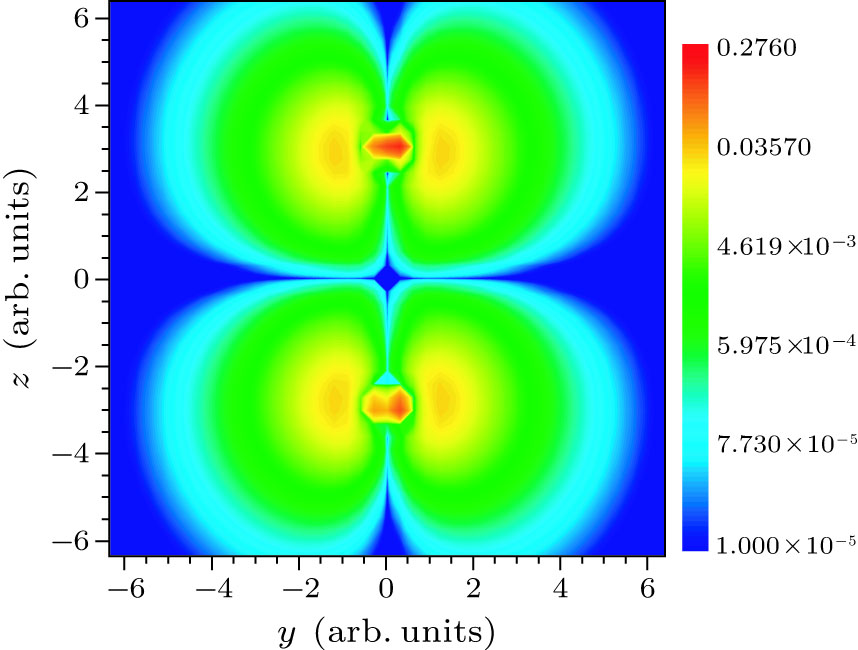
Fig. 1 The initial density function of the HOMO orbital of CS2 with symmetric stretch mode calculated by GAMESS-UK.
Download figure:
Standard image
Fig. 2 The electric field of elliptical laser (red solid line) (a) and two-color circularly polarized laser (red solid line) (b). The black dashed lines in (a) and (b) are the projections to the y–z plane of these two fields.
Download figure:
Standard image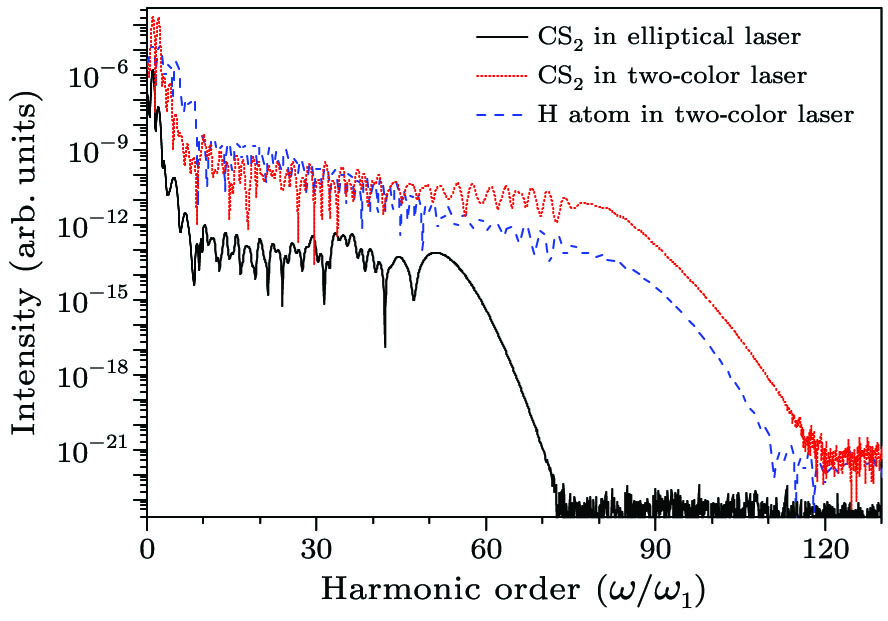
Fig. 3 Harmonic spectra of the CS2 molecule induced by elliptical laser (black solid line) and two-color circularly polarized laser (red dotted line), and the harmonic spectra of the H atom induced by two-color circularly polarized laser (blue dashed line).
Download figure:
Standard imageTo interpret the mechanism of the extension in the HHG plateau, we present the time-frequency analysis along the y and z directions for both the lasers (see Figs. 4(a)–4(d)). Figures 4(a) and 4(b) show the distribution in the y and z directions of the elliptical laser, respectively. As can be seen in Fig. 4(a), there are three peaks in the y-direction with a relatively weak peak at about −0.5 o.c. Thus the dominant contribution to the emission of HHG on the y-direction comes from the other two peaks. However in Fig. 4(b), there are two peaks contributed to HHG, which shows the same tendency as that in Fig. 4(a). Moreover, the intensity of HHG in the y-direction is higher than that in the z-direction. In Figs. 4(c) and 4(d), there are five similar peaks and the intensity in the y-direction is higher than that in the z-direction. Since the molecular axis is along the z-direction, we will take the results on the z-direction as an example. As shown in Fig. 4(b), there are two peaks contributed to the emission of HHG, and the maximum order of emitted HHG located at about the 55th order, which is consistent with that in Fig. 3. However in Fig. 4(d), there are about five peaks, and the peak intensity about −0.5 o.c. is relatively weak, which can be ignored. Thus there are four peaks with comparable intensity contributed to the photon emission. That is the reason why the HHG has so many modulations. Furthermore, the maximum order of HHG has been extended to about the 80th order, which is in accordance with that in Fig. 3.

Fig. 4 The time-frequency analysis of the harmonic spectrum along (a) the y-direction and (b) the z-direction in the elliptical laser field. The time-frequency analysis of harmonic spectrum along (c) the y-direction and (d) the z-direction in the two-color circularly polarized laser field.
Download figure:
Standard imageTo further understand this phenomenon, we draw the trajectory of the electron moving in the laser fields. The trajectories in Figs. 5(a) and 5(b) are under the elliptical laser and the two-color circularly polarized laser and the combined field with static electric field, respectively. Figure 5(a) shows the paths with different initial transverse velocities v0 and emission times  , and they appear to be the elliptical shape. The trajectory with emission time
  o.c. moves further than the trajectory with emission time
  o.c., which is in accordance with the fact that the harmonic order located at time
  o.c. is higher than that located at time
  o.c. in Fig. 4(b). However in Fig. 5(b), the trajectories are also with different proper initial transverse velocities and emission times, which appear to be the triangular way. It can be visibly seen that electrons move further in the latter case, which can well explain the extension of the plateau of harmonic spectra.

Fig. 5 The classical electron trajectories in (a) the elliptical laser and (b) the two-color circularly polarized laser and the two-color circularly polarized laser combined with static electric field, respectively.
Download figure:
Standard imageFigure 6 shows the ionization yield of the CS2 molecule under these two lasers. The ionization yield of the CS2 molecule in the case of the two-color circularly polarized field (blue dotted line) is higher than that of the elliptical laser (black solid line), which is consistently with the higher intensity of HHG of the two-color circularly polarized laser case (red dotted line) in Fig. 3.
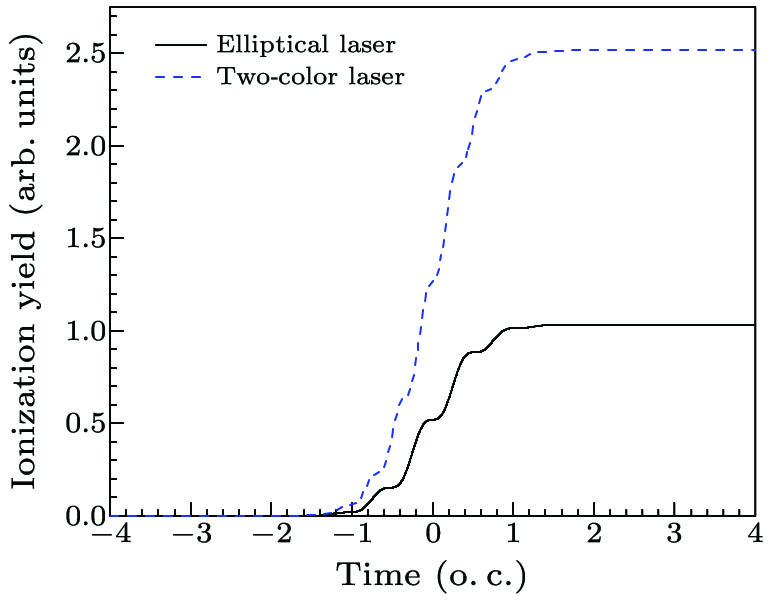
Fig. 6 Ionization yield of the CS2 molecule in the elliptical laser (black solid line) and the two-color circularly polarized laser (blue dotted line).
Download figure:
Standard imageTo optimize the harmonic spectra and to extend the plateau of HHG, we add the static electric field to the z-direction with the form  , where α is the static parameter. In our calculation, we choose
  ,
,  and
and  , respectively. Figure 7 shows the harmonic spectra of these three cases. As can be seen, the plateau of HHG can be extended with the increasing parameter α. When
  , the harmonic spectra becomes supercontinuum with a bandwidth from 120th to 180th order. We represent the time-frequency analysis of the
  case in Fig. 8. There are five peaks contributing to the emission of HHG under the 80th order. That is the reason why the harmonic spectra less than the 80th order has so many modulations. However, there is only one peak contributing to the emission of harmonic spectra above the 80th order. It can be clearly seen that the long trajectory is suppressed, which realizes the single quantum path control. After adding the static electric field, the electron will have a transverse velocity (along the z-direction) and will obtain energy from the static electric field, which leads to the enhancement of the short trajectory and the suppression of the long trajectory. The red dashed-dotted line in Fig. 5(b) shows the trajectory of an electron with emission time
  o.c. within the long path domain. The trajectory can be nearly ignored relative to others which is in accordance with the above long path suppression statement. Figure 9 shows the attosecond pulse generated from the two-color circularly polarized laser and the two-color circularly polarized laser with static electric field of
  , respectively. By superposing some harmonic spectra from the 50th to the 70th order, we gain the attosecond pulse with duration of 190 as, as shown in Fig. 9. However, with the existence of static electric field, the isolated attosecond pulse is realized and the duration has reduced to 110 as by superposing the orders from 130th to 150th.

Fig. 7 Harmonic spectra generated by the two-color circularly polarized laser combined with the static electric field of  ,
,  and
and  , respectively.
Download figure:
Standard image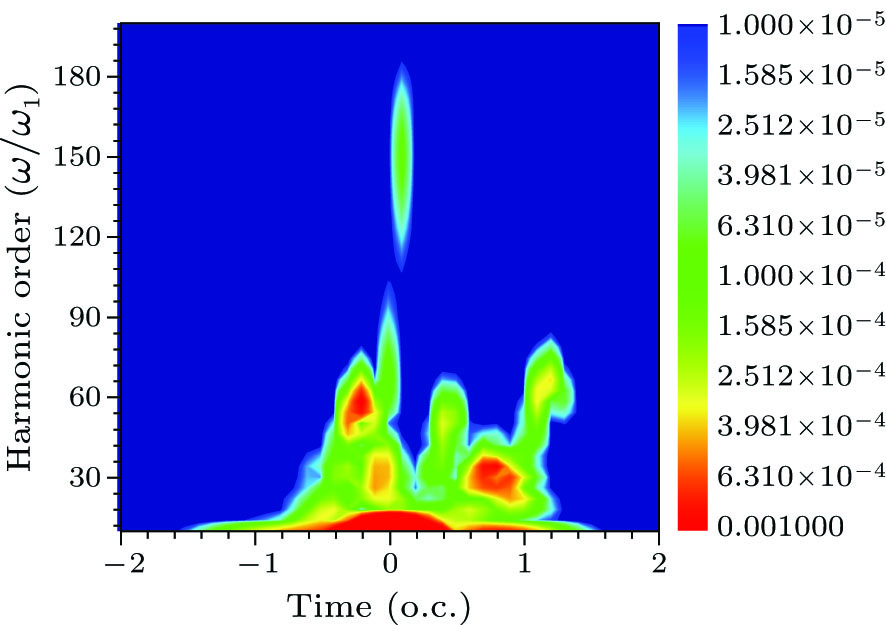
Fig. 8 The time-frequency analysis of harmonic spectra generated by the two-color circularly polarized laser combined with the static electric field of  .
.
Download figure:
Standard image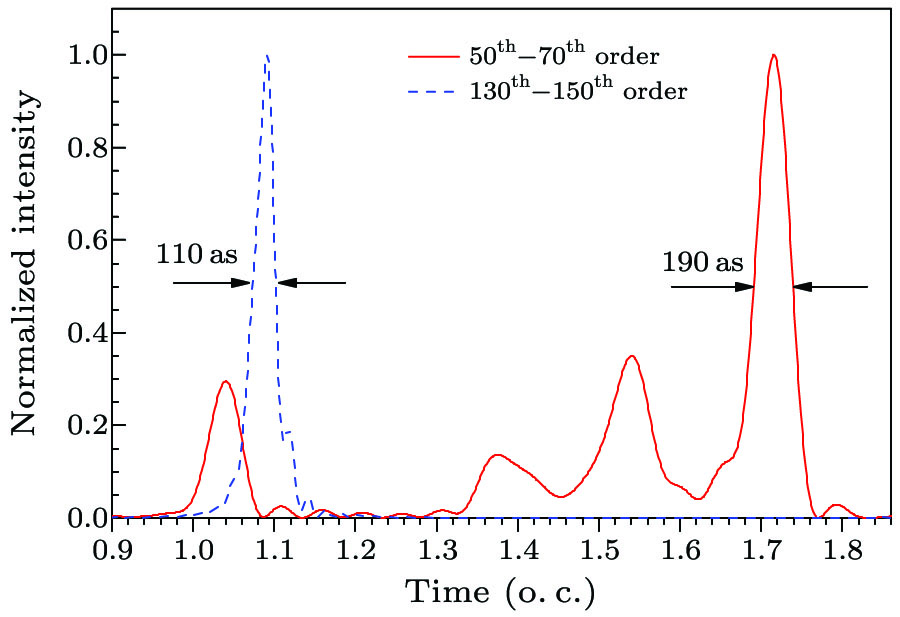
Fig. 9 The temporal profiles of the attosecond pulses generated by superposing some orders of harmonic spectra in the two-color circularly polarized laser (red solid line) and the combined laser with  (blue dashed line).
Download figure:
Standard imageIn summary, we have investigated the HHG and attosecond pulse from the CS2 molecule with the elliptical laser and the two-color circularly polarized laser by the Lewenstein model. The results show that the plateau of HHG generated by the two-color polarized laser is extended and the intensity is about three orders higher than that of the elliptical laser. Both the time-frequency analysis and the classical trajectory as well as the ionization yield can explain the underlying mechanism well. By adding the static electric field of  to the z direction, a supercontinuum spectra can be gained and the single quantum path control is realized. Finally, by superposing proper orders of harmonic spectra from the CS2 molecule with the combined laser, an isolated attosecond pulse with duration of 110 as can be obtained.
Footnotes
- *
Supported by the National Natural Science Foundation of China under Grant Nos 11574117, 11271158, 61575077 and 11575071.