


ABSTRACT
Neutron detectors on spacecraft in the inner heliosphere can observe the low-energy (<30 MeV) solar-flare neutrons that are not easily observable at Earth because they are lost to decay during transit. We present calculations of low-energy neutron production using a computer code incorporating updated neutron-production cross sections for the proton and α-particle reactions with heavier elements at all ion energies, especially at low energies (Eion < 10 MeV nucleon−1) most important for producing low-energy neutrons from these reactions. We calculate escaping-neutron spectra and neutron-capture line yields from ions propagating in a magnetic loop with various kinetic-energy spectra. This study provides the basis for planning inner-heliospheric missions having a low-energy neutron detector. The MESSENGER spacecraft orbiting Mercury has such a detector. We conclude that a full understanding of ion acceleration, transport, and interaction at the Sun requires observation of both neutrons and gamma rays with detectors of comparable sensitivity. We find that the neutron-capture line fluence at 1 AU is comparable to the 1–10 MeV neutron fluence at 0.5 AU, and therefore as effective for revealing low-energy ion acceleration. However, as the distance from the Sun to the neutron detector decreases, the tremendous increase of the low-energy neutron flux allows exploration of ion acceleration in weak flares not previously observable and may reveal acceleration at other sites not previously detected where low-energy neutrons could be the only high-energy signature of ion acceleration. Also, a measurement of the low-energy neutron spectrum will provide important information about the accelerated-ion spectrum that is not available from the capture line fluence measurement alone.
Export citation and abstract BibTeX RIS
1. INTRODUCTION
Neutron detectors on spacecraft in the inner heliosphere provide a new window for exploring the processes occurring in solar flares: low-energy (<30 MeV) neutrons. And, as always with new sources of information, they also offer the possibility of discovering unexpected sources of ion acceleration associated with energetic phenomena in the solar atmosphere where low-energy neutron production may even be the main signature. Neutrons are one of the major products of nuclear reactions occurring when ions accelerated in solar flares impact ambient solar material. But low-energy neutrons cannot be observed at Earth because free neutrons have a finite lifetime (mean of ∼880 s), and, as the distance between the flare site and the detector increases, more low-energy neutrons are lost to decay due to their longer transit times. Detectors in the inner heliosphere are the only way to directly observe such neutrons.
To justify the additional expense, weight, and resource demands that a neutron detector would impose on an inner-heliosphere mission, several questions should be asked. Which nuclear interactions produce low-energy neutrons, and what is the relevant ion kinetic-energy range? How do they differ from those producing the higher-energy neutrons observable at Earth and from those producing the neutron-capture line? What are the expected neutron and neutron-capture line fluences? Is such a necessarily small neutron detector more or less effective in providing information about ion acceleration at the Sun than a modest gamma-ray detector in Earth's orbit? What new information would be gained by such neutron observations? Our main purpose in this paper is to answer these questions.
Low-energy neutrons have not yet been directly observed. Although Feldman et al. (2010) reported detection of <10 MeV neutrons from a weak GOES X-ray flare with MESSENGER when it was located at 0.48 AU, Share et al. (2011) subsequently showed that the detection was more likely the result of neutrons produced locally by interactions of solar energetic particles (SEPs) arriving at the spacecraft rather than solar neutrons. However, as the new activity cycle develops, the rate of solar flares will increase, and neutrons may yet be observed by MESSENGER, currently in orbit around Mercury (0.3–0.5 AU).
Solar neutron measurements, together with measurements of other high-energy emissions from flares (such as the neutron-capture line, nuclear de-excitation lines, the positron annihilation line, and pion-decay emission), have proven to be powerful diagnostic tools for exploring the flare process in general and ion acceleration in particular (e.g., Murphy et al. 1987). Upward-moving neutrons can escape from the Sun and be directly detected in space and, for intense flares, by neutron monitors on Earth. Because of the free-neutron finite lifetime, the kinetic-energy spectrum of the escaping neutrons is modified as the neutrons travel away from the Sun, losing more lower-energy neutrons to decay. Because of neutron decay, escaping neutrons may also be indirectly detected in space via the decay protons and electrons that result (Evenson et al. 1983). Neutrons may also be indirectly detected via the 2.223 MeV gamma-ray line produced by the capture of downward-moving neutrons on ambient hydrogen in the photosphere. This neutron-capture line is intrinsically the strongest gamma-ray line produced in solar flares, and, although it can be significantly attenuated by Compton scattering for limb flares, is the most sensitive gamma-ray line indicator of ion acceleration in flares because of its strength and its relatively narrow width.
For typical solar-flare accelerated-ion kinetic-energy spectra, the loss of low-energy neutrons as they propagate through interplanetary space means that, in practice, only neutrons with energies greater than about 30 MeV are observable with spacecraft detectors at Earth (1 AU). (Although flares with very steep accelerated-ion spectra can produce a fluence of 1–10 MeV neutrons at Earth comparable to the >30 MeV neutron fluence, these lower-energy neutrons are delayed and extended in time so that their instantaneous flux is weak and difficult to measure.) For typical solar-flare ambient and accelerated-ion compositions, the >30 MeV neutrons observed at 1 AU are predominately produced by α-particle interactions with ambient H and 4He, proton interactions with ambient 4He, and, at the highest neutron energies (greater than several hundred MeV), by proton interactions with ambient H (Hua et al. 2002). Neutrons with energies >30 MeV have been observed at 1 AU from several large flares (Chupp et al. 1982; Murphy et al. 1999; Watanabe et al. 2008a, 2008b, 2008c, 2009; Chupp & Ryan 2009).
Although the neutron-production cross sections for proton and α-particle interactions with heavier ambient elements can be quite significant, the contribution of these reactions to neutron production in typical solar flares is usually small due to the low abundances of the heavier elements. But, even at high ion energies, these reactions tend to produce lower-energy neutrons due to the low-energy peak of the neutron-production spectrum associated with the evaporation component of these heavy-element reactions (see Section 2). While less relevant for measurements at 1 AU, these reactions can be important for low-energy neutron detection in the inner heliosphere. In addition, the cross sections for these heavy-element reactions have relatively low threshold energies, particularly for α-particle reactions and reactions involving some rare isotopes (some even exothermic). Such reactions could therefore contribute significantly if the accelerated-ion spectrum were much steeper or the accelerated heavy-element abundances were much larger than typically observed in solar flares. Moreover, these heavy-element reactions may be the sole source of neutrons if the projectile energies are less than ∼10 MeV nucleon−1; for example, there may exist micro-flares in which only low-energy ions are accelerated. These reactions are also important in other situations where the composition is dominated by heavy elements, such as in Earth's atmosphere, planetary surfaces, or spacecraft material.
Reliable interpretation of low-energy neutron measurements places new requirements on our understanding of neutron production in solar flares. Our previous analyses of solar-flare neutron observations (e.g., Murphy et al. 1999, 2007; Watanabe et al. 2008a, 2008b, 2008c, 2009) used a Monte-Carlo-based computer code (Hua et al. 2002) incorporating relevant nuclear interaction cross sections and neutron-production kinematics. The code considers accelerated proton and α-particle interactions with ambient H; 4He; and various isotopes of C, N, O, Ne, Mg, Si, and Fe (and their "inverse" reactions: accelerated heavy isotopes with ambient H and 4He) and also accelerated 3He interactions with ambient H and 4He. (The code currently does not consider accelerated 3He reactions with heavier elements.) It calculates both angle- and time-dependent escaping-neutron spectra and neutron-capture gamma-ray line yields within the context of a realistic flare magnetic loop.
The flare-loop code accounts for ion energy losses due to Coulomb collisions, ion removal by nuclear reactions, magnetic mirroring of the ions in the converging flux tube, and pitch-angle scattering (PAS) of the ions due to MHD turbulence in the corona (Hua et al. 1989). The magnetic loop is generally accepted as a reasonable model that can account for most of the observable emissions from large flares. Observation of hard X-ray and gamma-ray line emission from loop footpoints (e.g., Duijveman et al. 1982; Masuda et al. 1995; Hurford et al. 2006) is consistent with this model.
The flare-loop neutron-production code was originally optimized for near-Earth observations of neutrons from typical solar flares; i.e., >30 MeV. As stated above, the relevant reactions are p + 4He, α + 4He, and p + H. Hua et al. (2002) compared the neutron energy- and angle-differential cross sections and kinematics they developed for the p + 4He and α + 4He reactions with experimental measurements and found that they were in excellent agreement. For the p + H reactions, they used the detailed treatment by Murphy et al. (1987).
For the heavy-element reactions in the code, Hua et al. (2002) used an empirical procedure for calculating the energy- and angle-dependent neutron-production cross sections, applying it to the wide ranges of particle masses (from C to Fe) and projectile energies (from <1 MeV to >1 GeV nucleon−1) relevant for solar flares. That a single procedure could be applicable at both low and high energies and for all of the various nuclear masses would be remarkable. In this paper, we examine the Hua et al. (2002) procedure for neutron production from proton and α-particle reactions with heavy elements and improve them, especially at low interaction energies. (Preliminary results from these improvements were presented in Share et al. 2011.)
Our main tool for this effort will be the theoretical nuclear-reaction code TALYS (Koning et al. 2005; Koning & Duijvestijn 2006). TALYS (http://www.talys.eu/) is a user-friendly, efficient computer code simulating nuclear reactions of 1 keV to 250 MeV projectiles using state-of-the-art nuclear models (such as optical, direct, pre-equilibrium, compound, and fission) and comprehensive libraries of nuclear data covering all main reaction mechanisms encountered in particle-induced nuclear reactions. Using TALYS is straightforward in that a complete and accurate set of cross sections can be obtained with only a four-line input file providing the projectile type, the target atomic number, its mass, and the projectile energy. TALYS then automatically accesses the appropriate nuclear-reaction models and parameters. The TALYS authors and others have verified its accuracy by comparing calculated results with experimental data for a variety of nuclear reactions (e.g., Koning et al. 2005; Koning & Duijvestijn 2006; Broeders & Konobeyev 2006). The demonstrated success of TALYS is remarkable, particularly for the types of reactions we are considering here: particle-emitting reactions involving heavy targets.
In Section 2 we discuss neutron production and compare angle- and energy-dependent neutron-production cross sections from heavy-element reactions calculated using TALYS with those calculated using the original procedure developed by Hua et al. (2002). We show where the procedure needed to be improved and present both revised and new procedures that are now incorporated into the neutron-production code. Section 2, along with the original paper describing the code (Hua et al. 2002), provides the necessary nuclear information for understanding neutron production in the flare-loop model. They also provide the information that a user of the code must have to insure its appropriate application when used to interpret solar-flare neutron data.
In Section 3 we discuss neutron and neutron-capture line production in the flare-loop model. We then calculate observable neutron spectra and yields and neutron-capture line yields using the modified flare-loop code for various accelerated-ion spectra and compare them with results calculated using the original code (Hua et al. 2002). Many of the calculated results are presented so as to be useful for detector design and for other researchers analyzing low-energy solar-flare neutron data. This section should be considered an extension of the discussion of loop-parameter dependences of flare observables given by Murphy et al. (2007).
However, the results depend on several loop parameters (e.g., loop magnetic convergence, the level of PAS, the heliocentric observation angle of the flare on the solar disk, the abundances of the accelerated ions and the ambient medium, and the ion kinetic-energy spectrum). Presenting calculations for all combinations of the various parameter values would be impossible. Instead we present calculations for some typical values and then discuss qualitatively the effect of assuming different values. While this can be useful for developing a general understanding of the parameter dependences, the complex interactions of the various parameters make reliable prediction of the neutron response to a parameter change difficult. The code must be run for any specific parameter combination of interest and we have made it available in the online version of the journal.
In the discussion of Section 4, we address the questions relating to inner-heliosphere neutron detectors listed above. Because both Sections 3 and 4 contain considerable content, we summarize the results in Section 5 and also discuss the usefulness of low-energy neutron detection for revealing ion acceleration from unanticipated weak sources.
2. EVALUATION OF THE ENERGY- AND ANGLE-DEPENDENT NEUTRON-PRODUCTION CROSS SECTIONS FROM HEAVY-TARGET INTERACTIONS
2.1. Neutron Production Mechanisms
One way that models of nuclear reactions such as those producing neutrons can be classified is by the number of intra-nuclear collisions that occur. The direct mechanism involves one (or, possibly, two) collisions, pre-equilibrium involves a few, and evaporation involves many. In the direct mechanism, one or more neutrons are produced in essentially one step, leaving the residual nucleus in a discrete, bound energy state. Both pre-equilibrium and evaporation mechanisms involve formation of a compound nucleus. In the pre-equilibrium mechanism, the neutrons are emitted before the kinetic energy of the projectile has been fully shared with the nucleons of the target nucleus. In the evaporation mechanism, the kinetic energy of the projectile is shared fully among the target nucleons and equilibrium is achieved.
For the direct mechanism, the energy-dependent neutron-production cross sections can exhibit considerable structure as processes such as stripping, projectile breaking, and nucleon transfer contribute. At high interaction energies, the direct mechanism typically contributes only a small fraction to the total yield and produces neutrons mainly at high energies and in the forward direction. At lower interaction energies, it contributes more, and neutron production becomes more isotropic. In the pre-equilibrium mechanism, some memory of the projectile is retained, and neutron production is anisotropic. In the evaporation mechanism, all memory of the projectile is lost, and the angular distribution of the ejected neutrons is isotropic.
At high interaction energies these three mechanisms are easily distinguished in neutron cross sections. We show in Figure 1(a) the angle-integrated neutron-energy-dependent neutron-production cross section calculated with TALYS for 60 MeV protons interacting with 24Mg. The direct, pre-equilibrium, and evaporation components are indicated. The isotropic evaporation component exhibits a peak at low energy and then decays exponentially with increasing neutron energy. The pre-equilibrium component is smooth, relatively flat, and then falls with increasing neutron energy. TALYS calculations show that the slope of this fall-off steepens as the angle between the direction of the emitted neutron and the projectile direction increases. The direct component dominates the cross section at the highest neutron energies and produces some structure, but, at this high proton interaction energy (60 MeV), it accounts for <1% of the total neutron production.
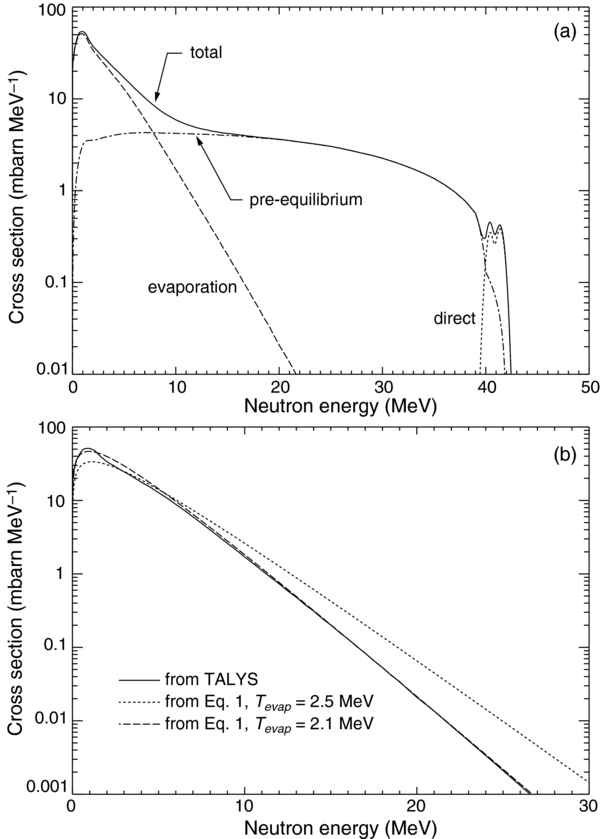
Figure 1. Panel (a): angle-integrated neutron-production cross section calculated with TALYS for 60 MeV protons on 24Mg. Contributions from the three production mechanisms are shown. Panel (b): detail of the evaporation component cross section as calculated with TALYS (solid) and with Equation (1) with Tevap = 2.5 MeV (dotted) and Tevap = 2.1 MeV (dashed).
Download figure:
Standard image High-resolution imageAt interaction energies greater than about 50 MeV nucleon−1, the general characteristics of the evaporation and pre-equilibrium components seen in Figure 1(a) are typically present in all neutron-production cross sections, essentially independent of target mass. This can be seen in the neutron cross-section measurements presented by Koning & Duijvestijn (2004) for a wide range of target masses (atomic numbers from 24 to 209) and energies (from 7 to 200 MeV). The isotropic angular dependence of the evaporation component and the smooth dependence of the pre-equilibrium component on the emitted-neutron angle can be seen, for example, in the measurements presented by Kalend et al. (1983) in their Figure 6, where laboratory doubly differential cross sections of neutrons resulting from 90 MeV proton bombardment of 27Al, 58Ni, 90Zr, and 209Bi are shown. Neutron production from α projectiles at high energies also exhibits these same general characteristics.
This generality of the characteristics of neutron-production cross sections at >50 MeV interaction energies enabled Hua et al. (2002) to separately calculate the evaporation and pre-equilibrium components, introducing simple analytic expressions for neutron angle- and energy-dependent cross sections that covered large ranges of target masses and interaction energies. This resulted in very efficient and fast computation. In Section 2.2, we discuss the Hua et al. (2002) procedure in more detail and introduce improvements to it. Note that at these high interaction energies, the direct-reaction contribution to neutron production is typically very small and is neglected.
For both proton and α projectiles at interaction energies less than about 40 MeV, neutron-production cross sections no longer exhibit these general characteristics essentially independent of target mass. The simple procedure for determining neutron-production cross sections developed by Hua et al. (2002) at high interaction energies is no longer accurate at these lower energies. This is especially true for lighter elements and at energies near the Coulomb barrier, both of which are of special interest for the production of low-energy neutrons. In Section 2.3 we describe a new procedure for calculating neutron energy-dependent cross sections at these low energies.
2.2. Heavy-target Neutron Production at High Interaction Energies
2.2.1. Evaporation Component
Hua et al. (2002) approximated the center-of-mass neutron kinetic-energy distribution for the evaporation component with the expression

where En is the neutron energy in the center of mass. This expression reproduces the general behavior of this component: a rise to a maximum followed by an exponential decay at higher energies. The parameter γ was fixed at a value of 5/11. Hua et al. (2002) assumed the parameter Tevap to be constant for all projectiles, targets, and projectile energies with a value of 2.5 MeV. However, nuclear-reaction theory associates Tevap with the density of states of the nucleus (Blatt and Weisskopf) so Tevap would be expected to depend on the projectile, target, and projectile energy.
Using TALYS, we calculated the energy-dependent evaporation neutron-production cross section for various projectiles, targets, and projectile energies. For α-particle reactions at energies >10 MeV nucleon−1 and for proton reactions at energies >30 MeV, TALYS confirmed that the cross section does indeed fall exponentially with neutron energy as described by Equation (1). But we found that by varying Tevap as a function of projectile, target, and projectile energy, we could achieve better agreement of the cross sections calculated using Equation (1) with those calculated with TALYS. (We found that the parameter γ could be left unchanged with the value of 5/11.) In Figure 1(b) we show the energy-dependent evaporation neutron-production cross section for 60 MeV protons interacting with 24Mg calculated with TALYS (solid curve), calculated using Equation (1) with Tevap = 2.5 MeV (dotted curve), and calculated using Equation (1) with the best-fitting value for Tevap for this reaction of 2.1 MeV (dashed curve).
In Table 1 we present values of Tevap that best fit the neutron-production cross sections calculated with TALYS for proton interactions with 16O, 24Mg, and 56Fe at several projectile energies. Similarly, in Table 2 we present values of Tevap for α-particle interactions. We see that for proton interactions with 16O and 24Mg, the values are close to that assumed by Hua et al. (2002; 2.5 MeV). For 56Fe the value is significantly less. For α-particle interactions, most values are quite different from that assumed by Hua et al. (2002). In all cases, Tevap increases with increasing projectile energy and decreases with increasing target mass. Because of the relatively weak dependence of Tevap on target mass, in the neutron-production code we will use the values calculated for 16O for all of the light-mass elements (C, N, and O) and the values calculated for 24Mg for all of the intermediate-mass elements (Ne, Mg, and Si).
Table 1. Evaporation Parameters for Proton Interactions
| Target | Projectile Energy | Tevap | Fevap |
|---|---|---|---|
| (MeV) | |||
| 16O | >70 | 3.0 | 0.60 |
| 40–70 | 2.5 | 0.75 | |
| 24Mg | >70 | 2.5 | 0.62 |
| 40–70 | 2.0 | 0.60 | |
| 56Fe | >70 | 1.7 | 0.68 |
| 40–70 | 1.7 | 0.69 | |
| 22–40 | 1.4 | 0.77 |
Download table as: ASCIITypeset image
Table 2. Evaporation Parameters for α-particle Interactions
| Target | Projectile Energy | Tevap | Fevap |
|---|---|---|---|
| (MeV nucleon−1) | |||
| 16O | >45 | 5.0 | 0.87 |
| 20–45 | 4.0 | 0.85 | |
| 7.5–20 | 3.0 | 0.93 | |
| 24Mg | >45 | 4.0 | 0.90 |
| 20–45 | 3.0 | 0.87 | |
| 7.5–20 | 2.0 | 0.87 | |
| 56Fe | >45 | 3.5 | 0.93 |
| 20–45 | 2.5 | 0.90 | |
| 7.5–20 | 1.7 | 0.94 | |
| 3.75–7.5 | 1.5 | 0.96 |
Download table as: ASCIITypeset image
Table 3. Targets, Projectiles, and Neutron-production Threshold Energies (MeV nucleon−1)
| Isotope | Proton | α-particle |
|---|---|---|
| 1H | 292.3 | 25.7 |
| 3He | 10.3 | 5.5 |
| 4He | 25.7 | 9.5 |
| 12C | 19.6 | 2.8 |
| 13C | 3.2 | Exothermic |
| 14N | 6.3 | 1.5 |
| 15N | 3.7 | 2.0 |
| 16O | 17.2 | 3.8 |
| 18O | 2.5 | 0.2 |
| 20Ne | 15.4 | 2.2 |
| 22Ne | 3.8 | 0.15 |
| 24Mg | 15.0 | 2.1 |
| 25Mg | 5.3 | Exothermic |
| 26Mg | 5.0 | Exothermic |
| 28Si | 15.6 | 2.3 |
| 29Si | 5.9 | 0.4 |
| 56Fe | 5.5 | 1.4 |
| 54Fe | 9.2 | 1.6 |
Download table as: ASCIITypeset image
2.2.2. Pre-equilibrium Component
Hua et al. (2002) calculated energy- and angle-dependent neutron-production cross sections for the pre-equilibrium component using angle-dependent exponentials independent of projectile and target species as given by their Equations (2) through (9). Hua et al. (2002) compared such calculated cross sections with laboratory measurements and found very good agreement. We have now compared these pre-equilibrium cross sections with both laboratory measurements and those calculated with TALYS and confirmed this agreement. For example, the measured (Kalend et al. 1983) angle-integrated neutron cross section for 90 MeV protons interacting with 58Ni is shown in Figure 2 (diamonds). Also shown is the pre-equilibrium component calculated using the Hua et al. (2002) procedure (along with the evaporation component calculated with TALYS). The combined total cross section fits the measured cross section very well. At high interaction energies, therefore, we will continue using the Hua et al. (2002) procedure for calculating the pre-equilibrium neutron-production cross section in the neutron-production code.

Figure 2. Calculated angle-integrated neutron-production cross section for 90 MeV protons on 58Ni compared with measurements (Kalend et al. 1983). The pre-equilibrium component (calculated using the Hua et al. 2002 procedure) and the evaporation component (from TALYS) are also shown.
Download figure:
Standard image High-resolution image2.2.3. Combined Evaporation and Pre-equilibrium Components
Hua et al. (2002) combined the evaporation and pre-equilibrium components to produce the total neutron-production cross section by introducing an additional parameter, Fevap, the fraction of the total neutron production contributed by the evaporation component. (Note that the total neutron production is determined by the total production cross sections evaluated and presented by Hua et al. 2002 in their Figure 1.) Hua et al. (2002) derived Fevap for the various reactions from numerical results of Monte Carlo simulations (Alsmiller et al. 1967) of the cascade model, which is known to be accurate at high energies. For proton interactions, one set of values for the target nuclei was used at energies <40 MeV and another set for energies >40 MeV. For α-particle reactions, only one value was used for all interacting energies.
With TALYS, Fevap can be calculated as a function of projectile, target, and projectile energy. In Tables 1 and 2 we also show Fevap calculated with TALYS for proton and α-particle reactions, respectively. For proton reactions with lighter targets, the TALYS values are significantly higher than those used by Hua et al. (2002). For α-particle interactions with 16O and 24Mg, the values are quite similar to the value used by Hua et al. (2002), and the values for α-particle interactions with 56Fe are somewhat higher. Again, because of the relatively weak dependence of Fevap on target mass, in our neutron-production code we will use the values calculated for 16O for all of the light-mass elements (C, N, and O) and the values calculated for 24Mg for all of the intermediate-mass elements (Ne, Mg, and Si).
In summary, we have shown that, at high ion-interaction energies, the original Hua et al. (2002) procedure used in the flare-loop code is generally adequate for calculating the energy- and angle-dependent neutron-production cross sections of both the evaporation and pre-equilibrium components. Using TALYS, we have improved its accuracy by introducing target and energy dependences for the procedure's parameters Tevap and Fevap. Because of its analytical simplicity and computational efficiency, we shall continue to use in the code the Hua et al. (2002) procedure (with the above improvements) for calculating neutron-production cross sections at high ion energies. The energy below which this procedure is no longer adequate and the new procedure used at these lower energies are discussed in the next section.
2.3. Heavy-target Neutron Production at Low Interaction Energies
As discussed above, neutron-production cross sections at low interaction energies no longer exhibit the general characteristics exhibited at high energies that allow simple separation into evaporation and pre-equilibrium components easily represented by analytical functions with parameters varying smoothly with projectile, target, and projectile energy. In addition, the direct component begins to become important. This transition of cross section behavior as projectile energy is reduced can be clearly seen, for example, in the measured cross sections of 90Zr for the wide range of proton energies (from 22 to >200 MeV) presented by Koning & Duijvestijn (2004). In those measurements, even for a target as heavy as 90Zr, considerable structure begins to appear at projectile energies <45 MeV.
This observed transition of the cross section behavior as the projectile energy is lowered is reproduced in the cross sections calculated with TALYS. Figure 3 shows the neutron-production cross section calculated with TALYS for 15 MeV protons interacting with 24Mg. Compared with the cross section calculated for 60 MeV protons interacting with 24Mg (Figure 1(a)), the separation of the components is no longer visually obvious and there is considerable structure present in the strong direct component. Note also that the calculated pre-equilibrium component becomes more isotropic than at higher energies. This behavior is typical of low-energy reactions for most targets because at low energies the Coulomb repulsion becomes important in determining the projectile's trajectory. The closest approach to the target where the short-range nuclear force can operate is most likely in head-to-head collisions, and the reaction products therefore begin to be emitted more in the backward direction, producing a more isotropic neutron angular distribution.
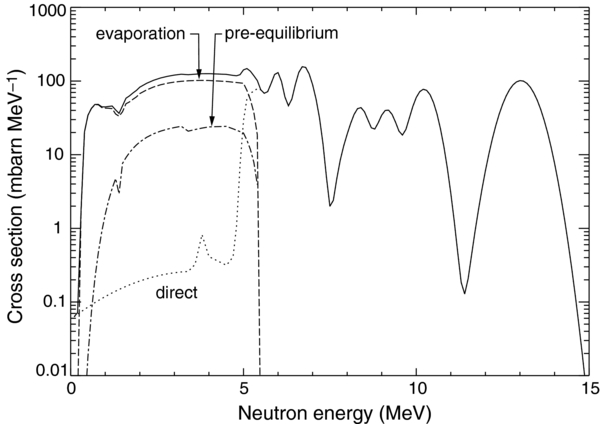
Figure 3. Angle-integrated neutron-production cross section calculated with TALYS for 15 MeV protons on 24Mg. Contributions from the three production mechanisms are also shown. The solid curve is the total cross section.
Download figure:
Standard image High-resolution imageBecause representing such neutron cross sections with simple analytic expressions would be impossible, our new approach at low projectile energies is to use projectile-energy-dependent neutron-production cross sections calculated with TALYS directly in the code. These cross sections have been calculated for a set of discrete projectile energies and are included in the neutron code in tabular form. As the Monte Carlo procedure progresses, the code interpolates among these tables to obtain the required neutron energies. Because of the relatively weak dependence of these cross sections on target mass, in our neutron-production code we use the tabulated cross sections calculated for 16O for all light-mass elements (C, N, and O), and the cross sections calculated for 24Mg for all intermediate-mass elements (Ne, Mg, and Si).
We use these tables at projectile energies below which the analytic expressions of the Hua et al. (2002) procedure described in the previous section no longer accurately describe the neutron-production cross section. By inspection of the TALYS-calculated cross sections, we established that these transition energies are 40 MeV for protons interacting with C through Si and 22 MeV for Fe. They are 7.5 MeV nucleon−1 for α-particles interacting with C through Si and 4 MeV nucleon−1 for Fe.
3. CALCULATED NEUTRON SPECTRA AND YIELDS AND NEUTRON-CAPTURE LINE YIELDS
We incorporated the revised procedures and tabulated cross sections into the Hua et al. (2002) flare-loop code and now use it to calculate neutron spectra and yields and neutron-capture line yields. We first describe the flare-loop model and its parameters and how the parameters qualitatively affect the neutrons escaping from the Sun and the neutron-capture line (Section 3.1). We note that some of the material concerning the parameter dependences of the products of nuclear reactions was presented elsewhere (e.g., Hua et al. 2002; Murphy et al. 2007). Here we summarize the material that specifically addresses neutron production and include additional details, providing in one place all of the background needed to understand the parameter dependences. We then use the code to calculate escaping-neutron spectra and capture-line yields for specific sets of loop parameters, first from mono-energetic ions of low energy (Section 3.2) to identify features and properties that characterize neutron production by low-energy ion interactions. This will also reveal the changes to the calculated neutron spectra resulting from the revisions to the procedures. While there is no observational evidence for low-energy mono-energetic ion acceleration in solar flares, existing measurements at 1 AU are probably too insensitive to detect any very weak events that may be occurring. Calculations for production by mono-energetic ions can also be combined to give results for any shape ion spectrum. We then repeat the calculations for accelerated-ion kinetic-energy spectra expected from typical flares; i.e., power laws differential in ion energy (Section 3.3).
To answer the questions posed in the Introduction, we will focus on two escaping-neutron energy windows (>30 MeV, most relevant for observations at 1 AU, and 1–10 MeV, relevant for inner-heliosphere observations), but we will also discuss <1 MeV neutrons. The MESSENGER neutron detector was most sensitive in the 1–10 MeV energy range, which is probably typical of the small detectors that would be included on future inner-heliosphere spacecraft. For both mono-energetic ions and ions having power-law spectra, we will show which reactions are responsible for the production of the escaping neutrons and the neutron-capture line and calculate the expected fluences of these emissions. For power-law spectra we will also show what ion energies are responsible for both the neutrons and the capture line. We will consider the Compton-scattered continuum of the neutron-capture line and will also discuss the effects of changing the loop parameters.
We note that neutron spectra at the Sun similar to those calculated here were presented in Share et al. (2011). Those were angle-integrated spectra at the production site in the solar atmosphere. Here we present angle-dependent spectra of the neutrons after escape from the solar atmosphere, more relevant for discussion of neutron detection in interplanetary space. Also, the calculations now extend down to 0.1 MeV neutron energy.
3.1. The Flare-loop Model and the Production of Neutrons and the Neutron-capture Line
In this section we discuss neutron and neutron-capture line production within the flare-loop model. In Section 3.1.1 we discuss the model itself and its parameters. In Section 3.1.2 we discuss how the loop parameters affect the angular and height distributions of the accelerated ions when they interact to produce the neutrons. These distributions directly affect the escaping-neutron spectra and the neutron-capture line yields as discussed in Sections 3.1.3 and 3.1.4.
3.1.1. The Flare-loop Model and Its Parameters
The flare-loop model (Hua et al. 1989, 2002) is represented by a set of parameters that describe the accelerated ions and the physical conditions of a magnetic loop in the solar atmosphere within which the ions are transported. These parameters are the energy spectrum and abundances of the accelerated ions, the magnetic convergence of the loop and the level of PAS within the loop, the composition and density–height distribution of the atmosphere, the loop length L, and the location of the flare on the disk relative to the directions of the neutron and gamma-ray detectors. The legs of the loop are perpendicular to the solar surface.
For the calculations presented in Section 3, we assume a coronal composition (Reames 1995) for both the accelerated ions and the ambient atmosphere (with a value of 0.1 for the ambient 4He/H ratio and a value of 0.2 for the accelerated α/proton ratio). The ambient 3He/H ratio is 3.7 × 10⁻⁵ (Mahaffy et al. 1998) and the accelerated 3He/4He ratio is 0.05. Studies of gamma-ray data from flares observed with the Solar Maximum Mission (SMM) and RHESSI (Mandzhavidze et al. 1997; Share & Murphy 1998; and G. H. Share 2011, private communication) generally indicate that the ambient medium and the accelerated particles have coronal abundances for elements heavier than 4He and the accelerated-ion α/proton ratio is at least as large as 0.2. Changing the ambient composition has little effect on neutron production. The atmosphere density–height distribution is the sunspot active region model given by Avrett (1981).
The composition of the accelerated ions in some flares may be similar to that of "impulsive" SEP events observed in interplanetary space where the abundances of elements heavier than 4He are enhanced relative to protons as compared with those of the corona (e.g., see Reames 1995). The accelerated 3He/4He ratio can also be enhanced, up to an extreme value of 1 or more. To investigate the effect on neutron and neutron-capture line production, we repeat the calculations assuming the Reames (1995) impulsive-event SEP composition ("3He-rich") for the flare-accelerated ions heavier than 4He relative to each other, but with an accelerated α/proton ratio of 0.2. This α/proton ratio is about a factor of six higher than that given by Reames (1995) for "average" impulsive events, and we have also increased the abundance of elements heavier than 4He relative to protons by this factor of six to maintain an α/O ratio of 50. The resulting accelerated Fe/proton ratio is larger than that of the corona by a factor of ∼60. We also assume an extreme accelerated 3He/4He ratio of 1. Where appropriate in the following, we will note the impact of assuming this impulsive-event composition.
Note that while we assumed an extreme value of 1 for the accelerated 3He/4He ratio for the impulsive-event composition, the flare-loop code currently does not consider neutron production by accelerated 3He with ambient heavy elements, only with ambient H and 4He. The neutron-production cross sections for 3He reactions with heavy elements can also have threshold energies below 1 MeV nucleon−1 similar to the α-particle reactions. However, contribution to neutron production by these reactions would be significant only if the accelerated 3He/4He ratio were as large as the largest values observed in impulsive SEP events in space. The inclusion of these 3He reactions in the code involves significant effort evaluating numerous cross sections and is beyond the scope of this paper; they will be addressed in a subsequent paper. Where appropriate in the following, when the impact of the impulsive-event composition is considered, we will provide an estimate of the effect of these 3He reactions. The inverse reactions of accelerated heavy elements with ambient 3He are not significant because the ambient 3He/H abundance ratio is very low (∼10−5).
The ions are released at the top of the loop with an isotropic angular distribution. This isotropic release produces a downward isotropic distribution of ions entering the top of each leg of the loop. The redshifts of the de-excitation line centroids measured with SMM (Share et al. 2002) are consistent with a downward-isotropic interacting-ion distribution. (In the discussion of Section 4, we will also consider ions released as a downward beam directed along the axis of the loop.) We emphasize the distinction between the angular distribution of the ions when released at the top of the loop and the angular distribution of the ions when they interact after transport down the loop. As will be seen in the following sections, the latter angular distribution is what is important for the production of neutrons and their subsequent behavior.
For the accelerated-ion kinetic-energy distributions, all accelerated-ion species have the same spectrum (weighted by their relative abundances), and we will consider both mono-energetic ions and power-law distributions. The power law is differential in ion energy (per nucleon) with spectral index s (∝E−sion) down to 1 MeV nucleon−1 and then constant at lower ion energies (i.e., a "broken" power law). In the discussion (Section 4), we will also consider an unbroken power law below 1 MeV nucleon−1.
Neutron measurements of the 1991 June 4 flare observed with OSSE (Murphy et al. 2007) at 1 AU showed that for that flare the ion spectrum above ∼100 MeV nucleon−1 must steepen from the power law at lower energies. We will investigate the effect of such an ion spectrum on neutron production by performing the calculations using a power law with exponential roll-over; i.e., ∝E−sion × exp (− Eion/E0) with roll-over energy E0. E0 → ∞ returns the spectrum to the original power law. Where appropriate in the following, we will note the impact of assuming this ion spectrum.
Below the transition region, the magnetic field strength is assumed to be proportional to a power δ of the pressure (Zweibel & Haber 1983). δ ≠ 0 corresponds to a converging magnetic field. For coronal and photospheric pressures of 0.2 and 105 dyne cm−2 (corresponding to atmospheric heights of approximately 2000 and 0 km, respectively) and associated magnetic-field strengths of 100 and 1600 G, respectively, δ ≃ 0.2. PAS is characterized by Λ, the mean free path required for an arbitrary initial angular distribution to relax to an isotropic distribution. In the model, the level of PAS is characterized by λ, the ratio of Λ to the loop half-length Lc (=L/2). No PAS corresponds to λ → ∞.
In the Monte Carlo simulation (see also Hua et al. 2002 and Hua & Lingenfelter 1987b for a complete discussion), the kinetic energy and direction relative to the energetic ion of each neutron is determined from the angle- and energy-dependent cross sections used by the code for each specific neutron-producing reaction. For those cross sections providing neutron information in the center-of-momentum frame, standard relativistic transformations to the laboratory frame are used (see, for example, Ramaty et al. 1979). Each neutron is followed, usually through many scatterings, until it either escapes from the solar atmosphere, decays, or slows down and is captured either radiatively on H to form deuterium with the emission of a 2.223 MeV gamma ray, or nonradiatively on 3He to form 3H with the emission of a proton. Only elastic scattering of the neutrons on hydrogen is considered since the contributions to neutron thermalization by scattering on He and heavier nuclei are negligible. The flux of neutrons escaping from the solar atmosphere is thus determined as a function of neutron energy and zenith angle.
Because effective neutron capture requires high density, it typically occurs deep in the photosphere after the neutrons have lost their initial energies and thermalized. Each 2.223 MeV gamma ray produced is followed until it either escapes from the solar atmosphere or is multiply Compton scattered to low energy (<20 keV). The flux of both the unscattered 2.223 MeV gamma-ray line and the Compton-scattered continuum escaping from the solar atmosphere is thus determined as a function of gamma-ray energy and zenith angle. Because most of the captures take place after the neutrons have thermalized at energies of ∼0.5 eV, the line energy is essentially unshifted and the line width is very narrow, with a Doppler broadened full width at half-maximum of only ∼0.1 keV.
3.1.2. The Effect of the Flare-loop Model Parameters on Neutron-producing Nuclear Interactions
For no magnetic convergence (δ = 0), the initial angular distribution of the accelerated ions is maintained as the ions propagate down the loop. For an isotropic angular distribution at the top of the loop, this results in a downward-isotropic angular distribution of ions when they reach the denser layers of the atmosphere and interact to produce neutrons. This is seen in Figure 4 where the interacting-ion angular distribution for δ = 0 as calculated by the code (black histogram) is shown versus μ = cos (θ), where θ is the angle between the normal to the solar surface and the direction of the ion. μ = 1 (θ = 0) is directed outward from the Sun. (Note that: the fluctuations are due to counting statistics associated with the Monte Carlo technique used by the code.)
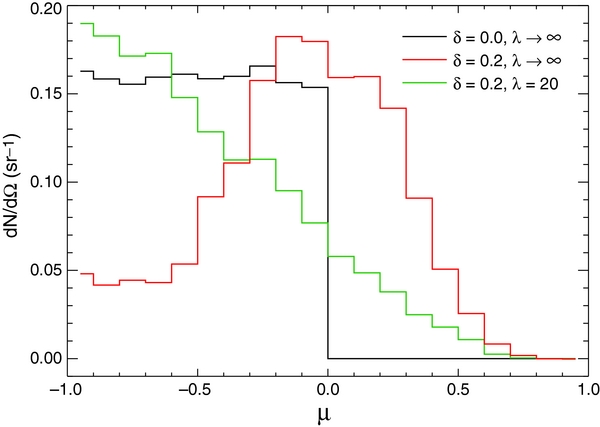
Figure 4. Dependence of the interacting-ion angular distribution on magnetic convergence (δ) and PAS (λ). μ = cos (θ), where θ is the angle between the normal to the solar surface and the direction of the ion. θ = 0° (μ = 1) is directed outward from the Sun, θ = 180° (μ = −1) is directed inward into the Sun, and θ = 90° (μ = 0) is directed parallel to the solar surface. The distributions are for isotropic release of ions at the top of the loop and are normalized to unity.
Download figure:
Standard image High-resolution imageFor no convergence, the height distribution of the neutron-producing interactions in the solar atmosphere simply reflects the ranges of the ions: the accumulated column density required for the accelerated ions to lose energy and interact as they move downward through the solar atmosphere. This range depends on the ion energy as is illustrated in Figure 5(a) which shows the fraction of interactions occurring deeper than a given height in the solar atmosphere for three accelerated-ion power-law spectral indexes: s = 2, 4, and 6. Harder spectra (smaller s) have more high-energy ions whose longer ranges shift the distributions to lower heights (higher densities).

Figure 5. Dependence of the height distribution of neutron production on loop conditions: (a) isotropic accelerated-ion release and δ = 0.0, λ → ∞ (downward-isotropic interacting ions), (b) isotropic accelerated-ion release and δ = 0.45, λ → ∞ (pancake interacting ions), (c) isotropic accelerated-ion release and δ = 0.45, λ = 20 (replenished loss-cone interacting ions), and (d) downward-beam accelerated ions and δ = 0.0, λ → ∞ (downward-beam interacting ions). The distributions are shown for accelerated-ion spectral indexes s of 2, 4, and 6. h = 0 corresponds to unit optical depth at 500 nm. Additional horizontal axes at the top of the figure show the density and overlying grammage in the atmosphere corresponding to the x-axis heights. The dashed vertical line is the top of the photosphere.
Download figure:
Standard image High-resolution imageA converging magnetic field (δ ≠ 0) results in mirroring of the accelerated ions with the mirroring height depending on the initial pitch angle of the ion. Most ions interact near their mirroring heights (where the density is greatest), and the angular distribution of the interacting ions is therefore peaked in directions tangential to the solar surface (a "pancake" distribution). However, ions with initial pitch angles less than a certain value have mirror points so deep in the atmosphere that they are more likely to be lost on their first transit down the loop, either to nuclear reactions (including neutron production) or having their energies fall below reaction threshold energies. This angle defines the "loss cone." This can be seen in Figure 4, where the angular distribution for δ = 0.2 is shown (red histogram). The distribution peaks near μ = 0 (θ = 90°) and the excess near μ = −1 is due to interactions of ions with initial pitch angles within the loss cone.
Mirroring in a converging magnetic field also affects the height distribution of the neutron-producing interactions as ions are prevented from penetrating to the lower atmosphere. Neutron production occurs higher in the solar atmosphere, as can be seen by comparing panels (a) and (b) of Figure 5, where the height distributions for no convergence (δ = 0) and strong convergence (δ = 0.45) are shown.
PAS modifies the angular distribution of the ions as they propagate through the loop, replenishing the loss cone as ions are lost. This results in a more downward-directed angular distribution of ions when they interact to produce neutrons than without PAS. Hua et al. (2002) found that there is a limitation to this effect: When the rate of PAS exceeds the ion loss rate, the loss cone is "saturated." Saturation occurs for λ ≲ 20. The shift to more downward-directed interactions can be seen in Figure 4, where the angular distribution for saturated PAS (and δ = 0.2) is shown (green histogram).
PAS also affects the height distribution of the neutron-producing interactions, with production occurring deeper in the solar atmosphere as more ions are scattered downward into the loss cone rather than mirrored. This can be seen by comparing the height distributions in panels (b) and (c) of Figure 5 for no PAS (λ → ∞) and saturated PAS (λ = 20), respectively (and δ = 0.45).
We see that both magnetic convergence and PAS affect both the angular distribution of the accelerated ions when they interact to produce the neutrons and the heights in the atmosphere where those interactions occur. In addition, the ion kinetic-energy spectrum also affects the interaction height distribution. These interacting-ion angular and height distributions directly affect the spectra and yields of the escaping neutrons and the yields of the neutron-capture line. These spectra and yields are also affected by the composition of both the accelerated ions and the ambient medium (see the discussion of Section 4.1). While the loop length can affect the time dependence of both neutron production and the neutron-capture line, it has no effect on their time-integrated spectra and yields. There is minimal dependence of the interacting-ion angular distributions on the ion spectral index. Now, with the knowledge of the effects that s, δ, and λ have on the interacting ions, in the next two sections we discuss their effects on the resulting escaping-neutron spectra and yields and the yield of the neutron-capture line.
3.1.3. Escaping-neutron Production
Except for very hard accelerated-ion spectra, the neutron-production height distributions in Figure 5(a)–(c) show that most neutrons are produced above 0 km, which corresponds to an overlying grammage of <10 g cm−2. Hua & Lingenfelter (1987a) showed that at these heights those neutrons initially directed upward have a good chance of escaping from the solar atmosphere without scattering. Of the neutrons initially headed downward, a fraction may be scattered upward and escape with reduced energy, but most will lose their energy in the solar atmosphere with some being captured on H producing the neutron-capture line. Neutrons produced moving tangentially to the solar surface can be scattered as they propagate through the atmosphere, changing their direction and lowering their energy. Scattering is more significant for lower-energy neutrons because their scattering cross sections are larger.
Thus, neutron escape depends on the initial angular distribution of the neutrons, which, in turn, depends on the angular distribution of the interacting ions. Higher-energy neutrons will have an angular distribution similar to that of the interacting ions since such neutrons tend to be emitted in nearly the same directions as the initial ions. This is because in the center-of-momentum frame, higher-energy neutrons from pre-equilibrium reactions are emitted more in the forward direction, and this is enhanced by the transformation from the center-of-momentum frame to the laboratory frame, especially for the inverse reactions of accelerated heavy ions where the center of momentum has a large velocity. Lower-energy neutrons are emitted more isotropically, independent of the angular distribution of the interacting ions. This imposes an angular dependence on the escaping-neutron spectrum: the measured properties of the escaping neutrons will depend on the flare heliocentric observation angle θnobs, the angle between the normal to the solar surface at the flare and the direction to the neutron detector.
With no magnetic convergence (δ = 0), the resulting downward isotropic distribution of the interacting ions (see Figure 4) produces limb brightening of high-energy neutrons. In limb flares, more of the tangentially moving neutrons can escape toward the detector than in disk flares where they must first be scattered upward to escape toward the detector. For low-energy neutrons, which are more sensitive to scattering, the behavior is more complicated. Although they are more isotropic, what anisotropy there is results in limb brightening, as is the case for high-energy neutrons, but for such limb flares this competes with limb darkening due to the increased scattering. For steep ion spectra, neutron production is high enough in the atmosphere that scattering is less important, resulting in limb brightening of low-energy neutrons. For hard ion spectra, the increased scattering from deeper production results in limb darkening. For intermediate ion spectra, there can be a peak of the escaping low-energy neutron fluence at mid-heliocentric flare angles.
With magnetic convergence (δ ≠ 0) but no PAS, all escaping neutrons exhibit limb brightening because they are produced sufficiently high in the solar atmosphere (see panel (b) of Figure 5). The brightening is stronger for higher-energy neutrons since they are more tangentially directed similar to the interacting-ion directions (see Figure 4). When PAS is present, limb brightening is weaker because the neutrons are produced deeper in the atmosphere (Figure 5(c)) and preferentially in downward directions rather than tangentially (see Figure 4).
As we will show in Sections 3.2 and 3.3 (see Figures 7, 8, and 15–20), when compared with their production spectra, escaping-neutron spectra from limb flares are deficient in lower-energy neutrons because their scattering cross sections are larger. On the other hand, escaping-neutron spectra from disk flares are more abundant in lower-energy neutrons. These additional low-energy neutrons initially were higher-energy neutrons moving downward but escaped after several scatterings, changing their directions and reducing their energies.
3.1.4. Neutron-capture Line Production
Some of the neutrons produced moving downward can be captured on H to produce deuterium and the 2.223 MeV neutron-capture line. In addition, some of the tangentially moving neutrons can be scattered downward, and some of those can also be captured. Neutrons initially moving upward escape with essentially no chance of line production. So, similar to escaping neutrons, the probability of capture also depends on the angular distribution of the neutrons, which in turn depends on the interacting-ion angular distribution. For isotropic release of ions at the top of the loop and no PAS, changing δ from 0 (no magnetic convergence, downward-isotropic interacting-ion angular distribution) to δ = 0.45 (strong convergence, pancake distribution) can reduce the capture probability by up to a factor of two. PAS results in more downward-directed interactions and can increase the capture probability by up to a factor of two.
Because the capture line is produced deep in the atmosphere, attenuation of the line due to Compton scattering imposes a strong dependence of the observed line fluence on the flare heliocentric observation angle θ2.223obs (the angle between the flare normal and the direction to the gamma-ray detector). Although the line can be intrinsically the strongest line produced in a flare, its measured escaping fluence can be very weak if the flare is located near the solar limb.
The atmospheric height distributions of neutron capture for isotropic release of ions at the top of the loop with three spectral indexes (2, 4, and 6) and δ = 0 and 0.45 (all with no PAS) are shown in Figure 6. For all but the hardest accelerated-ion spectra, neutron production occurs high enough in the atmosphere (see Figure 5) that neutron capture will occur at essentially the same depth in the photosphere regardless of the interacting-ion angular distribution (i.e., independent of δ and λ). The resulting line attenuation therefore does not depend on δ and λ, although the line production (i.e., neutron capture on H) does, as discussed above.

Figure 6. Depth distribution of neutron capture on H for ion spectral indexes s of 2, 4, and 6 and for two values of loop convergence: no convergence (δ = 0) and strong convergence (δ = 0.45). For ease of comparison, the distributions have been normalized to unity. h = 0 corresponds to unit optical depth at 500 nm. Additional horizontal axes at the top of the figure show the corresponding density and overlying grammage in the atmosphere. The dotted vertical line is the top of the photosphere.
Download figure:
Standard image High-resolution imageNeutrons from harder ion spectra are captured deeper because neutron production itself is deeper and because the neutrons have higher energies and therefore longer ranges. This results in more attenuation of the line and also a weak dependence on δ and λ. While strong PAS (or weak convergence) results in increased captures due to the more downward-directed angular distribution, this is offset by the increased attenuation due to the deeper captures of the hardest ion spectra.
3.2. Neutron Spectra and the Neutron-capture Line Resulting from Low-energy Mono-energetic Ions
In Section 3.2.1 we calculate escaping-neutron spectra and in Section 3.2.2 we calculate neutron-capture line fluences from interactions of mono-energetic ions. Note that these calculations are for an assumed coronal accelerated-ion composition and a broken power-law ion spectrum. Where appropriate, we will discuss the impact of assuming the impulsive-event composition and different spectra.
3.2.1. Neutron Spectra Resulting from Low-energy, Mono-energetic Ions
We show in Figures 7 and 8 calculated neutron kinetic-energy spectra resulting from interactions of mono-energetic ions of six low projectile energies: 0.5, 0.75, 2, 5, 10, and 30 MeV nucleon−1. These are escaping-neutron spectra at the Sun; i.e., just after transport through the solar atmosphere but before any modification due to neutron decay. Figure 7 is for a disk flare (θnobs = 0°) and Figure 8 is for a limb flare (θnobs = 85°). The neutron spectra are normalized to one accelerated proton of the given energy and are for isotropic release at the top of a loop with no magnetic convergence or PAS (δ = 0, λ → ∞), which results in a downward-isotropic interacting-ion angular distribution. The solid black curves are the total spectra, and spectra from the eight contributing reaction types (p + H, p + 4He, α + H, α + 4He, p + CNO, CNO + H, α + CNO, and CNO + 4He where CNO refers to all nuclear species heavier than 4He) are also shown. For the accelerated 3He abundance assumed, contributions from 3He reactions are not significant. The solid colored curves are for accelerated proton and α-particle reactions with ambient material and the dashed colored curves are the inverse reactions of accelerated heavy ions interacting with ambient H and 4He. We discuss these spectra below, demonstrating how the contributions from the various neutron-producing reactions change as the interaction energy increases and the flare heliocentric angle changes.

Figure 7. Calculated escaping-neutron spectra at the Sun from interactions of mono-energetic accelerated ions of 0.5, 0.75, 2, 5, 10, and 30 MeV nucleon−1 for a disk flare (θnobs = 0°). The spectra are normalized to one accelerated proton. Neutron spectra from the various contributing reactions are also shown. "CNO" refers to all nuclear species heavier than 4He. The dotted curves are the total neutron spectra calculated using the original Hua et al. (2002) procedure. Note that the pairs of panels ((a)–(b), (c)–(d), and (e)–(f)) have different y-axes.
Download figure:
Standard image High-resolution image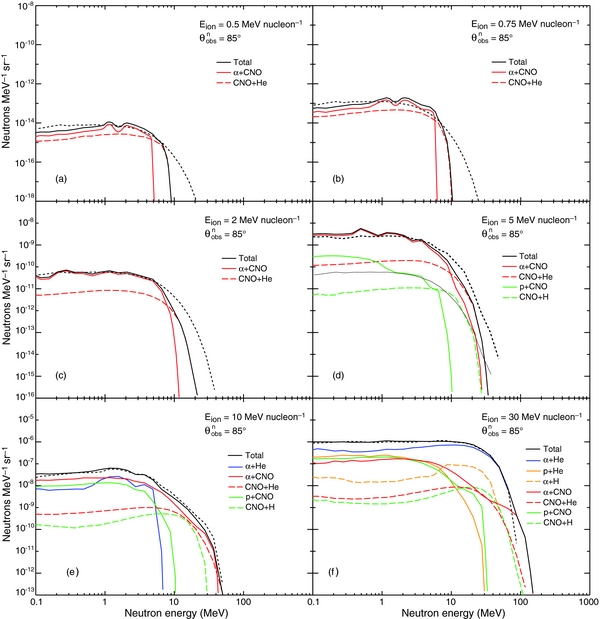
Figure 8. Calculated escaping-neutron spectra at the Sun from interactions of mono-energetic accelerated ions of 0.5, 0.75, 2, 5, 10, and 30 MeV nucleon−1 for a limb flare (θnobs = 85°). The spectra are normalized to one accelerated proton. Neutron spectra from the various contributing reactions are also shown. "CNO" refers to all nuclear species heavier than 4He. The dotted curves are the total neutron spectra calculated using the original Hua et al. (2002) procedure. Note that the pairs of panels ((a)–(b), (c)–(d), and (e)–(f)) have different y-axes.
Download figure:
Standard image High-resolution imagePanels (a) and (b) of Figures 7 and 8 show disk- and limb-flare escaping-neutron energy spectra calculated for ion energies of 0.5 and 0.75 MeV nucleon−1. Neutron production at these ion energies is primarily from interactions of accelerated α particles with the rare isotope 13C and the inverse reaction because all other reactions have effective threshold energies greater than ∼1 MeV nucleon−1. The 13C reaction is actually exothermic (see Table 3, which shows threshold energies for neutron production by proton and α-particle reactions with various isotopes), but the accelerated ions must still overcome the Coulomb barrier. As a result, the effective ion-energy threshold for neutron production by this reaction is ∼500 keV nucleon−1, lower than those for heavier isotopes with larger nuclear charge. Although the neutron-production cross section for this reaction is large due to the neutron excess of the nucleus, the isotopic fraction of 13C is only 1% and the neutron yield at these low ion energies is small compared with yields from higher-energy ions (see below).
Panels (a) and (b) of Figures 7 and 8 show that 0.5 and 0.75 MeV nucleon−1 accelerated α particles can produce neutrons with energies of almost 5 and 6 MeV, respectively. This is due to the large energy available for these reactions: the total energy of the accelerated α particle (2 and 3 MeV) combined with the additional energy available from the exothermic reaction (the 13C reaction has a nuclear-reaction Q value of +2.2 MeV). Neutron production from the accelerated α-particle reactions at these low-energies is fairly isotropic and occurs relatively high in the solar atmosphere so there is little difference of the escaping spectra from the two flare locations. The slight excesses at low energies seen in the spectra from the disk flare compared to the limb flare are due to scattering of downward-moving higher-energy neutrons into the upward direction with loss of their original energy.
The larger total energy of the accelerated heavy ion (∼6 and 9 MeV for 13C) associated with the inverse reaction with ambient 4He can result in neutrons with energies up to ∼10 MeV. However, for the downward-isotropic interacting-ion angular distribution resulting from no magnetic convergence, neutrons with energies greater than ∼7 MeV are not seen from disk flares (Figure 7). These higher-energy neutrons tend to be produced in the same direction as the interacting ions (i.e., into the downward hemisphere), and to escape the Sun must first be scattered upward with reduction of their energies from their initial values. These higher-energy neutrons can be seen from limb flares (Figure 8) produced by those ions moving tangentially to the solar surface.
Note that when expressed as energy per nucleon, proton and α-particle reactions with heavy ambient nuclei have the same production cross sections as their corresponding inverse reactions. However, in the thick-target loop model assumed here, nuclear reactions compete with Coulomb energy losses of the accelerated ions which are proportional to Z2/A (where Z is the ion charge and A is the number of ion nucleons). Therefore, even if the accelerated and ambient populations have the same heavy element to H and 4He abundance ratios, the nuclear-reaction yields of the inverse reactions are reduced relative to those of the proton and α-particle reactions, as can be seen in Figures 7 and 8. Z2/A for 13C is the smallest of all elements heavier than 4He that are relevant for neutron production, so at these low ion energies where the α + 13C reaction and its inverse dominate (panels (a) and (b)), the relative contribution of the inverse reaction is the largest. As will be seen below, at higher ion energies neutron production is dominated by reactions involving heavier isotopes with larger Z2/A, and the relative contribution of the inverse reactions is less.
The neutron spectra plotted in panels (a) and (b) of Figures 7 and 8 show structure at a few MeV due to the accelerated α-particle reactions. The structure results from the features present in the energy-dependent neutron-production cross sections at these energies as discussed in Section 2.3. This structure is smoothed out in the spectrum from the inverse reactions (dashed curve) due to the wider spread of neutron velocities resulting from the transformation from the center-of-momentum frame to the laboratory frame. Detection of this structure along with a lack of neutrons with energies greater than ∼10 MeV (or ∼7 MeV for a disk flare) would be a good indicator of ion acceleration only to energies less than ∼2 MeV nucleon−1. The dotted curve in the figure is the total neutron spectrum calculated using the original Hua et al. (2002) procedure. This spectrum exhibits no structure and extends to higher neutron energies due to an inaccurate procedure used by Hua et al. (2002) at low interaction energies.
Panels (c) of Figures 7 and 8 show disk- and limb-flare escaping-neutron energy spectra calculated for an ion energy of 2 MeV nucleon−1. Neutron production at this ion energy is primarily from interactions of accelerated α particles with the rare isotopes 25Mg, 26Mg, and 22Ne and their inverse reactions (see Table 3). The isotopic fractions for these isotopes are large (∼21% for the sum of the 25Mg and 26Mg isotopes) as are their neutron-production cross sections, again due to the neutron excesses of their nuclei. Their abundance-weighted cross sections can be as large as 100 mbarn at 2 MeV nucleon−1 (see Figure 1 of Hua et al. 2002), much larger than that of the α + 13C reaction. Z2/A for Mg is larger than for C so the relative contribution of the inverse reactions to total neutron production is less at this ion energy than at lower energies where neutron production is dominated by the 13C reaction. However, due to the larger total energies of the accelerated heavy ions, the inverse reactions dominate the production of neutrons with energies above ∼10 MeV. These high-energy neutrons can be seen from limb flares (Figure 8), but not from disk flares (Figure 7).
Because no proton reactions can contribute at this ion energy (see Table 3) and the inverse-reaction contribution to the total neutron production is less than 20%, the neutron yield depends almost directly on the α/proton ratio of the accelerated 2 MeV nucleon−1 ions. This ratio is seen to be energy dependent in SEPs (e.g., Mewaldt et al. 2005) and can be as large as 0.25 at 0.5 MeV nucleon−1. There is some structure in the spectrum at low neutron energies due to the accelerated α-particle reactions. Although at this ion energy the calculated spectrum is the sum of several reactions, the structures of their individual spectra are sufficiently similar that structure remains in the total neutron spectrum. The dotted curve in the figure is the total neutron spectrum calculated using the original Hua et al. (2002) procedure. Again, this spectrum exhibits no structure and extends to higher neutron energies due to an inaccurate procedure used by Hua et al. (2002) at low interaction energies.
Panels (d) of Figures 7 and 8 show disk- and limb-flare escaping-neutron spectra calculated for an ion energy of 5 MeV nucleon−1. Here, the main contributing reactions are again those of α particles with heavy elements and their inverse reactions, but at this higher ion energy all neutron-producing isotopic species are contributing, not just the rare isotopes as at 2 MeV nucleon−1 (see Table 3). Proton reactions and their inverse reactions are beginning to contribute but only with the rare, neutron-rich isotopes. The total spectrum again exhibits some structure due to the α-particle reactions. The difference between the neutron spectrum calculated using the new procedure and that calculated using the original Hua et al. (2002) procedure (dotted curve) is similar to that seen at 2 MeV nucleon−1.
Panels (e) of Figures 7 and 8 show disk- and limb-flare escaping-neutron spectra calculated for an ion energy of 10 MeV nucleon−1. While more of the reactions of accelerated protons with heavy isotopes and their inverse reactions are contributing, most of the neutron production is still from α-particle reactions with heavy elements, although no significant structure remains. The α + 4He reaction is beginning to contribute neutrons at a few MeV for the limb flare (Figure 8) but is significant for the disk flare only below ∼0.5 MeV (Figure 7). This is because in the center-of-momentum frame at projectile energies less than ∼15 MeV nucleon−1 the α + 4He reaction is peaked in the forward direction (see Hua et al. 2002), resulting in an approximately downward-isotropic neutron angular distribution requiring scattering to produce upward-directed neutrons for a disk flare. Limb flares can produce escaping neutrons with energies in excess of 40 MeV at this ion energy. The neutron spectrum calculated with the new procedure and that calculated with the original Hua et al. (2002) procedure (dotted curve) are very similar.
Panels (f) of Figures 7 and 8 show disk- and limb-flare escaping-neutron spectra calculated for an ion energy of 30 MeV nucleon−1. At this ion energy, all neutron-producing reactions are contributing except the p + H reaction (see Table 3). The α + 4He reaction is now the dominant contributor, and, because we did not change the procedure used for this reaction, there is essentially no difference between the spectrum calculated with the new procedure and that calculated with the original Hua et al. (2002) procedure (dotted curve). Limb flares can produce neutrons with energies in excess of 100 MeV at this ion energy.
The impulsive-event composition increases the level of the neutron spectrum from the inverse reactions shown in Figures 7 and 8 by about an order of magnitude, but the impact on the total neutron spectrum depends on the fraction such reactions contribute at each neutron energy. For the lowest ion energies (<2 MeV nucleon−1) at which these reactions make a significant contribution, this increases the total neutron spectrum also by about an order of magnitude for limb flares and somewhat less for disk flares. For higher ion energies up to 10 MeV nucleon−1, the increase to the total is less except at high neutron energies, where the inverse reactions can contribute such neutrons, especially for limb flares where the 10 MeV neutron yield is increased by about an order of magnitude for limb flares, less for disk flares. Above 20 MeV nucleon−1 the inverse reactions are less important and do not add significantly to the total neutron spectrum. At these energies, the 3He + H reaction becomes important, contributing additional ∼10 MeV neutrons and increasing the total neutron yield at those energies by about a factor of three for limb flares and somewhat less for disk flares.
Using calculated escaping-neutron spectra such as those of Figures 7 and 8, we can compare which reactions contribute to the >30 MeV neutrons observed at 1 AU with those contributing to the 1–10 MeV neutrons observable in the inner heliosphere. Figure 9 shows the fraction that each of the eight reaction types contributes to the total production of >30 MeV neutrons as a function of the mono-energetic ion energy. Panel (a) is for a disk flare (θnobs = 0°) and panel (b) is for a limb flare (θnobs = 85°). At the lowest ion energies, the only reactions capable of producing 30 MeV neutrons are the inverse reactions of heavy elements with ambient 4He. Only these reactions have sufficient total energy to do so, but minimum ion energies of ∼5 MeV nucleon−1 for limb flares and ∼15 MeV nucleon−1 for disk flares are required. The higher energy required for disk flares is because the scattering needed to produce the upward-escaping neutrons significantly reduces their energies from their initial values so higher initial energies are required. At higher ion energies, the reactions of accelerated α particles with heavy elements become important for a narrow band (20–40 MeV nucleon−1 for disk flares and 10–15 MeV nucleon−1 for limb flares). Above 40 MeV nucleon−1 for disk flares and 15 MeV nucleon−1 for limb flares, the α + 4He reaction is dominant up to ∼400 MeV nucleon−1 for disk flares and ∼40 MeV nucleon−1 for limb flares. Above these energies, the p + 4He reaction dominates for disk flares, but the inverse α + H reaction is dominant for limb flares. Neutrons from the latter reaction are too downward directed to be significantly scattered into the upward direction from disk flares. Only at the highest ion energies (>2 GeV nucleon−1 for limb flares and >700 MeV nucleon−1 for limb flares) is the p + H reaction significant. We find essentially no dependence of the contributing-reaction fractions on either loop convergence or PAS.
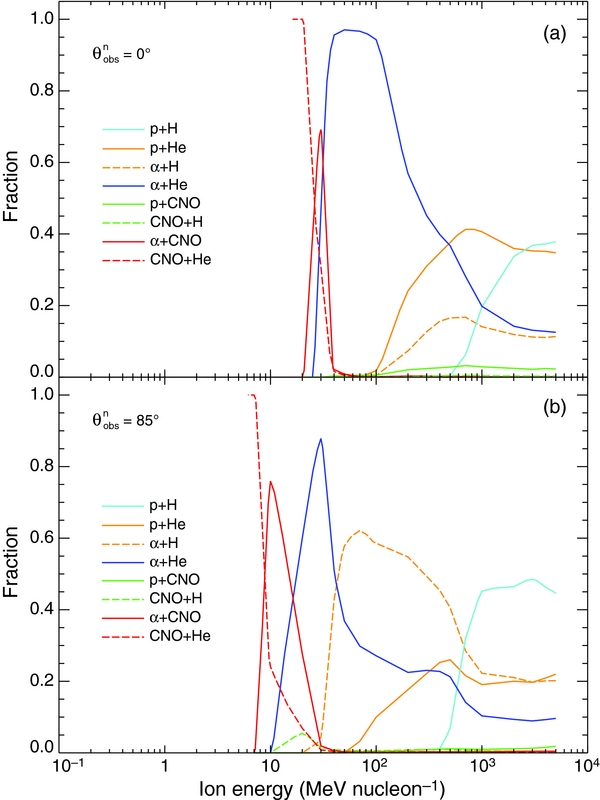
Figure 9. Fractions that the eight neutron-producing reaction types contribute to >30 MeV neutron production by mono-energetic ions as a function of ion energy for a disk flare (panel (a)) and for a limb flare (panel (b)). "CNO" refers to all nuclear species heavier than 4He.
Download figure:
Standard image High-resolution imageWhen the impulsive-event composition is assumed, for a disk flare the 3He + 4He reaction now accounts for about 50% of the >30 MeV neutron production for ion energies around 500 MeV nucleon−1. For a limb flare, the inverse reactions with ambient H now account for about 20% of the production for ion energies around 20 MeV nucleon−1 and the 3He + H reaction accounts for about 40% of the production for ion energies around 100 MeV nucleon−1.
When only 1–10 MeV neutrons are considered, the reaction fractions are different, as shown in panels (a) and (b) of Figure 10 for disk and limb flares, respectively, for the coronal composition. Because these low-energy neutrons are generally produced more isotropically and higher in the solar atmosphere, there is less dependence on flare location than for >30 MeV neutrons. At the lowest ion energies, 1–10 MeV neutrons are produced predominantly by accelerated α-particle reactions with heavy elements for both flare locations, not their inverse reactions as for >30 MeV neutrons, because the extra total energy of accelerated heavy ions tends to produce neutrons with energies greater than 10 MeV. Above ∼10 MeV nucleon−1 the α + 4He reaction dominates, and above ∼40 MeV nucleon−1 the p + 4He reaction dominates. Above ∼500 MeV nucleon−1, the p + H reaction contributes, and, for limb flares, proton reactions with heavy elements also contribute. The energies of ions capable of producing 1–10 MeV neutrons extend down to ∼0.5 MeV nucleon−1. We find essentially no dependence of the contributing-reaction fractions on either loop convergence or PAS.

Figure 10. Fractions that the eight neutron-producing reaction types contribute to 1–10 MeV neutron production by mono-energetic ions as a function of ion energy for a disk flare (a) and for a limb flare (b). "CNO" refers to all nuclear species heavier than 4He.
Download figure:
Standard image High-resolution imageWhen the impulsive-event composition is assumed, the contribution to 1–10 MeV neutron production from α-particle reactions with ambient heavy elements is reduced at ion energies less than ∼10 MeV nucleon−1 for a disk flare as the contribution from the inverse reactions of accelerated heavy elements with ambient 4He increase. These reactions now contribute more than 50% of the production for ion energies below 2 MeV nucleon−1 for disk flares and 80% of the production for ion energies below 10 MeV nucleon−1 for limb flares. Also for limb flares, the contribution of the α + 4He reaction at ion energies around 20 MeV nucleon−1 is reduced as contribution from the 3He + H and 3He + 4He reactions increase, now accounting for ∼70% of the production at these energies.
After escaping the solar atmosphere, neutron spectra such as those of Figures 7 and 8 begin to show the effect of attenuation due to neutron decay, increasing with increasing distance from the Sun. As an example, Figure 11 shows time-integrated neutron spectra at three distances D = 10 solar radii (Rs), 0.5 AU, and 1 AU (215 Rs) from mono-energetic 10 MeV nucleon−1 ion interactions for a disk flare. The spectra are normalized to one accelerated proton. The dramatic decrease of the low-energy neutron fluence with increasing distance to the detector is clearly seen, due to both the D2 factor and the smaller fraction of low-energy neutrons surviving to reach the detector.
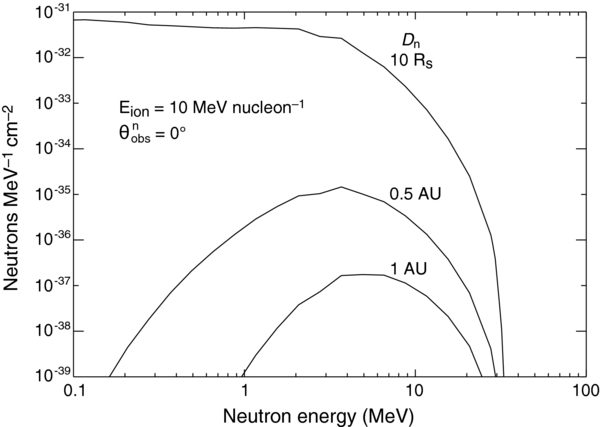
Figure 11. Time-integrated neutron spectra produced by interactions of mono-energetic 10 MeV nucleon−1 ions from a disk flare for a detector located at three distances from the Sun: 10 Rs, 0.5 AU, and 1 AU. The spectra are normalized to one accelerated proton.
Download figure:
Standard image High-resolution imageFigure 12 shows calculated fluences of 1–10 MeV neutrons for the coronal composition as a function of the ion kinetic energy for a neutron detector located at three distances from the Sun Dn = 10 Rs, 0.5 AU, and 1 AU for flares occurring at three heliocentric angles θnobs = 0°, 60°, and 85°. The fluences are normalized to one accelerated proton of the given ion energy and calculated for isotropic release of ions at the top of a loop with no convergence or PAS (δ = 0, λ → ∞), which results in a downward-isotropic interacting-ion angular distribution. The fluence increases rapidly up to ion energies of ∼50 MeV nucleon−1 because the reaction cross sections rise rapidly from their various threshold energies. The flattening above 50 MeV nucleon−1 is because at those energies most of the cross sections have reached their maxima and flatten with energy (see Figure 1 of Hua et al. 2002). For low-energy ions, 1–10 MeV neutrons are produced sufficiently isotropically and at sufficiently shallow depths to show little dependence on the flare heliocentric angle. Neutrons of energy 1–10 MeV from higher-energy ions are produced deep enough to show significant attenuation for limb flares. To calculate an actual 1–10 MeV neutron fluence at a neutron detector, the value from the curve at the detector distance should be multiplied by the number of mono-energetic accelerated protons of the given energy. Conversely, a measured fluence can be converted into the required number of accelerated protons by dividing it by the value on the curve.
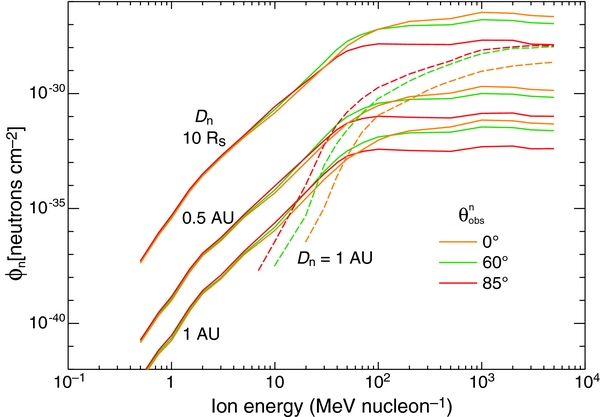
Figure 12. Neutron fluences from interactions of mono-energetic ions as a function of the ion energy for three flare locations: disk (θnobs = 0°), limb (θnobs = 85°), and θnobs = 60°. Solid curves: 1–10 MeV neutron fluence for a detector located at three distances Dn from the Sun: 10 Rs, 0.5 AU, and 1 AU. Dashed curves: >30 MeV neutron fluence for a detector located at Dn = 1 AU. The fluences are normalized to one proton of the given energy.
Download figure:
Standard image High-resolution imageWhen the impulsive-event composition is assumed, the 1–10 MeV neutron fluence from limb flares is increased by about a factor of five for ion energies less than 10 MeV nucleon−1. Above an ion energy of 10 MeV nucleon−1, the fluence is increased by about a factor of two, falling to less than a 50% increase by an ion energy of 50 MeV nucleon−1. For disk flares, the increase is about a factor of two below an ion energy of 2 MeV nucleon−1 and less than 50% for higher ion energies. We note that neutron production from the reactions of accelerated 3He with ambient heavy elements, which are not currently included in the code, would be significant only for ion energies less than ∼1 MeV nucleon−1, and then only if the accelerated 3He/4He ratio were as large as 1. If it were, the 1–10 MeV neutron and neutron-capture line yields from mono-energetic ions shown in Figures 12 and 14 would increase at most by a factor of ∼3.
In Figure 12 we also show the calculated fluence of >30 MeV neutrons for the coronal composition (dashed curves) at a neutron detector located at Dn = 1 AU for the three flare locations. We clearly see limb brightening for these higher-energy neutrons at all ion energies. The >30 MeV neutron fluence at 1 AU overwhelms the 1–10 MeV fluence at 1 AU for all ion energies greater than a few tens of MeV nucleon−1.
When the impulsive-event composition is assumed, the >30 MeV neutron fluence is increased by less than a factor of two for ion energies greater than ∼40 MeV nucleon−1. Below that energy, the fluence is increased by a factor of ∼15 for a disk flare and a factor of ∼30 for a limb flare as the inverse reactions of heavy elements with ambient 4He dominate production.
3.2.2. Neutron-capture Line Resulting from Low-energy, Mono-energetic Ions
Figure 13 shows the fraction that each of the eight reaction types contributes to the production of the 2.223 MeV neutron-capture line as a function of the mono-energetic ion energy. Panel (a) is for a disk flare (θnobs = 0°) and panel (b) is for a limb flare (θnobs = 85°). Comparing these distributions with those for 1–10 MeV neutron production shown in Figure 10, we see that they are very similar, with only minor differences. This similarity is because the energies of the captured neutrons producing the bulk of the capture-line photons that actually escape the solar atmosphere without scattering are near 10 MeV. Higher-energy neutrons tend to be captured too deep and the capture photons suffer too much attenuation. Lower-energy neutrons tend to decay in the solar atmosphere without being captured. For disk flares, at higher ion energies the contribution of the α + 4He reaction is larger than for 1–10 MeV neutron production because the more downward-directed angular distribution of neutrons from these reactions results in more captures and less escaping neutrons. When the impulsive-event composition is assumed, the change to the reaction fractions contributing to neutron-capture line production is the same as that for 1–10 MeV neutrons discussed above.
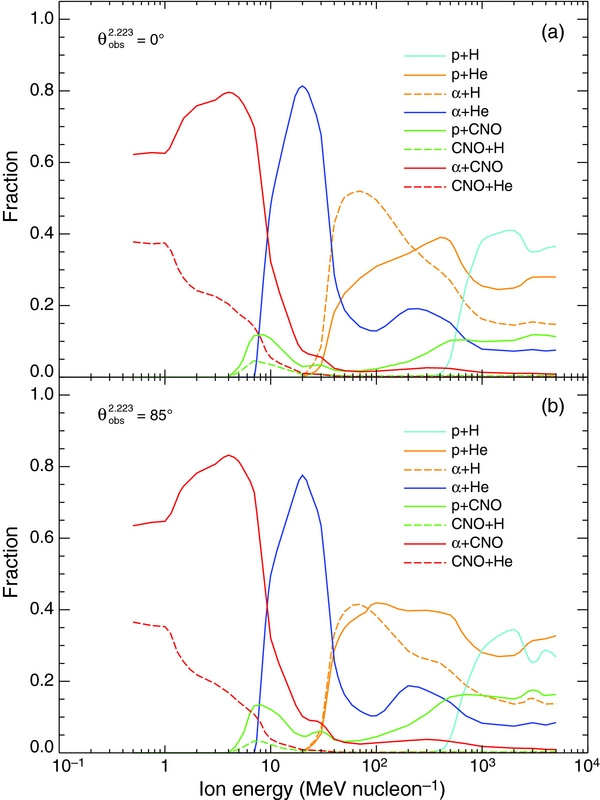
Figure 13. Fractions that the eight neutron-producing reaction types contribute to the neutron-capture line production by mono-energetic ions as a function of ion energy for a disk flare (a) and for a limb flare (b). "CNO" refers to all nuclear species heavier than 4He.
Download figure:
Standard image High-resolution imageFigure 14 shows calculated fluences of the 2.223 MeV neutron-capture line, ϕ2.223, as a function of ion kinetic energy for a gamma-ray detector located at 1 AU for flares occurring at three heliocentric angles θ2.223obs = 0°, 60°, and 85°. The fluences are normalized to one accelerated proton of the given ion energy and calculated for isotropic release of ions at the top of a loop with no convergence or PAS (δ = 0, λ → ∞), which results in a downward-isotropic interacting-ion angular distribution. Similar to the neutron fluence, there is significantly more line attenuation for limb flares from higher-energy ions because the neutrons from these higher-energy ion interactions are captured deeper in the photosphere. To calculate an actual capture-line fluence at the detector, the value from the curve should be multiplied by the number of mono-energetic accelerated protons of the given energy. Line fluences at gamma-ray detectors located at other distances to the Sun can be calculated by adjusting the value from the curves by the appropriate D2 factor.
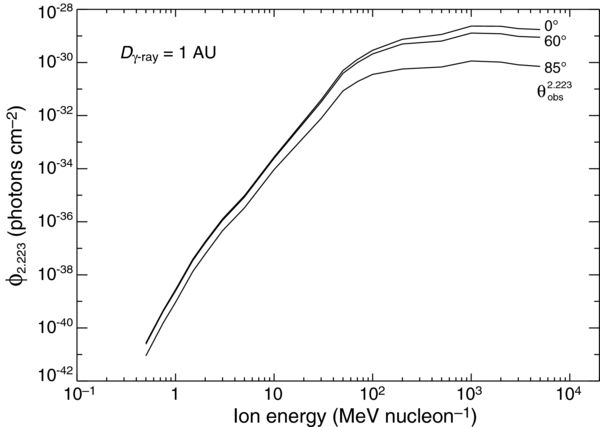
Figure 14. Neutron-capture line fluence from interactions of mono-energetic ions as a function of the ion energy for a detector located at 1 AU. The fluences are shown for three flare locations: disk (θ2.223obs = 0°), limb (θ2.223obs = 85°), and θ2.223obs = 60°. The fluences are normalized to one proton of the given energy.
Download figure:
Standard image High-resolution imageWhen the impulsive-event composition is assumed, the neutron-capture line fluence is increased by about a factor of five for ion energies less than 10 MeV nucleon−1 at all flare locations. Above an ion energy of 10 MeV nucleon−1, the fluence is increased by about a factor of two, falling to less than a 50% increase by an ion energy of 100 MeV nucleon−1.
3.3. Neutron Spectra and the Neutron-capture Line Resulting from Power-law Accelerated-ion Spectra
We now calculate neutron spectra (Section 3.3.1) and neutron-capture line fluences (Section 3.3.2) resulting from interactions of accelerated ions having a distribution of kinetic energies: a power-law spectrum differential in ion energy with spectral index s. To do this we combine the neutron spectra and capture-line yields of Section 3.2 calculated for mono-energetic accelerated ions, appropriately weighted by the ion kinetic-energy distribution for a given index s. This will allow us to explore the dependence of neutron and capture-line production on accelerated-ion energy for these power-law distributions, and we discuss what ranges of ion energies are responsible for neutron and neutron-capture line production in Section 3.3.3. Note that these calculations and figures are for an assumed coronal accelerated-ion composition. Where appropriate, we will note the impact of assuming the impulsive-event composition and also the impact of using the power-law with exponential roll-over ion spectrum.
3.3.1. Neutron Spectra Resulting from Accelerated-power-law Ion Spectra
Shown in Figures 15–17 are neutron kinetic-energy spectra from a disk flare (θnobs = 0°) for accelerated-ion spectra with power-law indexes s of 2, 4, and 6, respectively. These indexes span the range derived for flares from previous analyses of flare data (e.g., Ramaty et al. (1996) found that ∼95% of the gamma-ray line-producing flares observed with the SMM gamma-ray detector had power-law spectral indexes between 3 and 6). These are escaping-neutron spectra at the Sun (i.e., just after transport through the solar atmosphere but before any modification due to neutron decay). Shown in Figures 18–20 are the corresponding neutron spectra calculated for a limb flare (θnobs = 85°). All of the neutron spectra are normalized to one accelerated proton with energy greater than 30 MeV (i.e., Np(> 30 MeV) = 1) and calculated for isotropic release of ions at the top of a loop with no convergence or PAS (δ = 0, λ → ∞), which results in a downward-isotropic interacting-ion angular distribution. The solid black curves are the total spectra, and the colored curves are spectra from the eight contributing reaction types. The solid colored curves are for accelerated proton and α-particle reactions with ambient material and the dashed colored curves are the inverse reactions of heavy accelerated ions interacting with ambient H and 4He. We discuss these spectra below, demonstrating how the contributions from the various neutron-producing reactions change as the accelerated-ion spectrum and the flare heliocentric angle change.
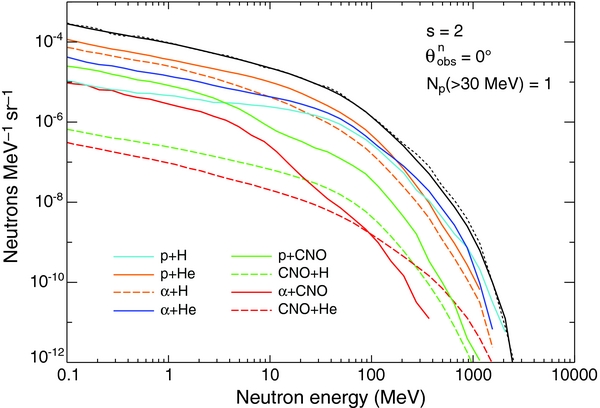
Figure 15. Calculated neutron spectrum at the Sun from interactions of accelerated ions with a power-law kinetic-energy spectrum having an index s = 2 for a disk flare. The contributions from the various reactions are also shown. "CNO" refers to all nuclear species heavier than 4He. The dotted curve is the total neutron spectrum calculated using the original Hua et al. (2002) procedure.
Download figure:
Standard image High-resolution imageFor neutron spectra from the hardest ion spectrum (s = 2, Figures 15 and 18), neutron production is dominated by the p + H, p + 4He, and α + H reactions at all neutron energies and for both flare locations. Since we did not change the code procedures for these reactions, the neutron spectra are very similar to those calculated using the original Hua et al. (2002) procedures (the dotted curves in the figures). At high neutron energies, the fluence is larger for a limb flare; i.e., there is limb brightening of high-energy neutrons for the downward-isotropic interacting-ion angular distribution resulting from assuming no magnetic convergence. At low neutron energies, the fluence is larger for the disk flare; the excess at low energies is due to scattering of downward-moving higher-energy neutrons into the upward direction with loss of their original energy. Thus, for this angular distribution, there is limb darkening of low-energy neutrons.
For neutron spectra from the s = 4 ion spectrum (Figures 16 and 19), neutron production at high neutron energies is again dominated by reactions whose procedures have not been changed, and the spectra are very similar to those calculated using the original Hua et al. (2002) procedures (the dotted curves in the figures) at both flare locations. For the limb flare (Figure 19) at low neutron energies (less than about 5 MeV), α-particle reactions with heavy targets contribute significantly. The low-energy structure in the neutron-production cross sections for these heavy-element reactions calculated using the new procedure can be seen in the calculated neutron spectra and produces a small change in the total spectrum for the limb flare (compare with the dotted curve). For the disk flare, the contribution of this reaction to low-energy neutron production is less since the neutrons are produced more in the downward direction and their escape is less likely.

Figure 16. Calculated neutron spectrum at the Sun from interactions of accelerated ions with a power-law kinetic-energy spectrum having an index s = 4 for a disk flare. The contributions from the various reactions are also shown. "CNO" refers to all nuclear species heavier than 4He. The dotted curve is the total neutron spectrum calculated using the original Hua et al. (2002) procedure.
Download figure:
Standard image High-resolution imageFor neutron spectra from the steepest ion spectrum (s = 6, Figures 17 and 20), neutron production at high neutron energies is again dominated by the α + 4He and α + H reactions, and the spectra are very similar to those calculated using the original Hua et al. (2002) procedure (dotted curves). At neutron energies below about 10 MeV, neutron production is dominated (by more than a order of magnitude) by α-particle reactions with heavy targets for both flare locations. The revised procedures for calculating the cross sections for these reactions result in structure in the total neutron spectra at these energies; the spectra look similar to those from mono-energetic ions at 5 MeV nucleon−1 shown in Figures 7 and 8. Neutron detectors with good instrument resolution at low neutron energies may be able to resolve this structure.
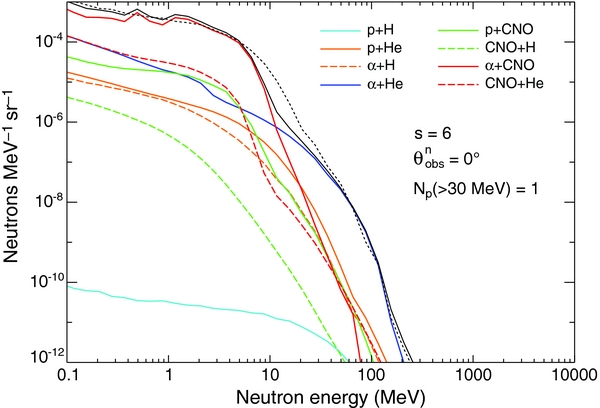
Figure 17. Calculated neutron spectrum at the Sun from interactions of accelerated ions with a power-law kinetic-energy spectrum having an index s = 6 for a disk flare. The contributions from the various reactions are also shown. "CNO" refers to all nuclear species heavier than 4He. The dotted curve is the total neutron spectrum calculated using the original Hua et al. (2002) procedure.
Download figure:
Standard image High-resolution image
Figure 18. Calculated neutron spectrum at the Sun from interactions of accelerated ions with a power-law kinetic-energy spectrum having an index s = 2 for a limb flare. The contributions from the various reactions are also shown. "CNO" refers to all nuclear species heavier than 4He. The dotted curve is the total neutron spectrum calculated using the original Hua et al. (2002) procedure.
Download figure:
Standard image High-resolution image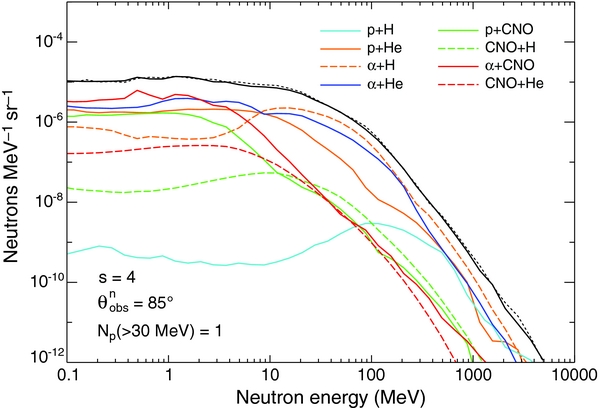
Figure 19. Calculated neutron spectrum at the Sun from interactions of accelerated ions with a power-law kinetic-energy spectrum having an index s = 4 for a limb flare. The contributions from the various reactions are also shown. "CNO" refers to all nuclear species heavier than 4He. The dotted curve is the total neutron spectrum calculated using the original Hua et al. (2002) procedure.
Download figure:
Standard image High-resolution image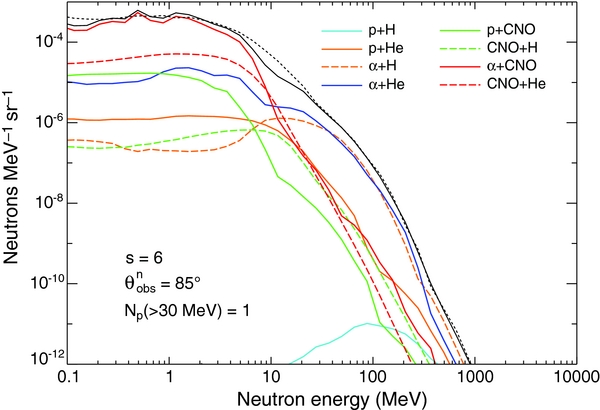
Figure 20. Calculated neutron spectrum at the Sun from interactions of accelerated ions with a power-law kinetic-energy spectrum having an index s = 6 for a limb flare. The contributions from the various reactions are also shown. "CNO" refers to all nuclear species heavier than 4He. The dotted curve is the total neutron spectrum calculated using the original Hua et al. (2002) procedure.
Download figure:
Standard image High-resolution imageWhen the impulsive-event composition is assumed, for steep ion spectra the inverse reactions of heavy elements with 4He produce more low-energy (<30 MeV) neutrons, increasing the yield of <5 MeV neutrons by a factor of 2–3 for limb flares but less than a factor of two for disk flares. For hard ion spectra, the inverse heavy reactions do not add significantly to the neutron yield. For these ion spectra, the 3He + H reaction increases the >100 MeV yield by about 50% for limb flares and the 3He + 4He reaction contributes >100 MeV neutrons, increasing the 1 GeV neutron yield by almost an order of magnitude.
When the ion spectrum is assumed to be a power law with exponential roll-over, the effect on the neutron spectrum as E0 decreases from large values is a reduction at all neutron energies. For steep ion spectra, the reduction is most significant at neutron energies >10 MeV, steepening the spectrum. For hard ion spectra the reduction is significant at all neutron energies because for these spectra, many low-energy neutrons are produced by interactions of high-energy ions (see the discussion of contributing ion energy ranges below). The reduction is more significant at high neutron energies, again resulting in a steepening of the neutron spectrum.
Using calculated escaping-neutron spectra for the coronal composition such as those of Figures 15–20, we can compare which reactions contribute to the >30 MeV neutrons observed at 1 AU with those contributing to the 1–10 MeV neutrons observable in the inner heliosphere. Figure 21 shows the fractions that the various reactions contribute to the production of >30 MeV neutrons as a function of ion spectral index s. Panel (a) is for a disk flare (θnobs = 0°) and panel (b) is for a limb flare (θnobs = 85°). For disk flares at most spectral indexes, only the α + 4He reaction produces these higher-energy neutrons sufficiently isotropically that they can easily escape into the upward direction for the downward-isotropic interacting-ion angular distribution resulting from no magnetic convergence. For the hardest spectra, the p + 4He also contributes. For the limb flare, the α + H and the α + 4He reactions dominate >30 MeV neutron production at all spectral indexes. We find essentially no dependence of the contributing-reaction fractions on either loop convergence or PAS.

Figure 21. Fractions of the various neutron-producing reactions contributing to the production of >30 MeV neutrons as a function of the accelerated-ion spectral index for a disk flare (a) and for a limb flare (b). "CNO" refers to all nuclear species heavier than 4He.
Download figure:
Standard image High-resolution imageBecause >30 MeV neutron production is dominated by the α + 4He and α + H reactions, the increased heavy-element abundances of the impulsive-event composition do not significantly change the reaction fractions contributing to these neutrons. However, >30 MeV neutron production from accelerated 3He reactions is now significant. For a disk flare, the 3He + 4He reaction is isotropic enough to produce these higher-energy neutrons in the upward direction, sharing neutron production with the α +4He reaction almost equally for ion indexes steeper than about 2. For a limb flare, the 3He + H reaction now shares equally with the α + 4He and α + H reactions at all ion spectral indexes.
When the ion spectrum is assumed to be a power law with exponential roll-over, the relative contribution to >30 MeV neutron production by the α + 4He reaction for hard ion spectra increases as E0 decreases from large values. For disk flares, for E0 < 100 MeV, >30 MeV neutron production is dominated by this reaction for all ion spectral indexes. For limb flares, this reaction is comparable to the α + H reaction for hard ion spectra when E0 is less than 50 MeV nucleon−1.
Panels (a) and (b) of Figure 22 show reaction contribution fractions for the production of 1–10 MeV neutrons from a disk and a limb flare for the coronal composition, respectively. Again, there is little difference between the two flare locations because these low-energy neutrons tend to be produced more isotropically and higher in the solar atmosphere. The fractions of the inverse reactions of accelerated heavy ions interacting with ambient H and 4He and the accelerated α-particle reaction with ambient H are increased somewhat for the limb flare because the large velocity of the center of momentum of these reactions results in a neutron angular distribution similar to the downward-isotropic interacting-ion distribution and subsequent limb brightening for these reactions. The reaction fractions for 1–10 MeV neutrons are very different from those for >30 MeV neutrons. For spectra steeper than s ∼ 5, α-particle reactions with ambient heavy elements now dominate with some contribution from the corresponding inverse reactions for the limb flare. The α + 4He reaction contributes significantly only for indexes near s = 4–5. For spectra harder than s ∼ 4, the p + 4He reaction dominates for both flare locations. We find essentially no dependence of the contributing-reaction fractions on either loop convergence or PAS.

Figure 22. Fractions of the various neutron-producing reactions contributing to the production of 1–10 MeV neutrons as a function of the accelerated-ion spectral index for a disk flare (a) and for a limb flare (b). "CNO" refers to all nuclear species heavier than 4He.
Download figure:
Standard image High-resolution imageFor the impulsive-event composition, the inverse-reaction contribution to 1–10 MeV neutron production increases for ion spectral indexes steeper than 4. For limb flares, these inverse reactions dominate line production because the neutrons can more easily escape, accounting for >80% of the production for s > 6. For disk flares the inverse-reaction contribution becomes only approximately equally to that of the α-particle reactions with ambient heavy elements. For hard spectra there is some additional contribution from the 3He + H reaction.
When the ion spectrum is assumed to be a power law with exponential roll-over, the impact on the reaction contribution fractions is similar for both flare locations. For steep ion spectra there is essentially no change in the reaction fractions as E0 is decreased from large values. For hard ion spectra, as E0 decreases, the contribution of the α + 4He reaction (threshold energy of ∼10 MeV nucleon−1) increases at the expense of the p + 4He reaction (threshold energy of ∼25 MeV nucleon−1). For E0 < 30 MeV nucleon−1 the α + 4He reaction dominates.
After escaping the solar atmosphere, neutron spectra such as those of Figures 15–20 begin to suffer attenuation due to neutron decay, increasing with increasing distance from the Sun. As an example, Figure 23 shows the resulting neutron spectra at three distances D = 10 Rs, 0.5 AU, and 1 AU from accelerated ions with spectral index s = 4 for a disk flare. The dramatic decrease of the low-energy neutron fluence with increasing distance to the detector is clearly seen, due to both the D2 factor and the smaller fraction of low-energy neutrons surviving to reach the detector.
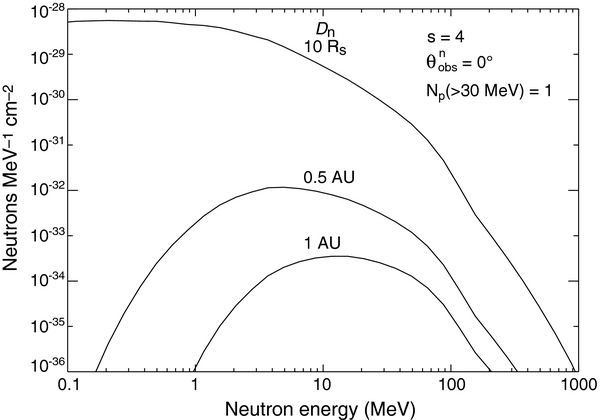
Figure 23. Time-integrated neutron spectra produced by interactions of accelerated ions with a spectral index s = 4 from a disk flare for a detector located at three distances from the Sun: 10 Rs, 0.5 AU, and 1 AU.
Download figure:
Standard image High-resolution imageFigure 24 shows the calculated fluence of 1–10 MeV neutrons (solid curves) as a function of the ion spectral index s for a neutron detector located at three distances from the Sun Dn = 10 Rs, 0.5 AU, and 1 AU for flares occurring at three heliocentric angles θnobs = 0°, 60°, and 85°. The fluences are normalized to Np(> 30 MeV) = 1 and calculated for isotropic release of ions at the top of a loop with no convergence or PAS (δ = 0, λ → ∞), which results in a downward-isotropic interacting-ion angular distribution. At all detector distances, we see very minor limb brightening from ion spectra steeper than s ∼ 5 for this angular distribution of interacting ions; the neutrons are produced at sufficiently shallow depths in the atmosphere such that attenuation at the limb is not significant. Neutrons of energy 1–10 MeV from harder ion spectra are produced deep enough to show significant limb darkening. The dramatic increase of the 1–10 MeV neutron fluence with decreasing distance to the detector is again clearly seen. To calculate an actual neutron fluence at the detector, the value from the curve should be multiplied by the number of accelerated protons with energy greater than 30 MeV.

Figure 24. Neutron fluences as a function of the ion spectral index for three flare locations: disk (θnobs = 0°), limb (θnobs = 85°), and θnobs = 60°. Solid curves: 1–10 MeV neutron fluence for a detector located at three distances Dn from the Sun: 10 Rs, 0.5 AU, and 1 AU. Dashed curves: >30 MeV neutron fluence for a detector located at Dn = 1 AU.
Download figure:
Standard image High-resolution imageFor the impulsive-event composition, the 1–10 MeV neutron yield is increased for all ion spectral indexes. For a disk flare, the yield is increased from about 30% for an ion spectral index s = 2 to a factor of ∼2 for s > 6. For limb flares, the impact of the additional inverse reactions for steep ion spectra is greater because the neutrons can more easily escape; the 1–10 MeV neutron yield increases from about 30% for an ion spectral index s = 2 to a factor of 5–6 for s > 6. We note that neutron production from the reactions of accelerated 3He with ambient heavy elements, which are not currently included in the code, would be significant only for ion energies less than ∼1 MeV nucleon−1, and then only if the accelerated 3He/4He ratio were as large as 1. If it were, the 1–10 MeV neutron and neutron-capture line yields for power-law spectra shown in Figures 24 and 26 would increase at most by a factor of ∼3.
The 1–10 MeV neutron yield is reduced when the ion spectrum is assumed to be a power law with exponential roll-over. For steep ion spectra (s > 6), the yield is reduced by less than 5% at both flare locations for E0 = 100 MeV nucleon−1. But for hard ion spectra (s = 2), the yield for E0 = 100 MeV nucleon−1 is only 20% of that without roll-over for a disk flare and 40% for a limb flare.
In Figure 24 we also show the calculated fluence of >30 MeV neutrons for the coronal composition (dashed curves) at a neutron detector located at Dn = 1 AU for the three flare locations. We clearly see limb brightening for these higher-energy neutrons at all ion spectral indexes, although it is relatively less for hard spectra because of the increased scattering losses due to deeper production that even these higher-energy neutrons suffer. For limb flares, the >30 MeV neutron fluence at 1 AU overwhelms the 1–10 MeV fluence at 1 AU for all ion spectral indexes harder than s = 6, an index steeper than those measured for typical flares. But for steeper ion spectra, the neutron spectra are so steep that the 1–10 MeV neutrons dominate regardless of losses due to neutron decay. For disk flares, however, the reduction of upward-escaping high-energy neutrons is so great that only for ion spectra harder than s ∼ 4.5 does the >30 MeV neutron fluence actually dominate. For a typical flare index of s = 4 and θnobs = 60°, at 1 AU the 1–10 MeV neutron fluence is ∼7% of the >30 MeV neutron fluence.
The increase of the >30 MeV neutron yield due to the impulsive-event composition is not dramatic. For the limb flare, the increase is about 50% for an ion spectral index of 2, increasing monotonically to a little more than a factor of two for s = 8. The increase for a disk flare is similar, maximizing at about a factor of two for an ion index of about 3.
Because they are made by higher-energy ions, the reduction of the >30 MeV neutron yield when the ion spectrum is assumed to be a power law with exponential roll-over is larger than that of the 1–10 MeV neutrons, especially for hard ion spectra. For E0 = 100 MeV nucleon−1 and an ion spectral index of 2, the >30 MeV neutron yield is reduced by about a factor of 30 for a disk flare and 15 for a limb flare. For a steep index of 6 and E0 = 100 MeV nucleon−1, the yield is reduced by about a factor of two for both flare locations.
3.3.2. Neutron-capture Line Resulting from Power-law Accelerated-ion Spectra
Figure 25 shows the fraction that each of the eight reaction types contributes to the production of the 2.223 MeV neutron-capture line for the coronal composition as a function of the ion spectral index s. Panel (a) is for a disk flare (θnobs = 0°) and panel (b) is for a limb flare (θnobs = 85°). The fractions for the two flare locations are very similar, with the α + H reaction, which is significant only for harder spectra, being somewhat larger for the disk flare.
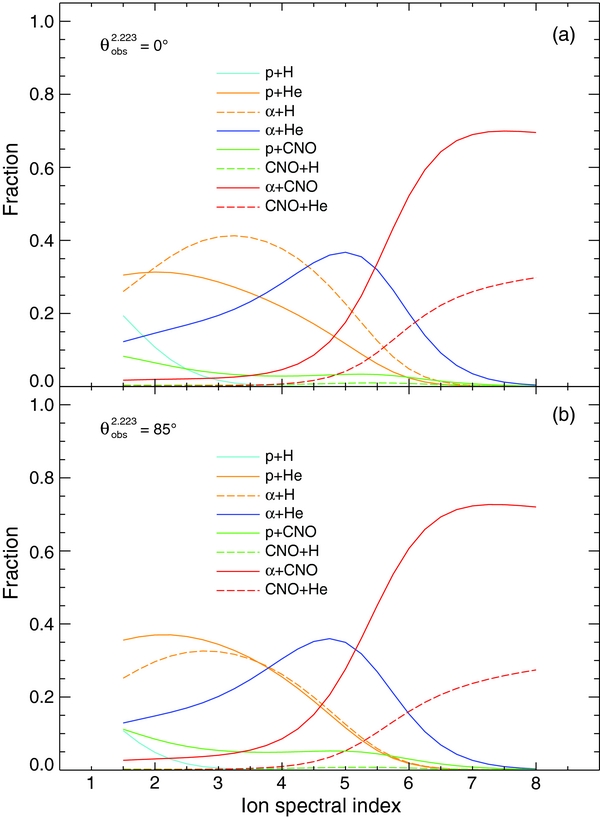
Figure 25. Fractions of the various neutron-producing reactions contributing to the production of the neutron-capture line as a function of the accelerated-ion spectral index for a disk flare (a) and for a limb flare (b). "CNO" refers to all nuclear species heavier than 4He.
Download figure:
Standard image High-resolution imageThe neutron-capture line reaction fractions shown in Figure 25 are similar to those for 1–10 MeV neutron production shown in Figure 22. This is because the energies of the captured neutrons producing the bulk of the capture-line photons that actually escape the solar atmosphere without scattering are near 10 MeV. As noted above, higher-energy neutrons tend to be captured too deep and the capture photons suffer too much attenuation. Lower-energy neutrons tend to decay in the solar atmosphere without being captured. The most significant differences between the capture-line and 1–10 MeV neutron-production fractions are for disk flares. For harder spectra, the contribution of the α + H reaction is larger for neutron-capture line production, and for steeper spectra, the contribution of the inverse reactions of accelerated heavy elements on ambient 4He is larger. The angular distributions of neutrons from these reactions are more downward directed so their contribution to escaping neutrons is less.
The impact on the neutron-capture line reaction fractions of assuming the impulsive-event composition is similar to that for the 1–10 MeV neutrons but with less dependence on flare location. For both flare locations, the impulsive-event composition causes the reaction fractions of the α + heavy ambient elements and their inverse reactions to switch roles, with the latter reactions now dominating capture-line production for ion power-law indexes steeper than ∼5. For harder ion spectra, the increased abundance of 3He causes the 3He + H reaction to contribute up to ∼25% for ion spectral indexes from 2 to 4.
When the ion spectrum is assumed to be a power law with exponential roll-over, the impact on the reaction contribution fractions is similar for both flare locations. For steep ion spectra, there is essentially no change in the reaction fractions as E0 is decreased from large values. For hard ion spectra, as E0 decreases, the contribution of the α + 4He reaction increases at the expense of the p + 4He reaction. For E0 < 30 MeV nucleon−1, the α + 4He reaction dominates.
Figure 26 shows the calculated fluence of the 2.223 MeV neutron-capture line for coronal abundances, ϕ2.223, as a function of the ion spectral index s for a gamma-ray detector located at 1 AU for flares occurring at three heliocentric angles (θ2.223obs = 0°, 60°, and 85°). The fluences are again normalized to Np(> 30 MeV) = 1 and calculated for isotropic release of ions at the top of a loop with no convergence or PAS (δ = 0, λ → ∞), which results in a downward-isotropic interacting-ion angular distribution. Unlike the 1–10 MeV neutron fluence, the capture line is limb darkened at all ion spectral indexes, and there is significantly more limb darkening from harder spectra because neutron captures from higher-energy ion interactions occur deeper in the photosphere. To calculate an actual capture line fluence at the detector, the value from the curve should be multiplied by the number of accelerated protons with energy greater than 30 MeV. Line fluences at other distances to the gamma-ray detector can be calculated by adjusting the values from the curves by the appropriate D2 factor. Note that the curves of Figure 26 differ from those given in Figure 13 of Murphy et al. (2007) for δ = 0 and no PAS due to the different accelerated-ion compositions assumed.
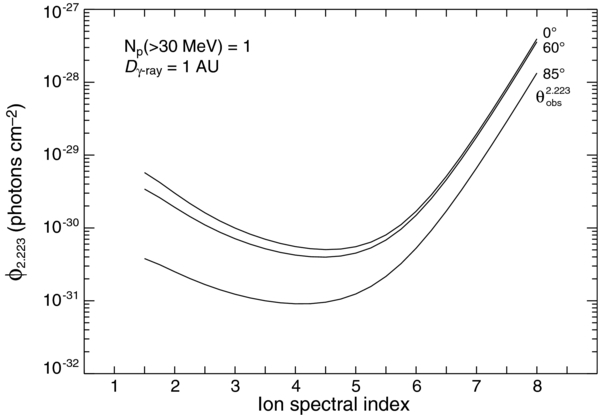
Figure 26. Neutron-capture line fluence as a function of the ion spectral index for a detector located at Dγ-ray = 1 AU. The fluences are shown for three flare locations: disk (θ2.223obs = 0°), limb (θ2.223obs = 85°), and θ2.223obs = 60°.
Download figure:
Standard image High-resolution imageFor both flare locations, assuming the impulsive-event composition causes the capture-line yield to increase monotonically as the ion spectrum steepens; by about 30% for s = 2 to a maximum of a factor of 5–6 at s = 8.
When the ion spectrum is assumed to be a power law with exponential roll-over, the neutron-capture line fluence is reduced for all ion spectral indexes, with the most effect for hard spectra. For a disk flare and E0 = 100 MeV nucleon−1, the reduction is a factor of six for an ion spectral index s = 2 but only by 10% for an index of 6. For a limb flare and E0 = 100 MeV nucleon−1, the reduction is a factor of five for s = 2, but only by 5% for s = 6.
The neutron-capture line fluence curves of Figure 26 exhibit a minimum around spectral indexes of ∼4.5, with greater yields from both steeper and harder spectra. This specific shape is due to the (arbitrary) choice of normalizing the accelerated-proton spectrum to have unit integral above 30 MeV. Other choices of normalization would modify the shape. Note that the 1–10 MeV neutron fluence curves of Figure 24 would be more like those of the capture line if the fluence of neutrons of all energies were considered (see Figure 13 of Murphy et al. 2007). Restricting consideration to 1–10 MeV neutrons reduces their relative yields from hard spectra as neutrons tend to be produced with energies above 10 MeV and low-energy neutrons are more easily scattered, especially for limb flares.
Compton scattering of 2.223 MeV line photons in the solar atmosphere reduces their energy and the residual photons form a continuum of emission at energies less than 2.223 MeV. For an accelerated-ion spectral index s = 4, Figure 27 shows the spectrum of this emission (including the line itself) from a disk flare (θ2.223obs = 0°) and a limb flare (θ2.223obs = 85°). The spectra have been normalized to have the same yield in the line. At photon energies near the line (greater than ∼1 MeV), the limb flare produces more scattered continuum relative to the line than the disk flare since the path length traveled by the photons is greater. This is also true at lower photon energies but the Compton-scattering cross section at low energies is so strong that many of these residual photons cannot escape from the limb flare, and the resulting relative continuum escaping the solar atmosphere is in fact less than for the disk flare. This general behavior of the scattered-continuum spectrum holds for all ion spectral indexes.
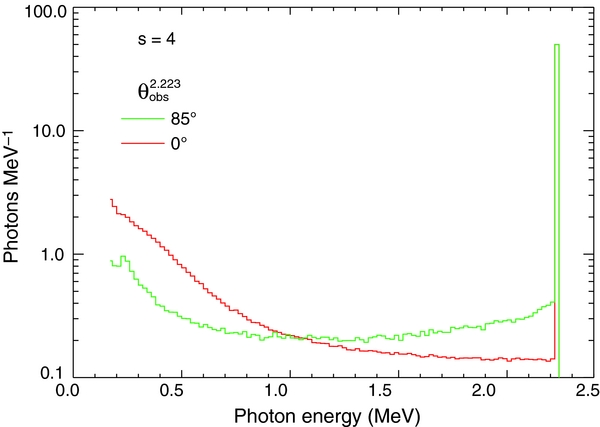
Figure 27. Photon spectrum of the Compton-scattered neutron-capture line continuum and the capture line for an accelerated-ion spectral index of 4 from a disk flare and a limb flare. The spectra have been normalized to have the same yield in the line.
Download figure:
Standard image High-resolution imageThe ratio of the yield in the scattered continuum to that of the line is a strong function of both the location of the flare on the disk and the accelerated-ion spectral index. The detailed behavior of the ratio depends on the definition of the energy range used to calculate the scattered-continuum yield. Figure 28 shows this ratio as a function of the accelerated-ion spectral index s for three flare heliocentric angles (θ2.223obs = 0°, 60°, and 85°) and for two definitions of the energy range (>200 keV and >1 MeV). For both definitions, the ratio increases for harder spectra (smaller s) because the deeper captures associated with harder spectra always produce more scattered continuum relative to the line. When the continuum definition is >1 MeV, the ratio increases as the flare location nears the limb because there is more escaping scattered continuum in this energy range relative to the line for limb flares (see Figure 27). But when the definition is >200 keV, the limb flare produces less escaping continuum relative to the line than the disk flare because of the strong attenuation of the <1 MeV photons (see Figure 27).
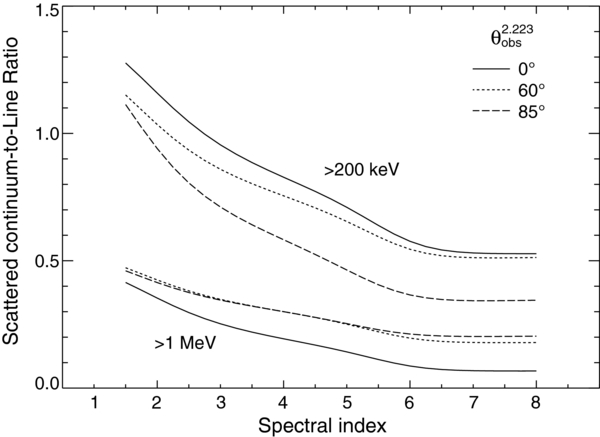
Figure 28. Ratio of the yield in the Compton-scattered continuum to that of the line as a function of the accelerated-ion spectral index s for two definitions of the continuum energy range (>200 keV and >1 MeV) and for three flare locations: disk (θnobs = 0°), limb (θnobs = 85°), and θnobs = 60°.
Download figure:
Standard image High-resolution image3.3.3. Accelerated-ion Energy Ranges Responsible for Neutron and Neutron-capture Line Production from Power-law Accelerated-ion Spectra
An important question to ask is what accelerated-ion energy ranges are responsible for neutron and neutron-capture line production? For 1–10 MeV neutron production, Figure 29 shows the fractions that ions with energies in four energy windows (0–1, 1–10, 10–30, and >30 MeV nucleon−1) contribute as a function of ion spectral index from a disk flare (θnobs = 0°) for a neutron detector located at 10 Rs (solid curves) and 1 AU (dashed curves). For ion spectra with indexes steeper than ∼5.5, 1–10 MeV neutrons are produced almost exclusively by 1–10 MeV nucleon−1 ions. For ion spectra with indexes harder than ∼4.5, 1–10 MeV neutrons are produced almost exclusively by ions with energies >30 MeV nucleon−1. For a narrow range of indexes near s = 5, 1–10 MeV neutrons are produced almost equally by ions from the three >1 MeV nucleon−1 energy windows. While ions with energies less than 1 MeV nucleon−1 are capable of producing neutrons with energies greater than 1 MeV, they never contribute significantly because the neutron-production cross sections of higher-energy ions are so much larger that these ions always dominate even 1–10 MeV neutron production. We find essentially no dependence of the contributing-ion-energy fractions on either loop convergence or PAS.

Figure 29. Fractions that ions with energies in four energy windows (0–1, 1–10, 10–30, and >30 MeV nucleon−1) contribute to 1–10 MeV neutron production as a function of ion spectral index for a disk flare and a neutron detector located at 10 Rs (solid) and 1 AU (dashed).
Download figure:
Standard image High-resolution imageFigure 29 shows that there is a weak dependence of the ion-energy window fractions on detector distance from the Sun. For neutrons of a given energy there is no dependence on distance since decay only attenuates the neutron fluence and cannot change the distribution of ion energies contributing to their production. But when a range of neutron energies is considered, more neutrons with energies near the upper end of the range survive transport to the detector than those near the lower end, and the population shifts to higher neutron energies with increasing detector distance (see Figure 23). Since higher-energy neutrons generally are produced by higher-energy ions, the range of relevant ion energies for the range of neutron energies correspondingly also shifts to higher energies with increasing detector distance.
There is also a weak dependence of the ion-energy window fractions on the heliocentric angle of the flare. As the flare location changes from center to limb, fewer 1–10 MeV neutrons are produced by ions with energies >30 MeV nucleon−1 and more by 10–30 MeV nucleon−1 ions. This is because the interactions of the higher-energy ions occur deeper in the atmosphere and the neutrons produced at the limb are more effectively attenuated by scattering as they transport tangentially out of the solar atmosphere. This effect is evident only for the harder ion spectra and essentially results in a decrease of the >30 MeV nucleon−1 ion window fractions for s < 5 by about 10%–20% and a corresponding increase of the 10–30 MeV nucleon−1 window fractions. The contributions from ions <10 MeV nucleon−1 are essentially unchanged since their interactions occur higher in the solar atmosphere and are less affected by scattering as they escape.
Note that the ion-energy window fractions of Figure 29 directly reflect the contributing-reaction fractions of Figure 22. Steep spectra produce 1–10 MeV neutrons primarily via accelerated α-particle reactions with ambient heavy nuclei, which have low production threshold energies (a few MeV nucleon−1 or lower; see Table 3), while hard spectra produce neutrons primarily via the p + 4He reaction and its inverse, which have a high threshold energy (∼26 MeV nucleon−1). Ion spectra with intermediate indexes also produce neutrons via the α + 4He reaction, which has an intermediate threshold energy (∼10 MeV nucleon−1).
The impulsive-event composition does not change the ion energies responsible for 1–10 MeV neutron production. For steep ion spectra, while the inverse reactions now dominate, they have the same production cross sections when expressed as energy per nucleon as the corresponding accelerated proton and α-particle reactions. For hard spectra, the production cross section for the 3He + H reaction has an energy dependence similar to that of the p + 4He.
Assuming the ion spectrum is a power law with exponential roll-over has little impact on the ion-energy window fractions contributing to 1–10 MeV neutron production until E0 is less than about 20 MeV nucleon−1 and then only for spectral indexes harder than s ∼ 5. For such ion spectra, the 10–30 MeV nucleon−1 ion contribution becomes comparable to or exceeds that of the >30 MeV nucleon−1 ions.
Figure 30 shows the fractions that ions with energies in the four energy windows contribute to >30 MeV neutron production for the coronal composition as a function of ion spectral index for a neutron detector located at 1 AU from a disk flare (θnobs = 0°, solid curves) and a limb flare (θnobs = 85°, dashed curves). For disk flares, these higher-energy neutrons can only be made by >30 MeV nucleon−1 ions. This is because for the downward-isotropic interacting-ion angular distribution resulting from no magnetic convergence, the downward-directed high-energy neutrons must be scattered (with subsequent loss of energy) to escape from a disk flare, and their initial energies must therefore be significantly higher requiring higher-energy ion reactions. Even for limb flares, >30 MeV neutron production is dominated by >30 MeV nucleon−1 ion reactions, with 10–30 MeV nucleon−1 ions only contributing (<20%) for the steepest ion spectra, although such ions can only produce neutrons with energies not much greater than 30 MeV. We note that in the figure the 0–1 and 1–10 MeV nucleon−1 ion fractions are essentially zero and cannot be seen.
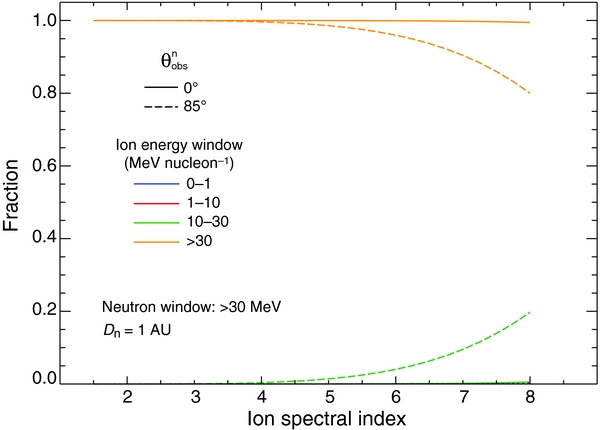
Figure 30. Fractions that ions with energies in four energy windows (0–1, 1–10, 10–30, and >30 MeV nucleon−1) contribute to >30 MeV neutron production as a function of ion spectral index for a neutron detector located at 1 AU for a disk flare (solid) and a limb flare (dashed).
Download figure:
Standard image High-resolution imageThe impulsive-event composition has little impact on the ion energies contributing to >30 MeV neutron production. The inverse reactions do not contribute significantly to these neutrons and the energy threshold and dependence of the 3He + 4He reaction cross section is almost identical to those of the α + 4He reaction (see Hua et al. 2002).
Assuming the ion spectrum is a power law with exponential roll-over has little effect on the ion energies contributing to >30 MeV neutron production for disk flares. These neutrons must have high initial energies to escape after scattering upward and so can only be made by high-energy reactions. As E0 is reduced, the yield of >30 MeV neutrons is significantly reduced as discussed above. For limb flares, there is little effect on the contributing ion energies until E0 is reduced to less than about 20 MeV nucleon−1. For such roll-over energies, 10–30 MeV nucleon−1 ions produce about half of the neutrons for ion spectral indexes steeper than s = 6.
Figure 31 shows the fractions that ions with energies in the four energy windows contribute to neutron-capture line production for the coronal composition as a function of ion spectral index from a disk flare (θ2.223obs = 0°). While ions with energies less than 1 MeV nucleon−1 are capable of producing the line, only for the steepest spectra are these ion energies relevant. For ion spectra with indexes steeper than ∼5.5, the line is produced almost exclusively by 1–10 MeV nucleon−1 ions. For ion spectra with indexes harder than ∼5, the line is produced almost exclusively by ions with energies >30 MeV nucleon−1. For a narrow range of indexes near s = 5.5, the line is produced almost equally by ions from the three >1 MeV nucleon−1 energy windows. Similar to the ion-energy fractions for 1–10 MeV neutron production, for a limb flare there are fewer capture-line photons produced by ions with energies >30 MeV nucleon−1 and more by 10–30 MeV nucleon−1 ions because the higher-energy interactions produce neutrons that are captured too deep for the photons to escape unscattered from a flare near the limb.

Figure 31. Fractions that ions with energies in four energy windows (0–1, 1–10, 10–30, and >30 MeV nucleon−1) contribute to neutron-capture line yield as a function of ion spectral index for a neutron detector located at 1 AU for a limb flare.
Download figure:
Standard image High-resolution imageNote that the distributions of ion energy-window fractions for the production of the capture line shown in Figure 31 are similar to those for 1–10 MeV neutron production shown in Figure 29. This is because the energies of the captured neutrons producing the bulk of the capture-line photons that actually escape the solar atmosphere without scattering are near 10 MeV.
Similar to the 1–10 MeV neutrons, the impulsive-event composition has little impact on the ion energies contributing to the line. For steep ion spectra, while the inverse reactions now dominate, they have the same production cross sections when expressed as energy per nucleon as the corresponding accelerated proton and α-particle reactions. For hard spectra, the production cross section for the 3He + H reaction has an energy dependence similar to that of the α + H (see Hua et al. 2002).
Again similar to the 1–10 MeV neutrons, assuming the ion spectrum is a power law with exponential roll-over has little impact on the ion-energy window fractions contributing to neutron-capture line production until E0 is less than about 20 MeV nucleon−1 and then only for spectral indexes harder than s ∼ 5. For such ion spectra, the 10–30 MeV nucleon−1 ion contribution becomes comparable to or exceeds that of the >30 MeV nucleon−1 ions.
An alternative view of the ion-energy contributions to neutron-capture line production is shown in Figure 32 where the effective ion-energy range for line production from a disk flare is shown as a function of the accelerated-ion spectral index. This effective-energy range is defined as in Murphy et al. (2007): We identify the ion energy where the line yield is maximum for a given power-law spectral index, and then define the effective ion-energy range to be that within which the yield has fallen to 50% on each side of the maximum. For steep ion spectra, the neutrons are produced primarily by accelerated α-particle reactions with ambient heavy elements and their inverse reactions whose lower threshold energies result in lower effective ion energies. For hard spectra, the accelerated proton reaction with ambient 4He and the inverse reaction dominate whose higher threshold energy shifts the effective range to higher energies. For intermediate indexes, both reactions contribute resulting in a broad effective-energy range.

Figure 32. Effective accelerated-ion energy ranges for the production of the neutron-capture line as a function of ion spectral index. The effective-energy range is the 50% yield range as defined in the text.
Download figure:
Standard image High-resolution image4. DISCUSSION
The neutron detector on MESSENGER and neutron detectors that may be included on future inner-heliospheric missions offer a new, unexplored window for investigating ion acceleration in solar flares: low-energy neutron measurements. They also offer the possibility of discovering ion acceleration associated with other energetic phenomena in the solar atmosphere. We focused on the 1–10 MeV neutron-energy window because it is the range where the MESSENGER neutron detector is most sensitive and is probably typical of the small detectors that would be included on future inner-heliosphere spacecraft.
Given the substantial effort, expense, and resources involved in placing a neutron detector in the inner heliosphere as compared to placing a neutron and/or gamma-ray detector in Earth orbit, in the Introduction we asked several questions relevant to consideration of such a mission. What are the neutron-producing reactions and which energetic-ion energy ranges contribute to this neutron-energy window? How do these reactions and energy ranges differ from those producing the higher-energy neutrons observable at Earth and from those producing the neutron-capture gamma-ray line? What neutron and neutron-capture line fluences can be expected? How does low-energy neutron detection in the inner heliosphere compare with gamma-ray line detection at 1 AU as an indicator of ion acceleration? What new information would be gained by low-energy neutron observations? Using the information and results presented in Section 3, we answer these questions here.
4.1. What Reactions and Accelerated-ion Energy Ranges Produce Low-energy Neutrons?
Are the reactions and ion energies producing the 1–10 MeV neutrons observable in the inner heliosphere different from those producing the >30 MeV neutrons that are observed at Earth? Figure 22 shows that 1–10 MeV neutrons from power-law ion spectra with indexes s steeper than ∼5 are produced by α-particle reactions with heavy ambient elements, not by accelerated proton reactions. Only for disk flares when the index is harder than ∼4 do accelerated proton reactions dominate (the reaction p + 4He). For limb flares, α-particle reactions can also contribute via the α + H reaction for hard spectra. On the other hand, the >30 MeV neutrons observable at 1 AU are produced predominantly by accelerated α reactions with ambient H and 4He for all spectral indexes (Figure 21).
Figure 29 shows that for power-law accelerated-ion spectra with indexes harder than ∼5, 1–10 MeV neutrons are produced by ions with energies greater than 30 MeV nucleon−1, not by low-energy (i.e., <10 MeV nucleon−1) ions. Neutrons of energy 1–10 MeV are produced by lower-energy ions only if the accelerated-ion spectrum is steeper than an index of s ∼ 5. But even for the steepest ion spectra considered, neutrons of energy 1–10 MeV are primarily produced by ions with energies greater than 1 MeV nucleon−1. This is because the reaction cross sections are so much larger at ion energies greater than 1 MeV nucleon−1, and these reactions also produce low-energy neutrons. The >30 MeV neutrons observable at 1 AU are produced predominantly by >30 MeV nucleon−1 ions, except for the steepest ion spectra where 10–30 MeV nucleon−1 ions can contribute (Figure 30), although such ions can only produce neutrons with energies not much greater than 30 MeV.
We also investigated lower-energy (0–1 MeV) neutrons to determine whether the production of such neutrons is in any way different from that of 1–10 MeV neutrons for power-law accelerated-ion spectra. We found that the neutron-production reactions are essentially identical (see Figures 15–20). The ion energies producing these low-energy neutrons are also almost identical to those producing the 1–10 MeV neutrons for disk flares. For limb flares there is a slight shift to lower-energy ions; such very low energy neutrons are more susceptible to scattering in the solar atmosphere, and the deeper production from the higher-energy reactions results in the loss of some of these neutrons from limb flares. Even though the neutron energies are very low, their production by <1 MeV nucleon−1 ions is still negligible even for the steepest ion spectra so far observed in solar flares (s < 6).
4.2. What Are the Expected Low-energy Neutron and Neutron-capture Line Fluences and the Associated Accelerated-ion Numbers?
Having reliable fluence estimates is important when designing solar neutron and gamma-ray detectors. The expected 1–10 MeV neutron fluence can be determined using Figure 12 for mono-energetic ions and Figure 24 for power-law accelerated-ion spectra. Similarly, the expected fluence of the neutron-capture line can be determined using Figures 14 and 26. As an example, we assume an ion spectral index s = 4 and Np(> 30 MeV) = 5 × 1032, similar to that of the very large GOES X12+ flare on 1991 June 4 observed with OSSE on the Compton Gamma-Ray Observatory (CGRO; Murphy et al. 1997). For flares occurring at heliocentric angles of 0°, 60°, and 85°, Table 4 gives the expected fluences of 1–10 MeV neutrons, ϕn(1–10 MeV), for this spectral index and proton number for a detector located at 10 Rs, 0.5 AU, and 1 AU. For comparison, we also give the expected >30 MeV neutron fluences at 1 AU, ϕn(>30 MeV). The table confirms that, except for disk flares where escaping higher-energy neutrons are suppressed, the >30 MeV neutron fluence overwhelms the 1–10 MeV fluence when the neutron detector is located at 1 AU. When the neutron detector is located nearer the Sun than ∼0.5 AU, the 1–10 MeV neutron fluence dominates for all flare locations. The neutron-capture line fluences at 1 AU, ϕ2.223, for the same ion spectral index and proton number and the same three flare heliocentric angles are also given in the table.
Table 4. Neutron and Neutron-capture Line Fluences for s = 4 and Np(>30 MeV) = 5 × 1032
| D | θobs = 0° | θobs = 60° | θobs = 85° |
|---|---|---|---|
| ϕn(1–10 MeV) (neutrons cm−2) | |||
| 10 Rs | 7.4 × 10⁴ | 1.0 × 10⁵ | 6.4 × 10⁴ |
| 0.5 AU | 44 | 75 | 53 |
| 1 AU | 0.9 | 1.7 | 1.3 |
| ϕn(>30 MeV) (neutrons cm−2) | |||
| 1 AU | 3.2 | 25 | 67 |
| ϕ2.223 (photons cm−2) | |||
| 1 AU | 277 | 212 | 45 |
Download table as: ASCIITypeset image
From Figure 10 we see that 1–10 MeV neutrons can be produced by accelerated ions with energies down to the effective production threshold of ∼500 keV nucleon−1. However, because the neutron-production cross sections are small at low ion energies, the yields of both the 1–10 MeV neutrons and the neutron-capture line would be quite small if the accelerated ions were mono-energetic at such low energies (see Figures 12 and 14), requiring large numbers of ions to produce significant fluences. For example, on 1980 June 7 the SMM detector observed a modest GOES M7.6 flare at θ2.223obs = 74° and measured a neutron-capture line fluence of 5.7 ± 0.9 photons cm−2 at 1 AU (Vestrand et al. 1999). Using Figure 14, such a capture-line fluence would require 6 × 1037 accelerated protons if they were mono-energetic at 2 MeV nucleon−1. This is comparable to the number of protons of all energies accelerated in the very large GOES X12+ 1991 June 4 flare (Murphy et al. 1997). Note that at 2 MeV nucleon−1, the neutron-capture line is produced almost exclusively by accelerated α particles, not protons (see Figure 13). For the accelerated α/proton ratio of 0.2 assumed here, the number of accelerated α particles would be 1.2 × 1037.
4.3. How Does Inner-heliosphere Low-energy Neutron Detection Compare with Gamma-Ray Line Detection at Earth?
In the flare-loop model, the neutron-capture line always accompanies neutron production. Although it can be significantly attenuated by Compton scattering for limb flares, it is the most sensitive gamma-ray line indicator of ion acceleration in flares. It is also a more sensitive indicator than detection of escaping neutrons in interplanetary space with the neutron detectors that have been located at 1 AU (e.g., CGRO/OSSE). (Note that de-excitation lines are also an indicator of ion acceleration but they are intrinsically broader than the capture line and therefore more difficult to observe. They are also only produced by accelerated ions with energies >1 MeV nucleon−1. On the other hand, because the nuclear reactions producing the excited nuclei occur in the chromosphere rather than in the photosphere, they do not suffer significant attenuation.) However, if the neutron detector is sensitive to low-energy neutrons and is located in the inner heliosphere, neutron detection could be a more sensitive indicator of ion acceleration because of the tremendous enhancement of the low-energy neutron fluence.
A quantity useful for measuring the relative effectiveness for revealing ion acceleration is R, the ratio of the 1–10 MeV neutron fluence at the neutron detector to the 2.223 MeV neutron-capture line fluence at the gamma-ray detector. When the gamma-ray detector is located at 1 AU, R provides a useful quantity for comparing the value of a neutron detector in the inner heliosphere with that of a gamma-ray detector in Earth orbit. It is also useful as a consistency check for neutron and capture-line measurements (e.g., as by Share et al. 2011).
R depends on the loop magnetic convergence (δ), the level of PAS (λ), the accelerated-ion spectral index (s), the directions to the neutron and gamma-ray detectors (θnobs and θ2.223obs), the distances of the neutron and gamma-ray detectors from the Sun (Dn and Dγ-ray), and the ambient and accelerated-ion compositions. It would be impossible to provide values of R for all possible combinations of these parameters. Instead we will provide calculations for specific combinations of parameters and qualitatively discuss how R changes when they are varied. For other specific combinations, the neutron-production code must be run.
The red curves of Figure 33 show the ratio R as a function of the neutron detector distance from the Sun, Dn, with the gamma-ray detector located at Dγ-ray = 1 AU for ion spectral indexes of 2, 4, 6, and 8. The flare heliocentric angle for both detectors is 60° and the ions are released isotropically at the top of the loop with no convergence or PAS (δ = 0, λ → ∞), which results in a downward-isotropic interacting-ion angular distribution. The tremendous increase of R at small distances due to both neutron survival and the D2 effect is clearly seen. R decreases as the ion spectrum hardens (s decreases) at all distances. Because the ion energies responsible for the two emissions are almost identical (see the discussion of Section 3.3 and Figures 29 and 31), this is not due directly to the steepness of the ion spectrum. It is due instead to the deeper neutron production associated with harder spectra, which reduces the escaping 1–10 MeV neutron fluence due to scattering and increases the probability of neutron capture (offset somewhat because of the increased line attenuation from Compton scattering due to the deeper captures). The red curves of Figure 34 show similar values of R calculated for mono-energetic ions of 0.75, 2, 10, and 100 MeV nucleon−1.

Figure 33. R, the fluence ratio of 1–10 MeV neutrons and the 2.223 MeV neutron-capture line as a function of the distance Dn to the neutron detector for accelerated-ion spectral indexes of 2, 4, 6, and 8. The red curves are for a gamma-ray detector located at distance Dγ-ray = 1 AU and the green curves are for a gamma-ray detector located at the same distance as the neutron detector. The flare heliocentric angle for both the neutron and gamma-ray detector is 60°.
Download figure:
Standard image High-resolution image
Figure 34. R, the fluence ratio of 1–10 MeV neutrons and the 2.223 MeV neutron-capture line as a function of the distance Dn to the neutron detector for mono-energetic accelerated ions of 0.75, 2, 10, and 100 MeV nucleon−1. The red curves are for a gamma-ray detector located at distance Dγ-ray = 1 AU and the green curves are for a gamma-ray detector located at the same distance as the neutron detector. The flare heliocentric angle of both the neutron and gamma-ray detector is 60°.
Download figure:
Standard image High-resolution imageAs discussed above, the impulsive-event composition increases the yields of both the 1–10 MeV escaping neutrons and the neutron-capture line. For disk flares, because of the neutron angular distribution, the neutron-capture line increases more, relative to the neutrons, resulting in values of R lower than for the coronal composition. The decrease is negligible for hard ion spectra, but for spectral indexes steeper than s ∼ 4, R is about a factor of three smaller. For limb flares, R is larger for the impulsive-event composition but only by <10% for most ion spectral indexes rising to ∼30% for intermediate indexes (3–6). The inclusion of the reactions of accelerated 3He with ambient heavy elements would not significantly impact the value of R. These impacts on R are independent of distance to the detectors.
As discussed above, assuming the ion spectrum is a power law with exponential roll-over decreases the yields of both the 1–10 MeV escaping neutrons and the neutron-capture line, especially for hard ion spectra. Because the capture line is produced by slightly higher-energy ions than those producing 1–10 MeV neutrons (as seen by close inspection of Figures 29 and 31), R increases as E0 decreases from large values. For E0 = 100 MeV nucleon−1 and a flare at a heliocentric angle of 60° for both detectors, R is larger by ∼50% for an ion spectral index of 2 and still only by a factor of two for E0 = 10 MeV nucleon−1. For an ion index of 6, the increase of R is <5% for all values of E0. These impacts on R are independent of distance to the detectors.
To convey a sense of the dependence of R on changing the interacting-ion angular distribution by (1) changing the angular distribution of ions released at the top of the loop and (2) changing the loop magnetic convergence δ, we show in Table 5 values of R for ion spectral indexes of 2, 4, and 6 and for three loop conditions (all with no PAS): (Case 1, "beam") downward beam of ions released at the top of the loop and no magnetic convergence (δ = 0) resulting in a downward beam of interacting ions; (Case 2, "down iso") isotropic release of ions at the top of the loop and no magnetic convergence (δ = 0) resulting in a downward-isotropic angular distribution of interacting ions; and (Case 3, "pancake") isotropic release of ions at the top of the loop and strong magnetic convergence (δ = 0.45) resulting in a pancake angular distribution of interacting ions. For the flare heliocentric angles for both of the two detectors, we again assume 60°. We place the neutron detector at an intermediate inner-heliospheric distance Dn = 0.5 AU and the gamma-ray detector at Earth, Dγ-ray = 1 AU.
Table 5. Ratio of 1–10 MeV Neutron Fluence at 0.5 AU (θnobs = 60°) to 2.223 MeV Line Fluence at 1 AU (θ2.223obs = 60°) for Three Cases of Ion Release and Magnetic Convergence, All with No PAS (λ → ∞)
| Power-law | Case 1 | Case 2 | Case 3 |
|---|---|---|---|
| Index | Beam | Down Iso | Pancake |
| 2 | 0.08 | 0.18 | 0.68 |
| 4 | 0.18 | 0.35 | 1.23 |
| 6 | 0.38 | 0.65 | 1.24 |
Note. The cases are described in the text.
Download table as: ASCIITypeset image
For the isotropic-release cases (2 and 3), we see from Table 5 that, for all ion spectral indexes, R increases as δ increases from 0 to 0.45. This is because mirroring results in more neutrons being produced higher in the atmosphere and in upward directions near their mirroring points and decreased capture-line yield. We found that increasing δ above 0.45 does not significantly increase R because (1) the angular distribution, while broader, is still essentially symmetric about the tangential direction and (2) neutron production for δ = 0.45 is already quite high in the atmosphere and the even-lower densities associated with larger values of δ do not significantly decrease scattering of the neutrons. The R values for the downward-beamed ions are generally about 50% of those for the isotropic-release cases because (1) the ions penetrate and produce neutrons deeper in the atmosphere (see Figure 5(d)), (2) downward-directed ions produce more downward-directed neutrons that cannot easily escape, and (3) the capture-line yield is increased.
Table 5 shows that R decreases with harder spectra, due to the increased neutron scattering of the deeper neutron production. We see that as s hardens from 6 to 4, R decreases by a factor of two for the downward beam and downward-isotropic, δ = 0 cases but is essentially unchanged for δ = 0.45. For δ = 0.45, most of the production already occurs high in the atmosphere for both s = 4 and 6; the small additional production depth for s = 4 only marginally decreases the neutron escape probability.
To explore the effect of PAS we calculated the ratio R for the case of δ = 0.2 and saturated PAS (λ = 20). The values of R were found to be between the values for δ = 0 and 0.45, although close to the δ = 0 case. PAS increases the number of ions interacting downward (see Figure 4); consequently, more neutrons are also directed downward, reducing the number of neutrons that can escape and increasing the number that can be captured, decreasing R and compensating for the higher production height for δ = 0.2 due to mirroring compared to that for δ = 0.
Generally, the neutron and gamma-ray detectors will not both be at the same flare heliocentric angle. For Dn = 0.5 AU, the minimum value of R (0.02) occurs for a flare with a downward beam of ions having a hard ion spectral index (s = 2) that is located at disk center for the gamma-ray detector but near the limb for the neutron detector. In this case, the line fluence is maximized and neutron production is deep, with minimal production of upward-moving neutrons and maximal scattering through the solar atmosphere. For Dn = 0.5 AU, the maximum value of R (5) occurs for a flare having a moderate ion spectral index s of 4 and strong convergence located near the limb for the gamma-ray detector and at 60° for the neutron detector. In this case, the line fluence is minimized and the neutron fluence is maximized with an optimal combination of production height, angular distribution, and flare heliocentric angle.
An inner-heliosphere mission could also include a small gamma-ray detector or, perhaps, only a small gamma-ray detector. The green curves of Figure 33 show the ratio R assuming the gamma-ray detector is located at the same distance from the Sun as the neutron detector. In this case, the only advantage near-Sun low-energy neutron detection has over neutron-capture line detection is the increased survival of the neutrons. Even at 10 Rs, the 1–10 MeV neutron fluence is now only about equal to the capture-line fluence. The green curves of Figure 34 show the corresponding values of R for mono-energetic ions of 0.75, 2, 10, and 100 MeV nucleon−1.
The relative sensitivities of the neutron and gamma-ray detectors must be considered when comparing measurement of low-energy neutrons in the inner heliosphere with measurement of the neutron-capture line at 1 AU. From the atlas of solar flares observed with SMM (Vestrand et al. 1999), the typical 1σ sensitivity for the neutron-capture line measured with the SMM NaI scintillator (∼70 cm2 at 2 MeV) is ∼1 photon cm−2. We estimate the sensitivity for the 1–10 MeV neutron measurement for a typical inner-heliosphere detector using Figure 5(c) from Feldman et al. (2010), which shows that the background neutron counting rate for the MESSENGER detector is ∼0.5 s−1. Assuming a neutron accumulation duration of 1000 s, this corresponds to 500 counts. Taking the square root and dividing by an assumed neutron detector effective area of 10 cm2 (a reasonable value for a small inner-heliosphere mission), this rate corresponds to a 1σ uncertainty for a neutron-fluence measurement of ∼2 neutrons cm−2; i.e., comparable to the line measurement uncertainty. This neutron sensitivity could be improved if the detector is designed to reduce the background; for example, by improved shielding or incorporating techniques to determine the neutron arrival direction allowing rejection of events not from the solar direction. On the other hand, the sensitivity of the gamma-ray detector could be improved if it has significantly better energy resolution at 2 MeV than the SMM scintillator (as would, for example, a solid-state germanium detector) depending on its relative effective area.
For the above sensitivities, R must be greater than about 2 for the neutron measurement to be a more sensitive diagnostic of ion acceleration. For typical flare-loop parameters, Figure 33 shows that for a neutron detector at 0.5 AU, the line measurement at 1 AU remains a more effective indicator of ion acceleration. However, for an ion spectral index of 4, low-energy neutron detection becomes equally effective when the distance from the Sun to the neutron detector is ∼70 Rs (∼0.3 AU). For closer approaches to the Sun, the tremendous increase of the low-energy neutron flux means that neutron detection would become dramatically more effective than gamma-ray line detection at 1 AU for revealing ion acceleration in solar flares.
4.4. What New Information Does Inner-heliosphere Low-energy Neutron Detection Provide?
Low-energy neutron observations provide a potentially new source of information about ion acceleration in flares and the physical conditions within the flare loop. What unique information can such observations provide that cannot be obtained from gamma-ray line and higher-energy neutron observations at 1 AU? The neutron-capture line is one of the strongest gamma-ray lines in flare spectra and is thus the best gamma-ray indicator of ion acceleration for flares not at the solar limb. From the discussion of Section 3.3 (see Figures 29 and 31), we see that the energies of the ions responsible for the 1–10 MeV escaping neutrons are very similar to those producing the neutron-capture line. Furthermore, the dominant reactions producing the 1–10 MeV escaping neutrons and the line-producing captured neutrons are also similar (see Figures 22 and 25).
We conclude that, in this sense, a measurement of the 1–10 MeV neutron fluence is equivalent to a measurement of the neutron-capture line fluence, and, if measured alone without measurement of at least one other high-energy flare emission, would not provide different information about typical large flares than would be obtained from a measurement of the neutron-capture line with a gamma-ray instrument at 1 AU. A measurement of the 1–10 MeV neutron fluence alone would only demonstrate that ions were accelerated and interacted, equivalent to a measurement of the neutron-capture line alone. Of course, because of the dramatically increased fluence of low-energy neutrons very near the Sun, an inner-heliosphere neutron detector could, however, be a more sensitive indicator of ion acceleration than gamma-ray observations at 1 AU. This is discussed in the Summary (Section 5).
On the other hand, these two emissions are different in that the 1–10 MeV neutrons are those neutrons that escape upward while the neutron-capture line results from those neutrons that are directed downward. The relative sizes of these two populations depend on the angular distribution of the interacting ions, which in turn depends (see Section 3.1) on the magnetic convergence (δ) and level of PAS (λ). In addition, scattering of the escaping neutrons depends on the depth in the atmosphere where the neutrons are produced, which again depends on δ and λ, in addition to the ion spectral index s (see Section 3.1.2). Because the depths at which the neutrons producing the line are captured do not depend strongly on δ and λ (see Section 3.1.4), neither does the attenuation of the neutron-capture line due to Compton scattering, although the line production does.
Therefore, if, in addition to a measurement of the 1–10 MeV neutron fluence, a measurement of the neutron-capture line fluence is also available (from a gamma-ray detector either on board the inner-heliosphere spacecraft or in Earth orbit), more information about the accelerated ions and the flare-loop conditions can be obtained through the ratio R. The discussion of Section 4.3 and Table 5 show that a measurement of R could be used to constrain δ and λ. But Figure 33 and Table 5 show that R also depends on the ion spectral index s and so can also provide information about the ion spectrum. Disentangling the dependences of R on δ, λ, and s requires measurement of additional high-energy flare observables. For example, if measurements of de-excitation line fluences (which do not depend on δ and λ; see Murphy et al. 2007) are also available, a good determination of the ion spectral index in the ∼1–20 MeV nucleon−1 energy range can be obtained from the fluence ratio of the 6.13 MeV 16O line and the 1.634 MeV 20Ne line (e.g., Ramaty et al. 1996). Thus, measurements of the various flare emissions can be used together to determine simultaneously various loop parameters as demonstrated by Murphy et al. (2007).
If the low-energy neutron detector has sufficient neutron-energy resolution and sensitivity, information about the ion spectrum may be obtained directly from the measured neutron spectrum. Figure 35 shows calculated 0.1–20 MeV escaping-neutron spectra from interactions of mono-energetic ions with energies of 0.75, 2, 5, and 10 MeV nucleon−1 for a disk flare (θnobs = 0°) and a limb flare (θnobs = 85°) for a detector located at 10 Rs. The spectra for each flare location have been renormalized to have the same fluence at 2 MeV for ease of comparison. For a given flare location, in the 1–10 MeV neutron-energy band there are no significant differences in shape (other than some structure) among the neutron spectra for the four mono-energetic ion energies up to a neutron energy of ∼7 MeV. Above that energy, the neutron high-energy cutoff becomes apparent. If the neutron detector is sensitive only up to 10 MeV, it still may be able to distinguish between mono-energetic ions with energies greater or less than ∼3 MeV nucleon−1 by detecting this cutoff, at least for disk flares and if the statistical quality of the data is adequate. If the detector sensitivity extends to 20 MeV or more, it may be able to distinguish among all of the plotted ion energies. The presence of structure in the neutron spectrum may be used as an additional diagnostic of the ion energy. Note that the neutron spectra shown in Figure 35 are different from those shown in Figures 7 and 8 because the effects of neutron decay due to transit of the neutrons to 10 Rs have been accounted for.

Figure 35. Time-integrated 0.1–20 MeV escaping-neutron spectra from a disk flare (θnobs = 0°) and a limb flare (θnobs = 85°) produced by interactions of mono-energetic ions of 0.75, 2, 5, and 10 MeV nucleon−1 for a detector located at 10 Rs. For ease of comparison, the neutron spectra for each flare location have been renormalized to have equal fluence at 2 MeV.
Download figure:
Standard image High-resolution imageSimilar to Figure 35, Figure 36 shows calculated 0.1–20 MeV escaping-neutron spectra from interactions of ions with power-law spectra having indexes of 2, 4, and 6. For a given flare location, in the 1–10 MeV neutron-energy band these neutron spectra are sufficiently different (at least above ∼5 MeV) that a neutron detector sensitive up to a neutron energy of 10 MeV should be able to distinguish between ion spectra whose indexes differ by more than about 1. Again, the presence of structure in the neutron spectrum from the steepest ion spectra may be used as additional confirmation of a very steep ion spectrum. Again, note that the neutron spectra shown in Figure 36 are different from those shown in Figures 15–20 because the effects of neutron decay due to transit of the neutrons to 10 Rs have been accounted for.
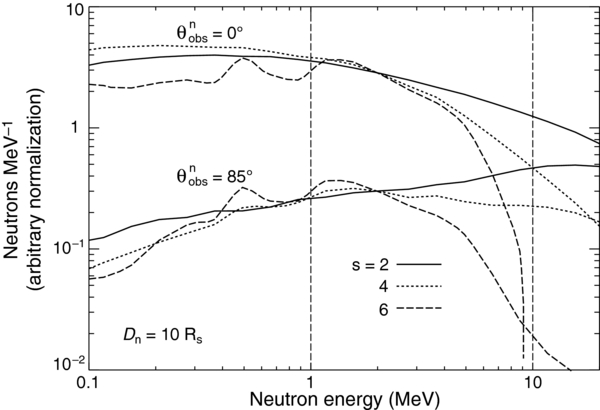
Figure 36. Time-integrated 0.1–20 MeV escaping-neutron spectra from a disk flare (θnobs = 0°) and a limb flare (θnobs = 85°) produced by interactions of ions with power-law spectral indexes of 2, 4, and 6 for a detector located at 10 Rs. For ease of comparison, the spectra for each flare location have been renormalized to have equal fluence at 2 MeV.
Download figure:
Standard image High-resolution image
Measurements of solar-flare de-excitation lines and the >30 MeV neutrons that survive to 1 AU provide information about the accelerated-ion spectrum only above ∼1 MeV nucleon−1. For the de-excitation lines, this is because all of the line production cross sections have threshold energies above 1 MeV nucleon−1 (the reaction threshold energy for producing the 1.634 MeV line by accelerated α-particle interactions with 20Ne has the lowest threshold at ∼1 MeV nucleon−1). For the >30 MeV neutrons, this is because only ions with energies greater than about 30 MeV nucleon−1 are capable of producing these higher-energy neutrons surviving transit to 1 AU (see Section 3.3). Because information about the accelerated-ion spectrum below 1 MeV nucleon−1 is not available, the ion power-law spectra used in the calculations presented here were conservatively assumed to be flat below 1 MeV nucleon−1 (a broken power law).
Knowing the behavior of the ion spectrum below 1 MeV nucleon−1 is critical for determining the total energy contained in accelerated ions, especially for steep ion spectra. MacKinnon (1989) suggested that gamma-ray lines produced by radiative capture of low-energy protons by ambient nuclei could be useful as an indicator of the presence of very low energy ions. The cross sections for these reactions exhibit strong resonances at low proton energies, and because of these low reaction energies the lines are very narrow, enhancing their detectability. An example is the 2.37 MeV line from the reaction 12C(p, γ)13N, whose cross section has a resonance energy at 457 keV and a width (ΔE) of 37 keV. However, the cross sections for such reactions are typically very small (∼0.1 mbarn at the peak) resulting in very low expected fluences (see Share et al. 2001). Neutron fluences produced by low-energy ions could be much larger. For example, the cross section for neutron production by accelerated α particles with Mg and Ne is about 20 mbarn at 1 MeV nucleon−1. Assuming a "width" of 0.5 MeV nucleon−1 and taking into account the relative abundance of the accelerated α particles, the value of σ × ΔE for neutron production is at least two orders of magnitude larger than that for the 2.37 MeV proton-capture line.
We now investigate whether low-energy neutron measurements could be useful as a diagnostic of the ion spectrum at these low energies. As we have shown, for the broken power-law ion spectrum assumed in the calculations presented here, ions with energies less than 1 MeV nucleon−1 do not significantly contribute to the production of <10 MeV neutrons; such neutrons are produced by >1 MeV nucleon−1 ions even for the steepest ion spectra. To see whether 1–10 MeV neutrons can provide a useful diagnostic for the presence of low-energy ions, we calculated neutron production assuming an accelerated-ion spectrum that continues unbroken to ion energies below the thresholds for neutron production. We found that for spectral indexes harder than s ∼ 7, the unbroken power law does not add any significant enhancement to the <10 MeV neutron spectrum because the production of these neutrons is still dominated by >1 MeV ions. Therefore, for the typical flares that have indexes from 2 to 6, low-energy neutrons would not be a useful diagnostic for <1 MeV accelerated ions unless there are many more low-energy ions than a simple continuation of the power law to low energies provides or if low-energy ions were somehow more effective in producing neutrons than as calculated here. For example, if the energy loss of low-energy ions is significantly less as would be the case if the medium is very hot (see, for example, MacKinnon 1989).
However, for spectral indexes steeper than s ∼ 7, the unbroken power-law spectrum does result in significant low-energy neutron production by <1 MeV nucleon−1 ions, and the ratio of the 1–10 MeV neutron fluence to that of a de-excitation line would be larger by about a factor of two for s = 8. (For the flare-loop model, the neutron-capture line yield would also increase by a similar amount.) For such steep ion spectra, low-energy neutron observations could serve as a marginally useful diagnostic for low-energy ion acceleration. And if there are energetic phenomena where only <1 MeV nucleon−1 ions are accelerated, low-energy neutrons could be the only useful high-energy diagnostic since no de-excitation lines would be produced.
5. SUMMARY
Reliable interpretation of neutron measurements made by detectors on spacecraft located in the inner heliosphere requires a thorough understanding of low-energy (1–10 MeV) neutron production. We calculated neutron production in a magnetic flare loop using an improved version of the Monte-Carlo-based computer code (Hua et al. 2002). The code was originally optimized for neutron measurements at 1 AU; i.e., >30 MeV neutrons. At low ion energies, proton and α-particle interactions with heavy elements (C, N, O, etc.) and their inverse reactions contribute significantly compared with proton and α-particle interactions with 4He as at higher ion energies. At the lowest ion energies (less than ∼5 MeV nucleon−1), only α-particle reactions with heavy elements and their inverse reactions contribute. The improvements to the code at low energies specifically addressed the treatment of these proton and α-particle reactions with heavy elements.
The modifications to the code are described in detail in Section 2. We used the nuclear-reaction code TALYS to provide the necessary neutron-production cross-section information. At high accelerated-ion energies (greater than ∼30 MeV nucleon−1), we retained the simple and efficient method of the original code with revisions only to two parameters. At lower energies, we introduced an entirely new method, directly incorporating the calculated TALYS cross sections into the code. The code now accurately calculates neutron production by these heavy-element reactions in a flare loop at all ion energies, allowing detailed study of the low-energy neutron production by low-energy accelerated ions relevant for observations with inner-heliosphere neutron detectors.
With the revised code we calculated neutron production using the flare-loop model, including neutron-capture line production, which always accompanies neutron production in this model. In Section 3, we calculated in detail escaping-neutron spectra and yields and the yield of the neutron-capture line for the full range of loop parameters (accelerated-ion spectra, composition and angular distribution, magnetic loop convergence, ion PAS, and flare location on the solar disk relative to the direction of the neutron and gamma-ray detectors). The information presented in Section 3 is essential for any research concerning low-energy neutrons and provides answers to the questions posed in the Introduction (Section 1) concerning the physics of the production of low-energy neutrons and their detection by small neutron detectors in the inner heliosphere. The questions are addressed in detail in the discussion (Section 4) and the answers are summarized briefly here.
Which reactions are responsible for the production of 1–10 MeV neutrons (Section 4.1)? Neutrons of energy 1–10 MeV from steep power-law ion spectra with indexes s larger than ∼5 are produced by accelerated α-particle reactions with heavy ambient elements. The contribution from the inverse reactions is less due to the increased energy losses of the heavy elements. For disk flares, it is even less because the downward-directed neutrons must scatter upward to escape. For harder ion spectra, proton reactions dominate (p + 4He). If the heavy-element abundances of the accelerated ions are significantly enhanced as in impulsive events seen in interplanetary space, the inverse reactions of accelerated heavy elements with ambient 4He can dominate for steep ion spectra, especially for limb flares. Thus, the 1–10 MeV neutron measurement could relate to accelerated protons, α particles, or heavy elements, depending on the spectrum and composition of the accelerated ions and the flare location. For power-law accelerated-ion spectra, the >30 MeV neutrons observable at 1 AU are produced predominantly by accelerated α-particle interactions with ambient H or 4He for most ion spectral indexes.
What are the ion energy ranges responsible for the production of 1–10 MeV neutrons (Section 4.1)? For power-law accelerated-ion spectra with indexes harder than ∼5, 1–10 MeV neutrons are primarily produced by >30 MeV nucleon−1 ions, not by low-energy (i.e., <10 MeV nucleon−1) ions. For such power-law ion spectra, observation of 1–10 MeV neutrons in the inner heliosphere would not be exclusively exploring low-energy ion acceleration in solar flares but would be similar to neutron detection at 1 AU where the surviving >30 MeV neutrons are also produced by >30 MeV nucleon−1 ions. Neutrons of energy 1–10 MeV are produced by low-energy ions only if the accelerated-ion spectrum is steeper than an index of s ∼ 5, but even then they are still produced by >1 MeV ions. Changing the accelerated-ion composition to the impulsive-event composition does not change the ion energies responsible for 1–10 MeV neutron production because this composition only shifts the dominant reactions from accelerated α-particle reactions with ambient heavy nuclei to the inverse reactions of accelerated heavy ions with ambient 4He, which have the same neutron-production cross sections. We investigated the production of <1 MeV neutrons and found they are also mostly produced by >1 MeV ions.
What are the expected fluences of 1–10 MeV neutrons (Section 4.2)? Except for disk flares where escaping higher-energy neutrons are suppressed, for typical flare ion spectra the >30 MeV neutron fluence overwhelms the 1–10 MeV fluence when the neutron detector is located at 1 AU. When the neutron detector is located closer to the Sun than ∼0.5 AU, the 1–10 MeV neutron fluence is larger than the >30 MeV neutron fluence at 1 AU for all flare locations. Note that while neutrons can be produced by accelerated ions with energies down to the effective production threshold of ∼500 keV nucleon−1, the yields of both the 1–10 MeV neutrons and the neutron-capture line would be quite small if the accelerated ions were mono-energetic at such low energies (see Figures 12 and 14) and would require large numbers of ions to produce significant fluences.
There may be a large population of very small magnetic loops on the solar surface that could frequently accelerate ions similar to larger flares but perhaps only to very low intensities or only with very steep ion spectra. The resulting neutron and gamma-ray fluences would be too weak to have been detected with typical instruments at 1 AU. The SMM upper limit to the neutron-capture line flux (Harris et al. 1992) measured outside of times when large gamma-ray flares (i.e., flares with emission >300 keV) were observed can be used to place limits on the associated number of accelerated ions and the resulting 1–10 MeV neutron flux. Using the calculated neutron-capture line fluences of Figure 26 for a flare located at an "average" heliocentric angle θ2.223obs = 60°, the SMM line-flux upper limit of ∼7 × 10⁻⁵ photons cm−2 s−1 would imply an ion-acceleration rate upper limit of 2.3 × 10²³ > 30 MeV protons s−1 for a very steep accelerated-ion spectral index of 8. (Because, similar to the 1–10 MeV neutrons, the capture line for such a steep ion spectrum is produced predominantly by accelerated α-particle reactions with heavy elements, this is actually an upper limit of 4.6 × 10²² > 30 MeV nucleon−1 α-particles s−1 for the assumed accelerated α/proton ratio of 0.2.) Using Figure 24, this rate of accelerated ions corresponds to a 1–10 MeV neutron flux upper limit of 7 × 10⁻⁵ neutrons cm−2 s−1 for a neutron detector located at 0.5 AU and θnobs = 60°. If the spacecraft trajectory carried the detector to within 20 Rs, the neutron flux upper limit would be 0.02 neutrons cm−2 s−1. For a more typical flare ion spectral index of 4, the ion-acceleration rate upper limit would be 2 × 1026 > 30 MeV protons s−1 and the 1–10 MeV neutron flux upper limit would be 2.5 × 10⁻⁵ and 8 × 10⁻³ neutrons cm−2 s−1 for detectors at 0.5 AU and 20 Rs, respectively. Although this flux is low even at 20 Rs, it could be detected if the exposure is long enough. For example, for the nominal trajectory of the planned Solar Probe Plus mission, the spacecraft will spend more than 900 hr within 20 Rs. Using the MESSENGER background count rate noted above (Section 4.3), the flux would be detectable at a significance of 200σ during this exposure.
How does an inner-heliosphere low-energy neutron detector compare with a gamma-ray detector in Earth orbit for revealing ion acceleration (Section 4.3)? Within the context of the flare-loop model, the neutron-capture line always accompanies neutron production in solar flares and is one of the strongest lines in flare gamma-ray spectra. Although the neutron detector necessarily would be modest, the fluence of low-energy neutrons is tremendously enhanced as the distance to the neutron detector is reduced, due to both the D2 effect and increased survival against neutron decay. The quantity R (the ratio of the 1–10 MeV neutron fluence at the neutron detector to the 2.223 MeV neutron-capture line fluence at the gamma-ray detector) is useful for measuring the relative improvement provided by such a detector over a gamma-ray detector at 1 AU.
Taking into account typical gamma-ray and neutron measurement sensitivities, we find that R must be greater than 2 for the neutron measurement to be a more sensitive diagnostic of ion acceleration. Assuming typical flare-loop parameters, for a neutron detector located at 0.5 AU the capture-line measurement at 1 AU remains a more effective indicator of ion acceleration. However, for a typical flare accelerated ion spectral index of 4, low-energy neutron detection becomes equally effective when the distance from the Sun to the neutron detector is ∼70 Rs (∼0.3 AU). For closer approaches to the Sun, the tremendous increase of the low-energy neutron flux means that neutron detection would become dramatically more effective than gamma-ray line detection at 1 AU for revealing ion acceleration in solar flares, extending our knowledge of flare processes to a new population of weak flares not previously observable. The nominal trajectory of the planned Solar Probe Plus mission, which unfortunately has neither a neutron nor a gamma-ray detector among its planned complement of instruments, has more than 40 perihelion passes inside of 35 Rs with a closest approach of 9.5 Rs.
How would a small inner-heliosphere gamma-ray detector compare with a inner-heliosphere low-energy neutron detector? In this case, the only advantage neutron detection has over neutron-capture line detection is the increased survival of the neutrons, so that even at 10 Rs the 1–10 MeV neutron fluence is now only about equal to the capture-line fluence. Even if the gamma-ray detector were modest with 10 cm2 effective area (equal to that assumed for the neutron detector) at a gamma-ray energy of 2 MeV, the advantage of neutron detection over gamma-ray detection for revealing ion-acceleration has been lost. On the other hand, a measurement of the neutron spectrum could provide direct information about the ion spectral steepness not available from a measurement of the capture line alone. Also, the sensitivity of the neutron measurement could be improved if the detector incorporated techniques to determine the neutron arrival direction allowing rejection of events not from the solar direction, reducing the detector background.
What new information about ion acceleration in a flaring loop would inner-heliosphere low-energy neutron measurements provide that measurement of the neutron-capture line at Earth would not (Section 4.4)? In the loop model, the types of reactions and energy ranges responsible for the 1–10 MeV escaping neutrons are very similar to those producing the neutron-capture line. We conclude that a measurement of the 1–10 MeV neutron fluence alone is equivalent to a measurement of the neutron-capture line fluence alone and would not provide different information about ion acceleration in typical large flares than would be obtained from a measurement of the neutron-capture line with a gamma-ray instrument at 1 AU. On the other hand, as mentioned above, a measurement of the neutron spectrum could provide direct information about the ion spectral steepness not available from a measurement of the capture line alone. And if measurements of another flare emissions are also available, it can be used to determine more information about the accelerated ions and the flare loop.
However, if, in addition to the inner-heliosphere 1–10 MeV neutron fluence measurement, a measurement of the neutron-capture line fluence were also available (from a gamma-ray detector either on board the inner-heliosphere spacecraft or in Earth orbit), more information about the accelerated ions and the flaring loop could be obtained. The ratio R is sensitive to the accelerated-ion spectral index. A measurement of R could then provide an estimate of the ion spectrum and remove the uncertainty of which reactions and what ion energy ranges are producing the measured low-energy neutrons. The ratio of the yield of the neutron-capture line Compton-scattered continuum to that of the capture line is also sensitive to the ion spectral index, and its measurement could also be used to constrain it. Measurement of several flare-emission observables can be used together to simultaneously constrain the loop parameters and the accelerated-ion spectral index. For example, a good determination of the ion spectral index in the ∼1–20 MeV nucleon−1 energy range can be obtained from the fluence ratio of the 6.13 MeV 16O and the 1.634 MeV 20Ne de-excitation lines which do not depend on the loop parameters δ and λ (Murphy et al. 2007). Also, if the accelerated-ion spectrum were very steep or for ion acceleration only to energies <1 MeV nucleon−1, comparing 0–10 MeV neutron measurements with measurements of de-excitation lines (which are not produced by <1 MeV nucleon−1 ions) can reveal the presence of very low energy ions.
The flare loop is generally accepted as a successful model for the production of high-energy emissions from solar flares, at least for the large flares observed to date with gamma-ray and neutron detectors at 1 AU. The neutron capture line always accompanies neutron production for this flare-loop model, and the ratio R discussed above was calculated for such a loop. However, there may be other magnetic configurations in the solar atmosphere where ion acceleration occurs. For example, micro-flares (frequently occurring, impulsive increases of both thermal and non-thermal X-ray emission within coronal bright points) can exhibit upward-directed jets of emission (e.g., Shibata et al. 1992), offering the possibility of ion acceleration on open field lines. Type III radio bursts are produced by electron beams escaping the corona and often subsequently detected as SEPs (Hannah et al. 2011). Upward-directed, low-energy accelerated ions not constrained by a magnetic loop could produce escaping neutrons but minimal yield of the neutron-capture line (or even de-excitation lines if the ion spectrum is very steep or mono-energetic at an energy less than 1 MeV nucleon−1). In such cases, low-energy neutrons detected by an inner-heliosphere neutron detector would be a primary means of revealing the low-energy ions. While the neutron yield from each jet may be small, if such jets are numerous the combined neutron flux may be detectable during the exposure when the detector is very close to the Sun. For example, as noted above, the planned Solar Probe Plus mission spacecraft will spend more than 900 hr within 20 Rs.
The possibility of discovering such a class of events or other unexpected ion-acceleration phenomena (such as from nano-flares that occur even outside of active regions; Golub et al. 1974) could be a significant motivation for an inner-heliosphere low-energy neutron detector with its sensitivity for providing evidence for ion acceleration. Such a discovery would have a large impact on many aspects of solar physics. An inner-heliosphere mission may spend only a small fraction of time very close to the Sun, and so the chance of observing a typical solar flare during such a narrow temporal window may be small. But, if ion acceleration in frequently occurring micro-flares is common, it may be detectable with an inner-heliosphere neutron detector.
We are grateful to Xin-Min Hua for discussions concerning the flare-loop neutron-production code. We also acknowledge A. J. Koning for development of the nuclear-reaction code TALYS, his help in using the code, and his willingness to answer our questions concerning nuclear physics. This work was supported by NASA grant NNH09AM55I and the Office of Naval Research. B. Kozlovsky acknowledges the Israeli Science Foundation for support.