
Abstract
Using a range of different diagnostics we have performed a detailed experimental characterization of a capacitively coupled rf plasma discharge excited by tailored voltage waveforms in argon (3–13 Pa). The applied pulse-type tailored waveforms consist of between 1 and 5 harmonics (with a fundamental of 15 MHz), and are used to generate an electrically asymmetric plasma response, manifested by the formation of a strong dc bias in the geometrically symmetric reactor used. Experimental measurements of the dc bias, electron density, ion current density, ion-flux energy distributions at the electrodes and discharge current waveforms, are compared with a one-dimensional particle-in-cell simulation for the same operating conditions. The experimental and simulation results are found to be in good agreement over the range of parameters investigated, and demonstrate a number of unique features present with pulse-type tailored waveforms, including: increased plasma density and ion flux with the number of harmonics, and a broader control range of the ion bombarding energy.
Export citation and abstract BibTeX RIS
1. Introduction
RF-excited plasmas are widely used for industrial etching and for the deposition of thin films. Radio-frequency-capacitively coupled plasmas (RF-CCP) can provide acceptable plasma uniformity over larger area substrates compared with high-density sources (VHF-CCP, inductively-coupled plasmas, helicon plasmas). However, for a given single excitation frequency, the plasma and ion current densities cannot be increased without also increasing the ion bombardment energy (IBE) [1–3]. For plasma etching applications unsynchronized multi-frequency excitation has been used to achieve some degree of independent control of ion flux and energy. Excitation frequencies separated by a factor greater than ten allow both high ion current density (controlled by the high frequency) and high ion bombardment energy (controlled by the low frequency). However, for deposition applications fast deposition requires a high plasma density, but high IBE leads to degradation of the deposited film quality limiting the process rate. High plasma density with low ion energy cannot be achieved with unsynchronized multi-frequency excitation. An alternative is the use of tailored voltage waveforms (TVWs), comprising multiple synchronized harmonics. Heil et al [4–6] demonstrated that waveforms comprising a single even harmonic (giving a temporally asymmetric waveform) leads to an unequal division of the voltages across the two sheaths, giving different IBEs at the two sides of the reactor, a phenomenon that has been called the electrical asymmetry effect (EAE). Experimental demonstration of self-bias on a two frequency system f + 2f (13.56 + 27 MHz) has confirmed this effect [7]. A TVW which contains more harmonics can produce an even stronger EAE [8–10]. The asymmetry can be observed by the dc self-bias that appears across the plasma. Preliminary measurements [11] of IBE have demonstrated the effect of increasing the number of harmonics. These results confirm particle-in-cell (PIC) model predictions that for a given peak-to-peak voltage (Vpp), as the number of harmonics increases, on one side the IBE remains low and approximately constant, whereas on the other side the IBE increases [12]. However, the modelled ion flux-distribution functions (IF-DFs) have not been compared in detail with experiment. Low-frequency (100 kHz–2 MHz) TVW biasing of substrates, in combination with a remote high-density plasma source, have been used to produce ion bombardment of a substrate with a specific energy for etching [13–15] or deposition applications [16]. In this case a rapid positive excursion of the electrode voltage allows neutralization of the positive charge accumulated on a dielectric substrate. In contrast, in the RF-CCP system studied in this work, the 15 MHz TVW serves both to produce the plasma and generate the EAE. Simulations by Schüngel et al [17] for two harmonics (13.56 + 27 MHz) have shown that the power deposited in the plasma, and hence the plasma density and ion flux, is independent of the relative phase. Lafleur et al [12] showed that the plasma density was unchanged by inversion of the polarity of the TVW (i.e. comparing positive (peaks) and negative (valleys) spikes). By contrast, increasing the number of harmonics leads to a higher electron density, a higher ion flux and a higher power deposition in the discharge [18]. This explains the higher deposition rate of µc-Si observed using a 4 harmonic TVW compared with a single-frequency (sine) waveform for the same Vpp [19]. This paper presents a detailed comparison between experiment and PIC simulations, using a wide range of diagnostics to measure the IBE, the ion current density, the electron density and the self-bias. The single-frequency case is used as a reference to compare with a TVW comprising 2–5 harmonics. When the simulation has been validated in this way it can provide data that are difficult to measure experimentally, such as the IF-DF integrated over all incidence angles.
1.1. Generation of tailored waveforms
The form of the TVWs was chosen to maximize the EAE. They take the form of either positive pulses (maximizing the negative self-bias), or negative pulses (maximizing the positive self-bias). In what follows, we shall refer to these as peaks and valleys, respectively. Since any periodic waveform can be decomposed into a Fourier series, the peaks and valleys voltage waveforms can be given by the sum of H individual harmonics, each with an amplitude Vn and phase θn:
A peaks waveform is obtained by setting the phases θn to zero for all harmonics, whereas a valleys waveform is obtained by setting θn to π. The amplitude of the harmonics is set according to equation (2) (adapted from [9]) which gives a constant peak-to-peak voltage, Vpp independent of the number of harmonics, H.

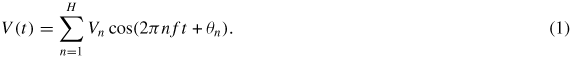
In this paper, we compare symmetric sine waveforms (H = 1) with asymmetric waveforms (peaks and valleys) composed of a varying number of harmonics (H = 2–5), see figure 1. In all experiments we use a fixed fundamental frequency of 15 MHz. The TVW waveforms were made by adding harmonics 2–5 at frequencies 30, 45, 60, 75 MHz. An Arbitrary Function Generator (AFG, Tektronix 3150) produces the input signal which is amplified by a broad band class A amplifier (Prana AP32GN310, 0.1–200 MHz, 1 kW). The amplifier is directly connected to the reactor (i.e. with no match box) through a cable via a 4.5 nF capacitor which blocks any dc current. The RF electrical schema is shown in figure 2(b), where the lower electrode is powered. A 100 : 1 voltage probe (Tektronix P5100) is used to measure the voltage directly near the edge of the RF electrode. The frequency response of the power generation system was corrected using the method based on the work of Patterson [20], whereby the phase and amplitude of each harmonic of the measured and target waveforms are compared in Fourier space, and an adjusted waveform correcting for the distortion is calculated. This adjusted waveform is then generated by the AFG and amplified.
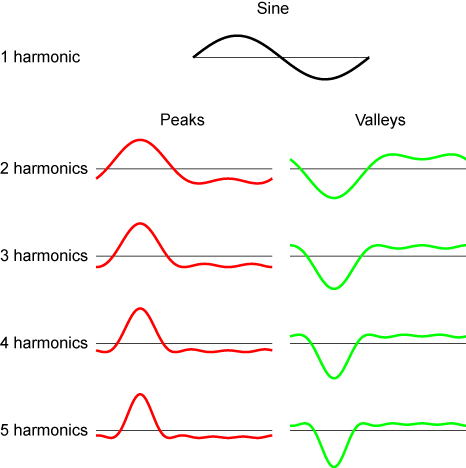
Figure 1. Sine waveforms and TVW peaks and valleys with 2–5 harmonics.
Download figure:
Standard image High-resolution image
Figure 2. DRACULA is a symmetric RF-CCP reactor composed of grounded electrode (top electrode) and a powered electrode (bottom). (a) Argon flow regulation. (b) RF system and feedback for voltage waveform tailoring. (c) Electrical schematic for measuring ion current density. (d) Electrical schematic for microwave reflectometry of the hairpin probe. (e) Mass spectrometer schematic.
Download figure:
Standard image High-resolution image1.2. Reactor layout and diagnostics
The diagnostics used in this work include an array of ion-flux probes, a microwave resonance hairpin probe, a current–voltage probe and a mass spectrometer with energy analyser, as described below.
Plasma reactor. The DRACULA (diagnostic reactor for capacitive large area) reactor is a cylindrically symmetric large area RF-CCP system, see figure 2. The powered electrode has a diameter of 50 cm. The effective area of the grounded electrode is defined by a Pyrex confining wall of internal diameter of 50.2 cm. Therefore, a slight geometrical asymmetry is present. The distance between electrodes is 2.5 cm. The base pressure of the reactor is 3 × 10⁻³ Pa, achieved with a turbopump backed by a rotary dry pump. The pressures used (3, 7 and 13 Pa) are set by regulating the input gas flow by means of a 100 sccm mass flow controller, see figure 2(a).
Ion current density probes. An array of 16 disc-shaped ion current probes, each with a diameter of 6 mm, is built into the grounded (top) electrode, distributed in a line across the diameter of the reactor. These probes, together with the bias and measurement circuit, are shown in figure 2(c). The current to each probe is measured sequentially by means of a multiplexer from the potential drop across a shunt resistor of 22 k Ω. The voltage drop across this resistor is sampled with a 12 bit data acquisition card over the range 0–5 V. A separate power supply applies a negative bias voltage to each probe large enough to repel electrons and thus ensure that each probe operates in an ion saturation regime. As the bias voltage becomes increasingly negative the ion saturation current also increases. This occurs because of expansion of the sheath around each probe with increasing bias. In order to estimate the true saturation ion current, two measurements are taken at −42 V and −30 V bias voltages, and the results extrapolated to 0 V.
Hairpin quarter wavelength resonator. We use a floating hairpin resonance probe to measure the local electron density [21]. The resonance frequency of the probe is measured by microwave reflectometry, a schematic of which is shown in figure 2(d). The resonance frequency is determined from the minimum in the reflected microwave signal. The hairpin is placed in the centre of the reactor, both vertically and horizontally. The hairpin tip is made from 125 µm diameter tungsten wire, and the probe tips are separated by 3 mm. The length of the hairpin is about 50 mm, giving a vacuum resonance frequency of 1.277 GHz. The hairpin is supported by a thin glass tube of 4 mm in diameter. The microwaves are inductively coupled to the hairpin by a small loop at the end of the coaxial line inside the glass tube. The hairpin is therefore isolated from dc current and thus charges up to the floating potential when a plasma is present. The electron density found from the hairpin was corrected to account for the presence of the sheath around each leg of the probe tip using the method proposed by Piejak et al [21].
Current–voltage probe. A current–voltage derivative probe (Solayl Vigiliant-VI), placed as close to the powered electrode as possible, is used to measure the RF current and voltage waveforms within the system. The measured signals are integrated, and scaled using a previously performed calibration [22], in order to obtain the true current and voltage at the measurement point.
Mass spectrometer. A Hiden EQP quadrupole mass spectrometer (QMS) is mounted at the axial centre of the grounded electrode, figure 2(d), and is used to measure IF-DFs. The orifice plate is coplanar with the upper electrode, and has a 50 µm diameter orifice. To avoid distortion of the observed IF-DF due to energy-dependent aberrations in the electrostatic ion optics, all the elements in the focusing region were set to the same potential (−40 V), thereby removing any focusing. In this case the effective ion acceptance half-angle is 0.66 °. Therefore, the measured IF-DF is the IF-DF of ions moving perpendicular to electrode. Since argon gas is used in this study, the QMS was set to detect Ar+ ions. A mass scan showed no other significant ion species, as expected.
1.3. PIC simulation
Simulations are performed using the PHOENIX 1D code previously described [12, 18]. The code simulates a one-dimensional geometrically symmetric RF-CCP reactor, together with an external circuit consisting of a bias capacitor and a voltage source. The top-hand electrode is grounded, while the bottom-hand powered electrode is connected to the capacitor and voltage source. The bias capacitor has a value of 10 nF m−2, while the voltage source is used to apply pulse-type tailored waveforms. The waveforms used are the idealized waveforms used in the experiment. Because of the bias capacitor, the voltage on the powered electrode is not defined explicitly, but must be calculated simultaneously from the simulated current allowing for the external circuit using the method proposed by Vahedi [23]. Since a small voltage is dropped across the bias capacitor, the voltage at the electrode is in general lower than that applied by the voltage source, but V0 is chosen so that the Vpp of the waveforms match that used in the experiments (i.e. 100 V). The electrode gap is set to 2.5 cm, and simulations are performed for argon pressures of 3, 7 and 13 Pa. The neutral gas is assumed spatially uniform with a temperature of 300 K, and collisions are treated with a null collision routine similar to that described in [23]. Electron–neutral collision cross-sections are taken from Phelps [24], and include elastic, excitation and ionization reactions, while ion–neutral collision cross-sections are taken from Phelps [25], and include isotropic and backward scattering reactions. Secondary electrons are emitted from the electrodes due to ion bombardment with a probability of 0.1, while the electron reflection coefficient used is 0.2 [1, 24, 26]. About 100 000–200 000 particles of each species (i.e. electrons and ions) are simulated, while the number of grid points used is around 400. The time step, Δt, is chosen so that the Courant condition, which ensures particles do not cross more than one cell per time step, is satisfied for electrons with energies up to 100 eV; the maximum expected due to secondary electrons accelerated across the fully expanded sheath. This requirement gives Δt ≈ 1 × 10⁻¹¹ s, and thus for the conditions simulated in this work, we have ωpeΔt = 0.01–0.03 (where ωpe is the electron plasma frequency), thus ensuring that any numerical heating is virtually eliminated. Simulations are run until equilibrium, which typically takes of the order of 1000 RF periods. The present PHOENIX 1D code has previously been benchmarked in argon with another similar PIC code in the literature [12], and also in helium [27]. Agreement between the different codes was within 1–2%.
2. Results
2.1. Voltage waveforms
A fundamental frequency of 15 MHz, and an amplitude Vpp of 100 V was used for all experiments, which gives a common element of comparison between the different waveforms. Because the DRACULA reactor does not have a matching network, Vpp = 100 V is approximately the largest voltage that can be applied when using a 5 harmonic peaks or valleys waveform. Figure 3 presents a typical example of an experimentally measured peaks waveform with 4 harmonics (H = 4), in two representations: real (time) space (figure 3(a)) and in Fourier space (figure 3(b)) for the phase and (figure 3(c)) amplitude. In figure 3(a) the measured waveform is shifted by the dc self-bias, equal to −31 V for this case. This self-bias appears as the amplitude of the zeroth harmonic in figure 3(b).
Figure 3. Different representations of a peaks TVW with four harmonics. (a) waveform, dashed black line for formula, red solid line for measurement. (b) phase and (c) amplitude of each harmonic.
Download figure:
Standard image High-resolution image2.2. Current waveforms
The Vigilant-VI probe allows the measurement of both the current and voltage waveforms. Figure 4 shows the measured and simulated current waveforms for 1–4 harmonics peaks waveforms at 7 Pa. Because of the absence of a matching network, the standing wave ratio in the rf transmission line is very large, leading to possible standing wave effects in the current and voltage. Thus, a direct comparison of the absolute value of the experimental and simulated currents is difficult. For this reason the amplitude of the simulated current waveform is adjusted to fit the experimental measurements. The overall agreement of the shape of the current waveforms is seen to be very good for all cases. Since the impedance of the reactor is expected to be dominated by capacitive reactance (in both experiment and simulation), the current waveform is essentially proportional to the derivative of the applied voltage waveform.
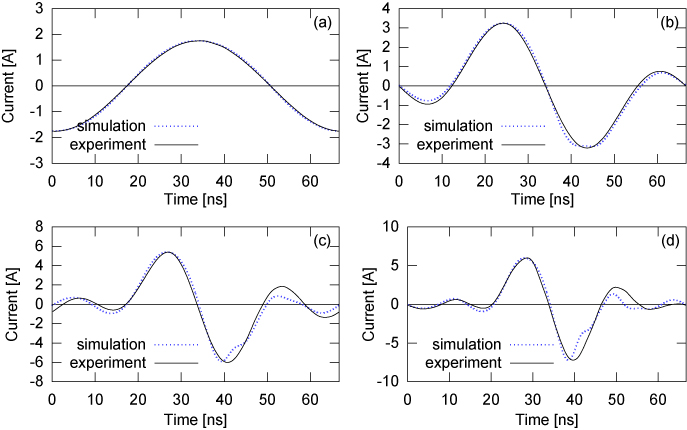
Figure 4. Current waveforms (solid line for experiment and dashed for simulation) over one period for (a) 1 harmonic, (b) 2 harmonics, (c) 3 harmonics and (d) 4 harmonics.
Download figure:
Standard image High-resolution image2.3. Electron density
In order to simplify the interpretation of the results presented in figures 5–14, we make use of a common key, defined in table 1. We use a black circle for sine waveforms, a red upwards pointing triangle for peaks waveforms and a green downwards pointing triangle for valleys waveforms. Experimental points have closed markers, while the PIC simulation points use open markers. For all conditions, the measured electron density is around or below 1015 m−3. The electron density increases both with the number of harmonics and with the pressure, as shown in figure 5(a) for 3 Pa, figure 5(b) for 7 Pa and figure 5(c) for 13 Pa. The electron density is similar for both peaks and valleys waveforms, as is expected due to the geometrical symmetry of the CCP reactor. From 1 to 5 harmonics the measured electron density increases by a factor of about 10. Between 3 and 13 Pa, the measured electron density increases by around 8 for a sine waveform, 2.2 for 2 harmonics and 1.8 for 4 harmonics. However, the measurement of low electron densities gives larger uncertainties because (1) the hairpin resonance frequency is very close to the vacuum resonance frequency (the error is estimated to be about ∼20%) and (2) the correction for the effect of the sheath around the hairpin probe wires becomes large and more uncertain when the sheath width becomes comparable to the hairpin separation. When the number of harmonics is high (5 harmonics or 4 harmonics at 13 Pa), the presence of higher order harmonics (distortion) appears to enhance the power deposition in the plasma. For all pressures the electron densities predicted by the PIC simulations were in the same range as those of the experimental measurements. The simulations show the same trend for the increase in the electron density with the number of harmonics, although the rate of increase is lower than that observed in the experiment; this is most likely due to the enhanced electron heating in the experiment due to higher harmonic distortion. Note that due to the perfect geometrical symmetry in the simulations, peaks and valleys waveforms give formally identical electron densities at the reactor centre. However, because the hairpin probe is slightly off-center, for a better comparison with experiment, the simulation densities were taken at the same spatial location as the probe (which depends on whether a peaks or valleys waveform is applied).
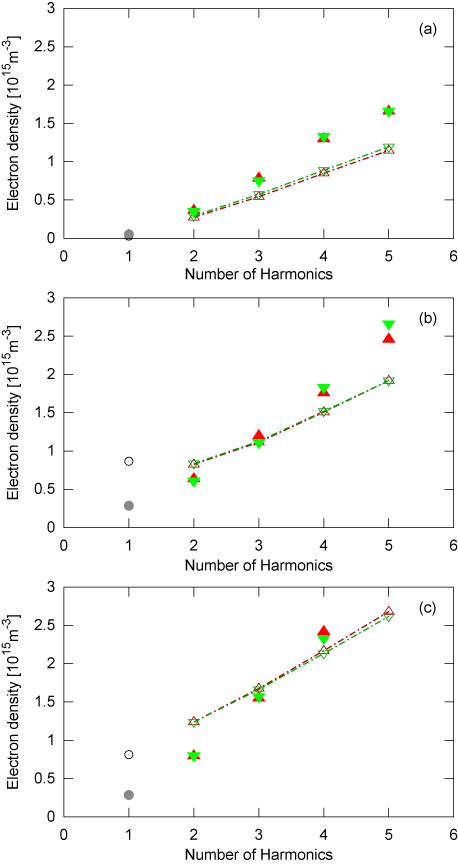
Figure 5. Electron density as a function of number of harmonics at pressures of: (a) 3 Pa, (b) 7 Pa and (c) 13 Pa.
Download figure:
Standard image High-resolution image
Figure 6. Ion current density as a function of number of harmonics for pressures of: (a) 3 Pa, (b) 7 Pa and (c) 13 Pa.
Download figure:
Standard image High-resolution image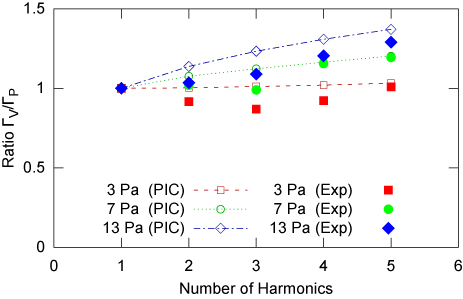
Figure 7. Ratio of the ion current density to the grounded electrode for a valleys waveform relative to a peaks waveform, as a function of the number of harmonics for different pressures: 3 Pa (square), 7 Pa (circle) and 13 Pa (diamond).
Download figure:
Standard image High-resolution image
Figure 8. Self-bias as a function of number of harmonics for pressures of: (a) 3 Pa, (b) 7 Pa and (c) 13 Pa..
Download figure:
Standard image High-resolution image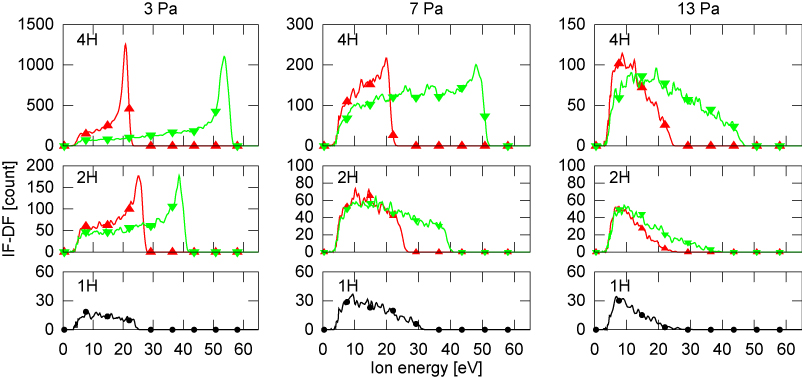
Figure 9. Measured IF-DF restricted to ions perpendicular to electrode.
Download figure:
Standard image High-resolution image
Figure 10. Simulated IF-DF restricted to ions perpendicular to electrode.
Download figure:
Standard image High-resolution image
Figure 11. Average IBE as a function of number of harmonics for pressures of: (a) 3 Pa, (b) 7 Pa and (c) 13 Pa.
Download figure:
Standard image High-resolution image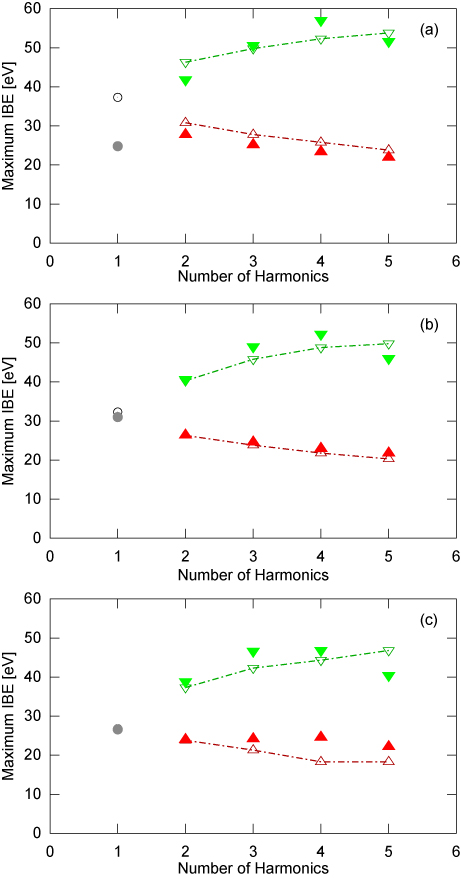
Figure 12. Maximum IBE as a function of number of harmonics for pressure (a) 3 Pa, (b) 7 Pa and (c) 13 Pa.
Download figure:
Standard image High-resolution image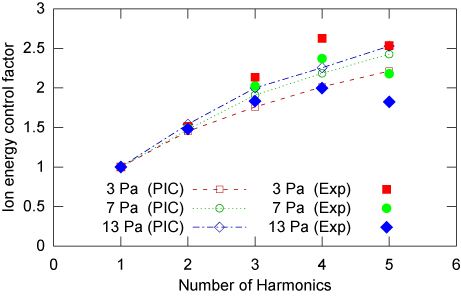
Figure 13. Maximum ion energy control factor according to the number of harmonics for different pressures, 3 Pa (square), 7 Pa (circle) and 13 Pa (diamond).
Download figure:
Standard image High-resolution image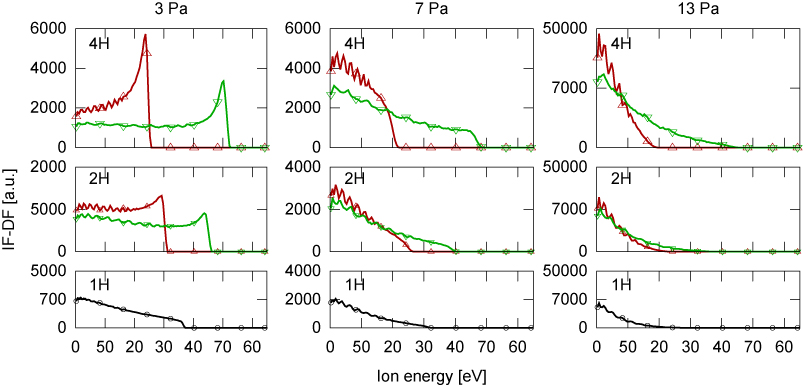
Figure 14. Simulated IF-DF for ions incident at all angle.
Download figure:
Standard image High-resolution image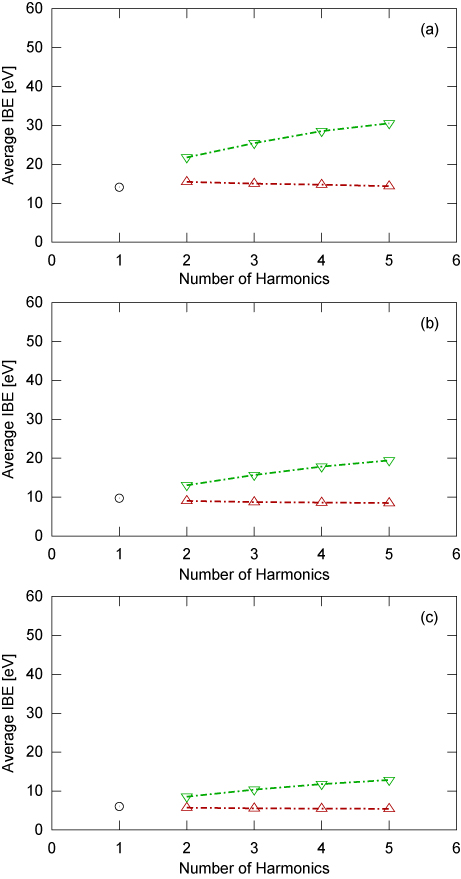
Figure 15. Simulated average IBE for ions incident at any direction as a function of number of harmonic for pressures (a) 3 Pa, (b) 7 Pa and (c) 13 Pa. peaks and valleys branches splits as the number of harmonics increase. Average IBE is lower at high pressure.
Download figure:
Standard image High-resolution image
Table 1. Common key of graphs.
 |
2.4. Ion current density
Figure 6 shows the ion current density measured at the grounded electrode for both peaks and valleys waveforms. The ion current density increases monotonically with the number of harmonics, as expected due to the increased electron density seen in figure 5. The ion current density of the peaks and valleys is approximately equal at 3 Pa (see figure 6(a)), but becomes higher for valleys at the higher pressures. This effect becomes very pronounced at 13 Pa, as can be seen in Fig. 6(c). Between 3 and 13 Pa, the ion current density increases by a factor of 2 for sine, by 30% for 2 harmonics and by 10% for 4 harmonics. The increase in ion flux with pressure is less marked than the increase in electron density. The simulations predict ion current densities about 40% lower than the experiment for all pressures, although the pressure dependence is similar. The larger ion current densities observed in the experiment can most likely be explained because of two reasons: (1) secondary electron emission from the ion-flux probes which result in an overestimation of the true ion current and (2) sheath expansion around the ion-flux probes. Since secondary electron emission coefficients are typically of the order of 0.1 for most metals, (1) is expected to have only a small effect. The sheath expansion (2) has already been compensated for by a linear extrapolation as described above. However, the observed discrepancy may suggest that this linear extrapolation is not sufficient at low biases.
 is the ratio of the ion current density to the grounded electrode excited by a valleys waveform, to the ion current density to the grounded electrode for a peaks waveform. Since the reactor is geometrically symmetric to a good degree, a ratio of
larger than one indicates that for a peaks waveform there would be a larger ion current density to the powered electrode (if it could be measured) than to the grounded electrode. For 3 Pa the ratio is close to or slightly below 1, but at 7 and 13 Pa the ratio increases with the number harmonics reaching about 1.2–1.3 for 5 harmonics. These results are in very good agreement with the PIC simulation, which gives similar ratios over the whole range. This asymmetry in the ion current density was first predicted by Lafleur et al [12], where it was demonstrated that enhanced ionization occurs around the sheath with the larger voltage drop at higher pressures (and with more harmonics) because the electron mean free path is smaller. This asymmetric ionization then causes an increase in the ion flux to this electrode.
is the ratio of the ion current density to the grounded electrode excited by a valleys waveform, to the ion current density to the grounded electrode for a peaks waveform. Since the reactor is geometrically symmetric to a good degree, a ratio of
larger than one indicates that for a peaks waveform there would be a larger ion current density to the powered electrode (if it could be measured) than to the grounded electrode. For 3 Pa the ratio is close to or slightly below 1, but at 7 and 13 Pa the ratio increases with the number harmonics reaching about 1.2–1.3 for 5 harmonics. These results are in very good agreement with the PIC simulation, which gives similar ratios over the whole range. This asymmetry in the ion current density was first predicted by Lafleur et al [12], where it was demonstrated that enhanced ionization occurs around the sheath with the larger voltage drop at higher pressures (and with more harmonics) because the electron mean free path is smaller. This asymmetric ionization then causes an increase in the ion flux to this electrode.
2.5. Self-bias
The dc self-bias voltage is an externally observable, non-invasive measurement of the unequal division of the sheath voltages. Figure 8 shows the self-bias for the sine, peaks, and valleys TVWs measured experimentally, and simulated for all three pressure cases. Since the simulation uses a truly geometrically symmetric reactor, the peaks and valleys waveforms must give anti-symmetric results, and thus only one set of simulations is performed. A limited number of tests were, however, carried out to check this. The overall agreement between simulation and experiment is excellent, although there is a slight difference due to the residual geometrical asymmetry of the experimental reactor, which results in a shift of about −1.7 V for the sine case. At 7 Pa (see figure 8(b)), the self-bias starts from ±13.7 V for the simulations and −17.5 V, 13.2 V for the experiments with 2 harmonics, to about ±26.4 V for the simulations and −31 V, 27.5 V for the experiments with 4 harmonics. The measured self-biases for 5 harmonic TVWs are lower than predicted by the simulation (±29 V) because of the onset of distortion of the experimental waveforms, as mentioned above. The measured self-bias is independent of pressure for 2 harmonic TVWs, but decreases by about ∼30% between 3 and 13 Pa for 4 harmonics. The simulated self-bias decrease with pressure is 9% between 3 and 13 Pa for both 2 and 4 harmonics. From these results we see that the self-bias tends to weaken at higher pressures. In the framework of the Bochum theory of EAE [5–8, 28], the lower self-bias at higher pressure may be interpreted as a sign of lower self-amplification of electrical asymmetry because of higher collisionality in the sheath.
2.6. IF-DF
The IF-DF is the distribution function of ions collected at the electrodes. As shown by Ellmer et al [29], mass spectrometers do not measure the IEDF, but rather the ion velocity distribution function in the forward direction, in units of energy. This distinction is important [30] when comparing experimental (figure 9) with simulation results (figure 10). In this study, the ion focusing electrodes were turned off to avoid any chromatic aberrations [30]. Therefore, the effective ion acceptance angle of the spectrometer is very narrow (<0.66 °). To model this narrow acceptance angle within the simulations, the velocity vector of all ions that strike the electrodes is measured, and only ions whose trajectory lies within this narrow cone are counted. This effectively restricts the collected ions to those moving close to perpendicular to the electrode. As a result of this narrow acceptance angle, both the experimental and simulation count rates are low (and hence the statistical noise is higher), especially at higher pressures, where collisions scatter the ions to large angles more frequently. In figures 9 and 10, each column presents a different pressure (3, 7 and 13 Pa from left to right) and each line represents five IF-DFs ordered as follows: 4 harmonics (peaks and valleys) at the top, then 2 harmonics (peaks and valleys) in the centre, and finally 1 harmonic (sine) at the bottom. The agreement between experiment and simulation is excellent for almost all cases. The shapes of the experimental and simulated IF-DFs are very close for all waveforms at all pressures. In figure 9, the y-axis refers to the absolute ion count by the mass spectrometer during a fixed time for a given energy window. The scale of the simulations results in figure 10 is adjusted to match the experimental data. For a sine waveform (1H in figure), there is only one IF-DF corresponding to a symmetric waveform (the IBE is the same at both sides). For a 2 harmonics TVW (2H in figure), the two IF-DFs corresponding to opposite waveform peaks and valleys produce IF-DFs with similar shapes but different maximum IBEs. The shift of the maximum IBE (peaks versus valleys) is higher for 4 harmonics (4H in figure), as expected due to the larger measured dc self-bias. This effect is present at all pressures. We emphasize again that because of the geometrical symmetry of the reactor, applying peaks and valleys waveforms reverses the role of the electrodes, thus allowing us to effectively determine the ion distribution at both electrodes. At 3 Pa the IF-DFs show a well-defined peak for 4 harmonics, a smaller peak for 2 harmonics and no peak for sine excitation. Because we can only detect ions with trajectories that are very close to the perpendicular direction, ions which have undergone elastic collisions will not be detected because they will be deviated beyond the detection angle. As the pressure increases, the probability of ion collisions in the sheath increases, explaining the lower count rate at higher pressures in figure 9. There are some minor differences between the experimental and simulation data. The small peak of the experimental IF-DF at 7 Pa and 4 harmonics is not seen in the simulation. Furthermore, in all experimental data the IF-DF is truncated below about 4 eV (presumably an instrumental artefact) whereas the simulated IF-DFs show a more moderate and continuous increase in the IF-DF from 0 eV. Since the experimental and simulated plasma densities are slightly different, the sheath widths will also be different, which will further affect the motion of ions as they cross the sheath to the mass spectrometer, and hence modify the distribution functions slightly.
2.7. Average and maximum IBE
The complex shape of the IF-DFs can be characterized with two parameters; the average IBE and the maximum IBE. The average IBE is representative of the global IF-DF and is an important quantity in material processing. In figure 11, as the number of harmonics increases, the peaks and valleys branches split. The average IBE of the peaks waveforms is lower than the average IBE of the valleys waveforms, by a factor of around 2.5 for 4 harmonics. This difference in IBE occurs for essentially two reasons: (1) reduced ion collisions in the sheath and (2) the change in the time-averaged voltage dropped across each sheath [12]. As seen in figure 5, as H increases, the electron density also increases. Thus, the width of the sheaths near the electrodes decreases [9, 12], and therefore the collision probability of an ion traversing the sheath is reduced. This acts to increase the average IBE. For a valleys waveform, as H increases, the time-averaged voltage drop across the sheath at the grounded electrode increases, while for a peaks waveform it decreases [12]. This thus acts to increase the average IBE for a valleys waveform, but decreases the average IBE for a peaks waveform. When including the effect of the smaller sheath width together with this change in sheath voltage, the net result is that the average IBE for a valleys waveform increases (since both effects act to increase the IBE), while the average IBE remains relatively constant for a peaks waveform (since both effects are now in opposition). The average IBE strongly reduces with pressure (see figures 11(a)–11(c)), as is expected due to increased collisions within the sheaths. The agreement between experiment and simulation is excellent at 7 and 13 Pa. At 3 Pa, the experimental peaks branch is slightly lower than the simulated branch, while the experimental valleys branch is lower for 2 harmonics and higher for 4 harmonics. The maximum IBE is an important parameter for materials processing applications where a threshold IBE is required (such as in deposition [31]). Unlike the average IBE, the measured maximum IBE is not affected by the acceptance angle of the mass spectrometer. Therefore, the results in figure 12 are representative of the maximal IBE considering all bombarding ions. The maximum IBE is higher for the valleys branch than the peaks branch at all pressures, as expected from the IF-DFs, and the measured dc self-biases. At 7 Pa, the measured maximum IBE for a sine waveform is 31 eV (the simulation gives 32.2 eV). The maximum IBE for peaks is 26.5 eV (equal for the simulation) for 2 harmonics and 23 eV (22 eV from the simulations) for 4 harmonics. The maximum IBE for valleys is 40.5 eV (same for the simulations) for 2 harmonics and 52 eV (49 eV from the simulations) for 4 harmonics. The experimental maximum IBE for peaks is slightly lower than that of the simulation at 3 Pa but slightly higher at 13 Pa. After averaging all of the results, the maximum IBE of the experiment is about 1.7 V lower than the maximum IBE of the simulations. This value is in excellent agreement with the measured dc self-bias due to the residual geometric asymmetry of the reactor.
2.8. Ion energy control factor
In order to quantify the degree of control of the IBE that can be achieved by a TVW with multiple harmonics, we define the maximum ion energy control factor
 as the ratio of the maximum IBE for a valleys waveform of H harmonics
 , to the maximum IBE of a peaks waveform
 :
:
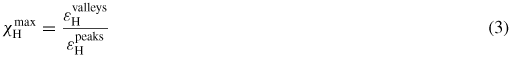
Figure 13 shows
as a function of H for each of the different pressure cases, and for both experiment and PIC simulation. For 2 harmonics the maximum ion energy control factor is about
 for all pressures, while for 4 harmonics,
 shows a slight dependence on pressure, and at 7 Pa is around 2.3. Thus, using 4 harmonics allows a greater control of the maximum IBE than a 2 harmonics waveform. The PIC simulations give similar results. The maximum ion energy control factor is similar in its definition to the (average) ion energy control factor χ
 with our notation used here) defined in [9], which corresponds to the ratio of the average IBE of a valleys waveform to the average IBE of a peaks waveform. The true average ion energy is however difficult to obtain experimentally when compared with the maximum ion energy, since it requires knowledge of the full IF-DF.
3. Discussion
3.1. Distortion
Under most of the experimental conditions used, the measured waveform is approximately equal to the desired waveform for H = 1–4. However, with 5 harmonics (and at 13 Pa, 4 harmonics), higher order harmonics are generated within the plasma, which distort the applied voltage waveforms. Since these distortions occur at frequencies higher than those applied, the waveform correction program cannot remove them since they are self-generated by the plasma. The main consequence of this distortion is a reduction in the dc self-bias, and a lower difference between the IBE of the peaks and valleys waveforms. This then naturally leads to a reduction in the ion energy control factor.
3.2. Comparison of self-bias with the literature
In [9], the authors performed detailed PIC simulations using waveforms composed of multiple harmonics; some of which are similar to the peaks and valleys used here. Using a model for the EAE, together with PIC simulation results, the authors investigated the effect on the bias voltage with an increasing number of applied harmonics (see for example figure 3 in this reference). Here they found that after an initial sharp rise, the bias begins to saturate with further harmonics. Here they found that after an initial sharp rise, the bias begins to saturate with further harmonics. Although these PIC simulations were performed at a higher pressure than that used here (100 Pa), the lack of secondary electrons in their simulations suggests that the recently predicted reduction in EAE would not occur [32]. In [32] it was found that the EAE is significantly reduced when secondary electrons play a major role in the ionization dynamics, which in a high-frequency regime typically occurs at high pressures. Although these simulations used only dual-frequency waveforms, it is very likely that the multi-frequency waveforms in [9] would be similarly affected. In the experiments and simulations in this work, the pressure and applied voltage are sufficiently low that secondary electrons do not play a major role (confirmed by a number of PIC simulation tests). Thus we are able to make a reasonable comparison of our work with that in [9]. Modifying the data from figure 3 of [9] (which is normalized by the sum of voltage amplitudes of each harmonic), for 2 harmonics they predict a normalized self-bias (normalized now with respect to the peak-to-peak voltage) of about 17%, and for 4 harmonics, 28%. These values are in close agreement with those found in this study (see figure 3) for both experiment and simulation.
3.3. Complete IF-DF
The simulated IF-DFs in figure 10 were performed using a simple method to model the narrow acceptance angle of the mass spectrometer. Comparison of these results with those obtained experimentally showed excellent agreement for almost all cases. This shows that the simulated IF-DF can accurately predict the ion distribution in the forward direction. Although focusing was turned off to avoid any possible chromatic aberration, optimization of the lens voltages is possible to prevent this [30]. This typically requires ion optics simulations and specific dimensional details of the device being used. However, even with proper focussing, a mass spectrometer cannot in general measure the ion distribution for all ion incidence angles on the electrode. In the simulations however, the complete IF-DF is easy to obtain, since any ions that strike the electrode per time step can be counted. Knowledge of the complete IF-DF is very important for material processing, because every ion that strikes the surface plays a role in the surface processes. Because of the good agreement between experiment and simulation for the narrow angle results, this suggests that we can have confidence in the predictive power of the complete simulated IF-DFs.
Figure 14 shows the full IF-DF of all ions simulated by the PHOENIX 1D code. The IF-DF scale is the same as in figure 10, but the count rate is much higher because all ions that strike the electrodes are now included.
Comparison of figure 14 with figure 10 shows remarkable differences in the shape and structure of the IF-DFs for both peaks and valleys, particularly at low energies. This more significant lower energy region occurs because of ion–neutral collisions within the sheath, which tend to scatter the ion velocity vector away from normal incidence. Since the acceptance angle of the mass spectrometer is very narrow, most of these ions will not be detected. Some features in the IF-DFs however, especially at the low pressure where collisions are less frequent, are similar for both narrow and full IF-DFs.
Figure 15 shows average IBE from simulated full IF-DF (figure 14). The average is done over the whole population of bombarding ions. Compared with figure 11 done on a subset of bombarding ions within a narrow acceptance angle, the average IBE of all incoming ions is lower because of the greater contribution of the lower energy ions. We note, however, that a major conclusion concerning the ion energy remains unchanged: as the number of harmonics increases, the average IBE on one of the electrodes remains low and approximately constant.
3.4. Power coupling
From VI probe measurements previously made [22] of the impedance for each harmonic (under similar operating conditions to those used here), the standing wave ratio is typically of the order of 100, thus giving a reflected power around 90–95%. At present this means only about 5–15 W of power is deposited within the plasma. Thus, currently the multi-frequency approach described here is not very efficient, and it remains a technical challenge to match the additional frequencies.
4. Conclusion
In this work, we have studied the effect of the number of harmonics in the excitation waveform, on an argon plasma in a geometrically symmetric RF-CCP reactor. The constant parameter we have chosen for comparison is Vpp, which was fixed to 100 V, and two main types of waveform were used; peaks and valleys. Using a range of different diagnostics, we have performed measurements of the electron density, ion flux, dc self-bias and IF-DFs, and compared these with results obtained from a PIC simulation for the same operating conditions. Both the simulation and experimental results are in good agreement, and demonstrate that the electron density and ion flux increase as more harmonics are added, but that the dc self-bias begins to saturate. By observing the IF-DFs, we find that both the maximum, and average, ion energy on one of the electrodes increases, while it remains approximately constant on the other electrode. These results mean that compared with a single-frequency sinusoidal excitation, the application of more harmonics in a TVW allows for better control over the ion flux and ion energy; by increasing the number of harmonics the ion flux can be increased (and hence the process time decreased) while the average IBE on one of the electrodes can be kept low and constant. At present, low power transfer efficiency due to the absence of any impedance matching and distortion of the TVWs with 5 harmonics (and 4 harmonics at 13 Pa) is the main experimental limitation.
Acknowledgments
The authors would like to thank Jean-Christophe Dornstetter, Deborah O'Connell, and Timo Gans for help with the Hiden Mass Spectrometer, and Jean Guillon for technical assistance. The work presented herein was funded by the CNRS (Project PIE STEP-UP), by the ANR (CANASTA Project no ANR-10-HABISOL-002), as well as through the 'Bourse Thèse Energie Renouvelable', a doctoral bursary from Ecole Polytechnique.