


ABSTRACT
The white-light corona (WLC) during the total solar eclipse on 2010 July 11 was observed by several teams in the Moon's shadow stretching across the Pacific Ocean and a number of isolated islands. We present a comparison of the WLC as observed by eclipse teams located on the Tatakoto Atoll in French Polynesia and on Easter Island, 83 minutes later, combined with near-simultaneous space observations. The eclipse was observed at the beginning of the solar cycle, not long after solar minimum. Nevertheless, the solar corona shows a plethora of different features (coronal holes, helmet streamers, polar rays, very faint loops and radial-oriented thin streamers, a coronal mass ejection, and a puzzling "curtain-like" object above the north pole). Comparing the observations from the two sites enables us to detect some dynamic phenomena. The eclipse observations are further compared with a hairy-ball model of the magnetic field and near-simultaneous images from the Atmospheric Imaging Assembly on NASA's Solar Dynamics Observatory, the Extreme Ultraviolet Imager on NASA's Solar Terrestrial Relations Observatory, the Sun Watcher, using Active Pixel System Detector and Image Processing on ESA's PRoject for Onboard Autonomy, and the Naval Research Laboratory's Large Angle and Spectrometric Coronagraph on ESA's Solar and Heliospheric Observatory. The Ludendorff flattening coefficient is 0.156, matching the expected ellipticity of coronal isophotes at 2 R☉, for this rising phase of the solar-activity cycle.
Export citation and abstract BibTeX RIS
1. INTRODUCTION
The shape and physical structure of the white-light corona (WLC) are governed by large-scale magnetic fields of the Sun that still cannot be directly measured. It is well known that the shape of the WLC is sensitive to the phase of a solar cycle (Golub & Pasachoff 2010; Pasachoff 2009a, 2009b). The onset of the present cycle (24) was quite peculiar in the sense that although the activity in the photosphere was very low, the WLC exhibited a remarkably rich and variegated structure.
We present here the results of the observations of the WLC during the 2010 July 11 total solar eclipse, which were carried out by two teams at two distinct locations in the Pacific Ocean: one at the small atoll of Tatakoto, some 1200 km east of Tahiti, and the other at Easter Island (the time difference between the two sites is about 1 hour and 23 minutes). Some of these results are also compared with the corresponding space-borne observations.
Our comparisons are similar in method to those we reported from pairs of observing sites during the 2006 eclipse (Pasachoff et al. 2007, 2008) and during the 2008 eclipse (Pasachoff et al. 2009), but at a different phase of the solar-activity cycle, with a different configuration of the corona, and with an erupting coronal mass ejection (CME), while taking advantage of new solar spacecraft and new configurations, including instruments on NASA's Solar Dynamics Observatory (SDO) and ESA's PRoject for Onboard Autonomy (PROBA2) as well as full-Sun coverage, including the whole far side, from NASA's Solar Terrestrial Relations Observatory (STEREO), which also supplied outer coronal views from its pair of perspectives.
2. BASIC INFORMATION ON THE 2010 JULY 11 ECLIPSE OBSERVATIONS
The path of totality stretched over thousands of kilometers of ocean, making landfall in the Cook Islands, Easter Island, a number of French Polynesian atolls, and the southern tip of South America. The weather conditions at Easter Island were excellent. There were rolling clouds during totality at the Tatakoto atoll, so only a part of totality could be observed.
2.1. Tatakoto (Tuamotu Archipelago) Observations
The observation site at the atoll of Takakoto in French Polynesia was located at 139°20'0 3 W and 17°20'393 S. The observations were carried out with seven telescopes whose focal length varied from 70 mm to 1640 mm. Figure 1 (top) illustrates the fine structure of the WLC processed by Druckmüller's method (Druckmüller et al. 2006; Pasachoff et al. 2006; Druckmüller 2009) from the data taken from this observing site.
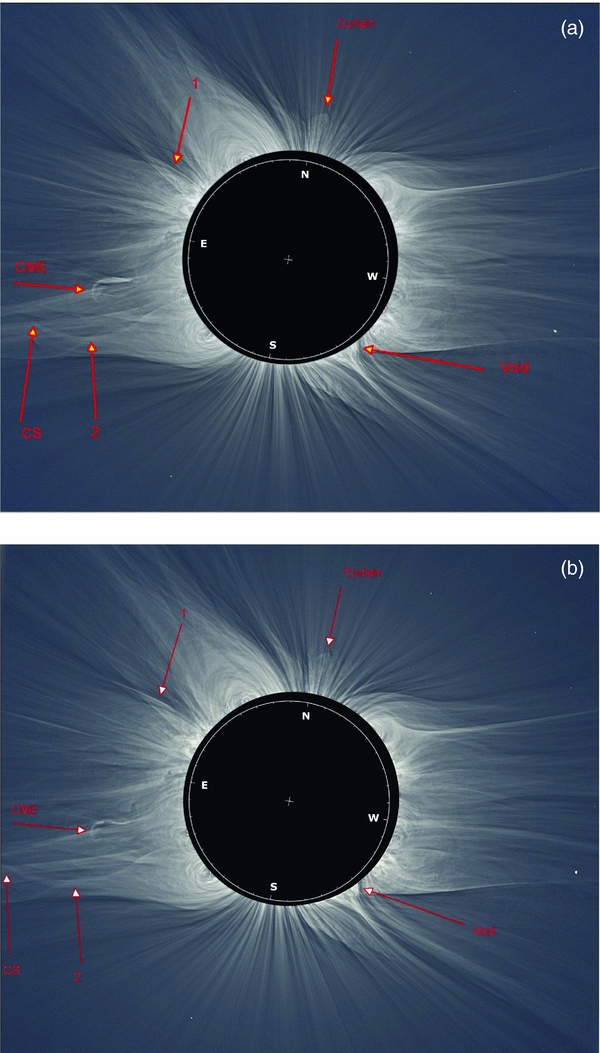
Figure 1. Computer-processed images of the WLC taken at Tatakoto (top) at 18:48:00 UT and Easter Island (bottom) at 20:11 UT. Positional angles are shown on the solar limb (the white circle). The marks are explained in the text. (Images (top): Miloslav Druckmüller, Martin Dietzel, Shadia Habbal, & Vojtech Rušin; (bottom): Jay M. Pasachoff, Hana Druckmüllerová, Muzhou Lu, & Craig Malamut.)
Download figure:
Standard image High-resolution image2.2. Easter Island Observations
Our observation site at Easter Island, which is administered by Chile, was located at 109°19'23'' W and 28°04'26'' S. The observations were carried out by four cameras whose focal length varied from 400 mm to 1200 mm, and one TeleVue telescope with a focal length of 1200 mm. Figure 1 (bottom) illustrates the fine structure of the WLC processed by Druckmüller's method (Druckmüller et al. 2006; Druckmüller 2009) from the data taken from this observing site.
3. PROMINENT FEATURES OF THE STRUCTURE OF THE WLC
As a first approximation, the 2010 July 11 WLC can be regarded as a transitory type with very pronounced coronal holes filled with a number of polar rays or plumes. The most remarkable of them is the hole above the north pole (extending over P.A.s clockwise from 342° to 10°), and that situated above the south pole (166°–196°). The bright, curved structures that make the apparent hole above the south pole are almost certainly large, closed loops rooted along the boundary of the south polar hole, as shown in Figure 4. Moreover, a couple of prominences seen at 218° and 224° are associated with an apparent mini-helmet streamer whose rays seem to follow the shape of polar rays located above. It is an example of a pseudostreamer (Wang et al. 2007) separating the positive-polarity south polar hole from a lower latitude hole of the same polarity. The lower latitude hole was located near central meridian on July 3 (see the Atmospheric Imaging Assembly (AIA) 193 Å image at http://sdowww.lmsal.com/suntoday). Pseudostreamers overlie two polarity-inversion lines, and thus contain double arcades with two filaments.
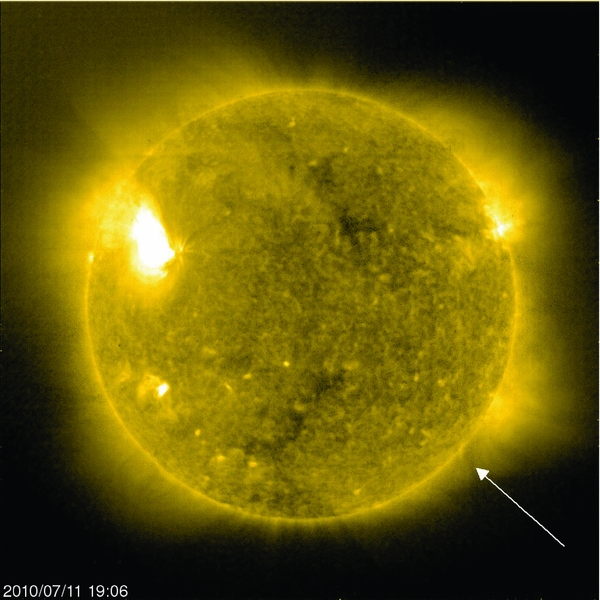
Figure 2. Image of the 28.4 nm EUV corona. An arrow denotes the approximate position of the coronal void. Unusually, it is cusp shaped, like a helmet streamer and unlike most cavities. Perhaps most of this feature is on the far side of the Sun. (Courtesy: ESA/NASA/SOHO/EIT)
Download figure:
Standard image High-resolution image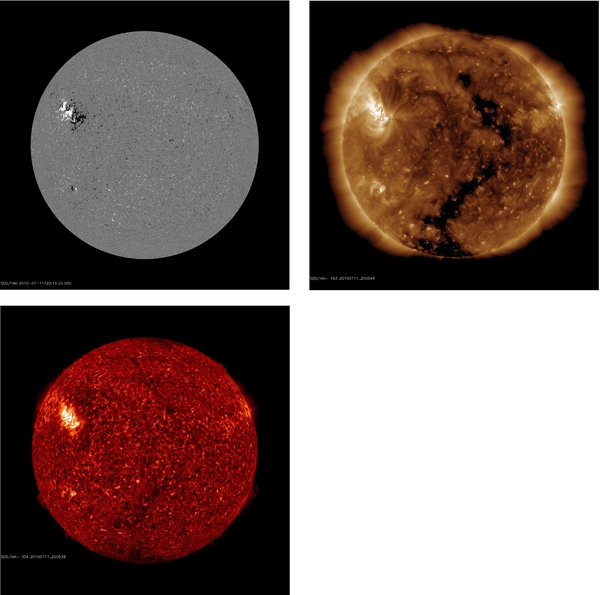
Figure 3. Spatial distributions of solar surface magnetic fields (upper left) and active regions seen in Fe xii at 193 Å, 1,600,000 K (upper right), and in He ii at 304 Å (lower left) observed with NASA's SDO (HMI for the magnetic field and AIA for the other images) at the time of the Easter Island eclipse. A large coronal hole sweeps from the north pole to the south pole, where it meets a pronounced polar coronal hole. The active regions and associated systems of magnetic loops are also discernible from PROBA2/SWAP corona observations (Figure 5(a)). A full set of AIA/SDO images from close to eclipse time is available in the supplemental documents. (Courtesy: SDO/LMSAL/NASA.)
Download figure:
Standard image High-resolution image
Figure 4. Coronal field line configuration, as viewed from Earth, at 20:00 UT on 2010 July 11, superposed on the edge-enhanced eclipse image of Figure 1 (bottom). The coronal field was derived by applying a PFSS extrapolation (Schatten et al. 1969) with Rsource-surface = 2.5 R☉, to the NSO photospheric magnetic field map for CR2098 (from 2010 June 16 to July 13). The field lines are color-coded as in Figure 6 of Wang et al. (2007): open field lines are coded blue (green) if directed outward (inward); closed field lines are orange if they extend beyond r = 1.5 R☉, red otherwise. Black, dark gray, light gray, and white denote areas of the photosphere where Br < −6 G, −6 G < Br < 0 G, 0 G < Br < +6 G, and Br > +6 G, respectively, where Br denotes the radial component of the photospheric field averaged over 5° pixels, which is adequate resolution for capturing large-scale structures like streamers and coronal holes. (Hairy-ball plot by Y.-M. Yang based on photospheric field data from NSO; composite created by Zuzana Kaňuchová, Astronomical Institute, Slovak Academy of Sciences.)
Download figure:
Standard image High-resolution imageNext, there are two remarkable systems of helmet streamers. The first one is located in the region spanning from 10° to 55°; its base is endowed with several small and rather inconspicuous prominences like those located at 34° and 75°. The second, bigger chain of streamers is seen from 96° to 165° with many associated tiny prominences located at 104°, 121°, and 143°; in the last two positions one can recognize apparent pairs of prominences separated from each other by about 5°. The region in between, i.e., from 55° to 96°, features quite a few polar rays, yet their feet are hardly discernible. This type of large, fan-like structure occurs when the axis of the streamer arcade lies in the sky plane rather than being perpendicular to it (see, e.g., Figure 10 in Wang et al. 2007). In this case, there is a large "face-on" pseudostreamer at the northeast limb, which blends with the active-region loops rooted just in front of the east limb.
Another noteworthy location is that between 235° and 272°, which is characterized by an aggregate of radially oriented rays not forming a classical helmet streamer; this apparent feature can be due to the presence of several irregularly spaced prominences associated with fans of loops at 242°, 253°, 308°, and 320°. A large, slow streamer blowout occurred here earlier on eclipse day, and can be seen in a Large Angle and Spectrometric Coronagraph Experiment (LASCO) C2 running-difference movie; it explains the "opened-up appearance." An apparently onion-like helmet streamer anchored at 298°–328° and linked with two prominences at 308° and 328° also deserves attention. This feature is another pseudostreamer, separating the negative-polarity north polar hole from a small negative-polarity hole at lower latitude (see the hairy-ball plot). The equatorial hole can be seen at disk center on July 5 in the AIA 193 Å image at the LMSAL Suntoday Web site.
The bases of the helmet streamers exhibit coronal cavities located at P.A.s 32° and 144°, which are also easily discernible from the pictures of the corona as imaged with the AIA on NASA's SDO (AIA/SDO) and subsequently processed with the equivalent of a radially graded filter (see Figures 5, 6, and 9). Another cavity is associated with the onion-like helmet streamer at PA 320°.
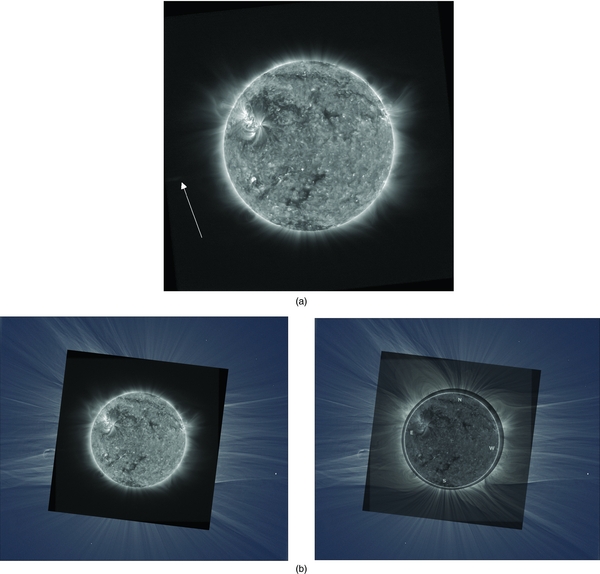
Figure 5. (a) Composite of fifty 10 s SWAP images acquired during a 60-minute window surrounding the 18:50 UT eclipse observation, showing the full extent of the corona as seen in SWAP's 174 Å passband. The arrow points to the lower part of a CME that is also visible in the eclipse images. (b) PROBA2/SWAP composite image of the corona, superimposed on WLC image of the Easter Island eclipse with 100% opacity (bottom left) and 60% opacity (bottom right), shows the photospheric sources of several coronal features. (PROBA2/SWAP Consortium/Royal Observatory Belgium.)
Download figure:
Standard image High-resolution image
Figure 6. (a) AIA image from 18:47 UT, processed with a radial-filter equivalent to bring out the inner corona and (b) a similarly processed image from 20:11 UT.
Download figure:
Standard image High-resolution imageCareful inspection of the high-resolution figures of the WLC reveals a faint extended "nebulous" object within the coronal hole above the north pole. This kind of structure was first discovered during the 2006 March 29 eclipse (Pasachoff et al. 2007) and we called it a "curtain-like" feature (see Figure 1, mark "curtain"). Here, the "curtain" is situated between 350° and 360°, and its relatively sharp upper end, best visible at 356°, lies about 360,000 km (1.52 solar radius) above the solar surface; comparing images taken at Tatakoto and Easter Island, we could not discern any temporal change of its shape over the 83 minute time interval. Although it is possible that this feature could be the post-eruption arcade of the filament eruption that occurred on the back side, the hairy-ball plot suggests that the curtain is just the arcade of tall, closed loops rooted in front of the north polar hole. The fact that there was no change in the structure between the two eclipse observations supports this, as does the fact that a similar structure was seen in the 2006 eclipse.
A cavity is visible about the prominence in the south–southeast of the composite images around 140°. From 2006 and 2008 eclipse visible- and infrared-filtered images showing Fe x through Fe xiv, Habbal et al. (2010a) demonstrate how the hot plasmas surrounding prominences are affected by the magnetic field, which is twisted. Kucera et al. (2010) also discuss ground/space observations of coronal cavities using their eclipse infrared observations.
Finally, we mention a coronal void or cavity (see Figure 1) between 231° and 232° that seems to separate two distinct systems of coronal structures. This void is also visible on images taken at Easter Island and on space-borne EUV 284 Å images (Figure 2). The void is located on the equatorward side of the pseudostreamer mentioned in the first paragraph of this section. Since pseudostreamers separate two coronal holes of the same polarity (Wang et al. 2007), the void may well represent the lower-latitude hole that appeared near central meridian on July 3.
The above-described prominent features of the WLC are, as already stressed, only the first approximation; much more can be seen and revealed on processed images taken with our telescopes that provided greater spatial resolution. Habbal et al. (2010b) also use similarly processed images from the 2006 and 2008 eclipses as part of their investigation of emission-line ratios and the transition from collisional to collisionless plasma.
Our images provide the latest value of the Ludendorff flattening coefficient, which measures the ellipticity of coronal isophotes. Our measured value of 0.156 fits the curve for this phase of +0.4 of the solar-activity cycle (Golub & Pasachoff 2010 and references therein; their Figure 4.11 is based on information from S. Koutchmy, V. Rušin, and M. Druckmüller, 2010, private communication; see also Pishkalo 2011).
4. THE MOST REMARKABLE LARGE-SCALE DYNAMICS OF THE WLC
Short-term changes of small-scale structures of the solar corona have been quite intensively studied lately, thanks to space-borne observations, e.g., Sheeley et al. (2007) and Moreno-Insertis et al. (2008). The behavior of large-scale solar coronal structures has been discussed, for example, by Koutchmy (1988), Zirker et al. (1992), Pasachoff et al. (2007), and Golub & Pasachoff (2010). As the observing sites of our two teams were more than one hour apart, comparing the corresponding data also enables us to discern interesting changes in the large-scale structure of the WLC on a temporal scale of hours. We shall briefly comment on four cases.
4.1. A Narrow Streamer Anchored at PA 62°
A narrow slightly curved ray—denoted by number "1" in Figure 1—seemingly anchored at 62° can be, on images taken at Tatakoto, seen up to 500,000 km above the solar limb, while on images from Easter Island its maximum brightness is located some 200,000 km higher. The corresponding projected velocity of its brightest portion is 40 km s−1. Only when other examples are observed at future eclipses can we rule out the "scissors" effect from a combination of solar rotation and edge enhancement.
4.2. A Coronal Mass Ejection
We can even discern some change in the shape of a well-visible CME (denoted as "CME" in Figure 1). This change is most pronounced in its upper part in the region close to PA 110°, where the CME meets a radial ray; the corresponding projected velocity is very small, about 1 km s−1 (see also Pasachoff et al. 2007). The other change is noticeable at the left part of the loop, which seems to be anchored at 97°. The head of the CME is localized at the height of 2.01 R☉ (i.e., about 703,200 km).
4.3. A Curved Ray
At PA 122°, close to the lunar limb, we see a local brightening of the WLC and a pronounced narrow ray (marked as "2" in Figure 1) of a hook-like shape "emanating" from it. On the images taken at Tatakoto, this ray meets another ray (denoted as "CS" in Figure 1) at about 3.62 R☉, while on the Easter Island image, this intersection has moved to about 3.87 R☉; the estimated radial speed is 36 km s−1. Moreover, the ray's curvature has changed. It might be supposed that it is one leg of CME 2, which is indicated in Figure 7 (also observed with the Naval Research Laboratory's (NRL) LASCO on ESA's Solar and Heliospheric Observatory (SOHO/LASCO)).

Figure 7. (a) Outer WLC as observed from Tatakoto with 200 mm, 500 mm, and 1624 mm telephoto lenses. The field of view corresponds to that of the 200 mm lens. The arrow marks the second CME (image by Miloslav Druckmüller, Martin Dietzel, Shadia Habbal, and Vojtech Rušin). (b) The SOHO/LASCO WLC image from the C2 coronagraph, with the white circle marking the size and location of the solar photosphere (courtesy of LASCO Consortium/NRL/NASA/ESA). (c) Cut-outs of SOHO/LASCO images of the CME 2. Left: LASCO C2, which images from ∼2–6 R☉; right: LASCO C3, with ∼4 to ∼15–20 R☉ shown here; see Brueckner et al. (1995), which calls the instrument "The Large Angle Spectroscopic Coronagraph;" one now usually sees "and Spectrometric" (http://lasco-www.nrl.navy.mil/, courtesy of LASCO Consortium/NRL/NASA/ESA). (d) A full SOHO/LASCO C3 image from 21:42, illustrating the full range of the observed corona during the time of the eclipse, with the CME at lower left (courtesy of LASCO Consortium/NRL/NASA/ESA).
Download figure:
Standard image High-resolution image5. PHOTOSPHERIC, CHROMOSPHERIC, AND CORONAL PHENOMENA
As this eclipse fell soon after the onset of cycle 24, the level of activity on the Sun was relatively low. Figure 3, which contains both a magnetogram image from the Helioseismic and Magnetic Imager (HMI) and a 171 Å image from AIA (both on SDO), shows the relatively quiet solar conditions during the eclipse. There is a relatively large active region in the eastern part of the northern hemisphere. Though this active region was situated relatively far from the limb, some of its magnetic loops nonetheless do extend above the limb and are therefore visible in the white light (WL) eclipse images.
The coronal compound images from Tatakoto and Easter Island can be understood in terms of the underlying magnetic field. In Figure 4, we compare one of our composite eclipse images with a computed plot of the coronal magnetic-field lines, with source surface (where the magnetic field is constrained to become radial) at heliocentric distance 2.5 R☉, as Wang et al. (2007) described for their similar work at an earlier eclipse. All field lines that cross the source surface are defined to be "open," with their footpoint areas representing coronal holes. Their calculation used National Solar Observatory (NSO)/Kitt Peak photospheric field maps for CR 2098; Mt. Wilson Observatory and Wilcox Solar Observatory photospheric maps gave very similar results. Such Carrington synoptic maps are assembled from central meridian observations taken over the given Carrington rotation (in this case CR 2098, which began on June 16 and ended on July 13). The map thus includes data taken both before and after eclipse day. This hairy-ball plot gives a general idea of the topology of the coronal field on July 11, showing the locations of coronal holes, helmet streamers separating holes of opposite polarity, and "pseudostreamers" (Wang et al. 2007) separating holes of the same polarity.
We also compared our images of the WLC with EUV images obtained using the Sun Watcher with Active Pixels and Image Processing (SWAP) on board the PROBA2 spacecraft (Berghmans et al. 2006; De Groof et al. 2008; Seaton et al. 2011). SWAP images have a passband with a peak at 174 Å and contain the Fe ix/x emission lines that form near 1 million degrees. In order to improve the signal-to-noise ratio of the SWAP images at large distances above the solar surface, where the EUV corona is very faint, we generated two composites of 50 ten-second images that were obtained during two 60 minute windows surrounding the pair of ground-based eclipse observations. The SWAP composite corresponding to the 18:50 UT eclipse observation is shown in Figure 5. In order to reduce the large dynamic range of the composite, the image has been treated with a radial filter to remove some of the overall falloff in intensity from the bright inner corona to more extended structures.
The PROBA2/SWAP 174 Å passband includes mainly Fe x with a large contribution from Fe ix, contrasting with the AIA/SDO 171 Å passband, which has opposite emphases. SWAP's wider passband, with its 174 Å peak, is more sensitive to the Fe xx and Fe xxiv lines, though they appear only in flares and were not expected to appear during the eclipse. Since AIA's passband is peaked at 171 Å, and its multilayer passband also differs in width, it is therefore dominated by the Fe ix/x, which corresponds to ∼1 MK (Lemen et al. 2011). (A complete discussion of the differences among various instrument responses near 171 Å for EIT/SOHO, EUVI/STEREO, AIA/SDO, and PROBA2/SWAP appears in Raftery et al. 2011.)
A smaller region of emerging magnetic flux is also present in the southern hemisphere. It appears that a small eruption in this region may be responsible for the CME described above. The bottom part of this CME is clearly visible in both of the corresponding SWAP images (see Figure 5), while many of the surrounding structures—clearly visible in the WLC—do not appear in the SWAP images. This suggests that the density in this structure is enhanced from that of the rest of the corona in this region. (Since the intensity of emission from plasma in the EUV scales as the density squared, density enhancements are more clearly seen in EUV images than in WL images, where intensity scales linearly with density.)
It is also worth noting that the bright streamer in the northwest of the WLC image appears to be a void in the temperature-sensitive SWAP image. However, in AIA images in the 193 Å passband, which corresponds to higher (∼1.5–2.0 MK) temperature plasma than what is seen in SWAP's 174 Å passband, this same region appears to be full of bright plasma. Apparently, the streamer in the northwest is higher in temperature—and therefore invisible in the cooler Fe ix and Fe x lines—than the other streamers in the WLC, all of which have counterparts in the SWAP image. (The streamer looks similar in AIA's 211 Å passband, Fe xiv, not reproduced.) This streamer appears to be associated with an active region located near the northwest limb. Images from STEREO-A show a series of brightenings in this region; this activity may be responsible for heating the overlying streamer.
Processed AIA images from 171 Å (Fe ix, log T = 5.8) data, in which a radial-filter-equivalent algorithm has been applied so that the inner corona appears, are displayed in Figure 6. The AIA field of view is slightly smaller than that of SWAP.
6. COMPARISON OF THE WLC WITH SPACE-BORNE OBSERVATIONS
An interesting comparison can be made between Figure 7(a), our observations from Takakoto (18:48 UT), and Figure 7(b), the picture of the WLC taken by SOHO/LASCO closest to our ground-based observations (20:06 UT). In our processed image, the WLC can be traced up to 8 R☉; this southwestern region was dominated by the CME discussed above. Careful inspection of both the figures indicates the presence of a second CME located at a distance of about 5.8 R☉ on the SOHO/LASCO image and at about 4.66 R☉ on our image; the estimated velocity of this second CME is thus about 160 km s−1. This CME seems to be linked with the same helmet streamer as the first one; we therefore surmise that both CMEs have the same origin.

Figure 8. Composite image with EIT (17.1 nm) of WLC as taken by SOHO/LASCO C2 and Tatakoto (inner part between the EUV and WLC SOHO). (Composite created by Zuzana Kaňuchová, Astronomical Institute, Slovak Academy of Sciences.)
Download figure:
Standard image High-resolution imageThe CME we observed is listed as "very poor event" starting at 16:30:05 UT in the catalog at http://cdaw.gsfc.nasa.gov/CME_list/UNIVERSAL/2010_07/univ2010_07.html.
This observation of CMEs during total solar eclipses is only the fourth case in the history of such observations (Ranyard 1879; Rušin & Rybanský 1983; Cliver 1989). For the separation of CMEs from the quiescent corona in LASCO images, see Morgan & Habbal (2010b). Discussions of phenomena related to the dynamics of CMEs as studied simultaneously from the ground and from space include, for example, Koutchmy et al. (2008).
7. DISCUSSION AND CONCLUSIONS
Our series of highly processed WL eclipse images from 2005, 2006, 2008, 2009, and 2010 reveals the diminution of the solar-activity cycle through 2009 and its modest resumption by the time of the 2010 total solar eclipse. The use of our images for dynamic changes means that our results are not sensitive to the criticism of Woo (2010) that such processed images show large-scale variations related to differencing rather than actual absolute brightness. Morgan & Habbal (2010a) discuss the variations of the outer (LASCO) corona over the solar cycle.
The distribution of streamers at the 2010 eclipse has progressed beyond the solar-minimum configuration of extreme elongation from 2008 and 2009, which showed few streamers available equatorially and only polar plumes visible at the poles. Streamers appeared at higher latitudes and the Ludendorff flattening coefficient, as discussed in Section 3, was appropriate for the rising phase of the solar-activity cycle. On-disk ultraviolet observations from NASA's SDO were available for the first time at eclipse for the 2010 event, providing observations with half-arcsecond pixels, thus improving on SOHO/EIT resolution by a factor of at least three. A composite image (Figure 8) thus allows features to be traced from their on-disk feet (for those with feet on the side of the Sun facing us) through the eclipse corona and into the outer corona as seen from SOHO/LASCO. Similarly, the processed images at eclipse time from SDO's AIA correspond well with the processed eclipse images (Figure 9).
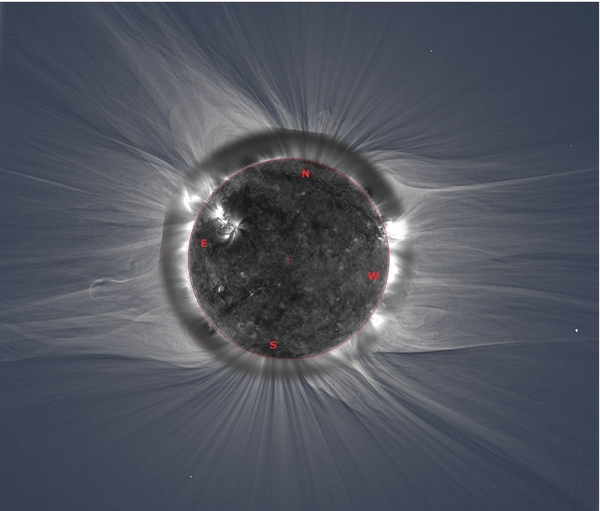
Figure 9. Composite image with the AIA/SDO 171 Å image of the inner corona (radial filter applied) and the nearly simultaneous eclipse composite from Easter Island. Note the excellent agreement of the features as they extend through the inner corona as seen with AIA, with emission especially linked to helmet streamers, and the outer corona as imaged in the eclipse composite. (Eclipse image from Jay M. Pasachoff/Muzhou Lu/Craig Malamut/Hana Druckmüllerová; space image from Alexander Engell & Leon Golub, AIA/SDO/LMSAL/SAO/NASA; composite created by Zuzana Kaňuchová, Astronomical Institute, Slovak Academy of Sciences.)
Download figure:
Standard image High-resolution imageThe WL eclipse images shown in Figures 1 and 6(a) and the SOHO/LASCO images show photospheric light as scattered by coronal electrons held in place by unmeasurable coronal magnetic fields. The on-disk ultraviolet structures, on the other hand, show the highly ionized ions directly revealing the high temperatures typical of the corona. Theories of coronal heating, including such alternatives as high-frequency waves or nanoflares, have recently been summarized by Golub & Pasachoff (2010); a new theory based on observations of Type II spicules and their energy inputs into the corona as observed from the SDO has been advanced by De Pontieu et al. (2011). Our high-resolution composited eclipse observations show many fine-resolution rays similar to those discussed by Wang et al. (2007) from the 2006 eclipse.

Figure 10. Comparison of STEREO A and B images closest to the eclipse times on Tatakoto and Easter Island, respectively; the ground-based set's closest times were separated by 80 minutes. The STEREO pairs enable better estimates of the dynamics of the large-scale coronal structures (NASA/STEREO).
Download figure:
Standard image High-resolution image
Comparing the best high-resolution images taken with a time lag of about 83 minutes enabled us to discern some structural changes in two CMEs, a pronounced narrow plume at PA 62°, and a hook-shaped ray located at about 4 R☉. Although the shape and the position of the first, very pronounced CME changed only very little, those of the other CME were more easily discernible, and its projected velocity reached about 160 km s−1. The motion of the brightest area of the narrow plume is clearly visible, with a projected velocity of about 40 km s−1; this velocity is very close to the value we found for a polar plume observed during the 2006 total eclipse (Pasachoff et al. 2009). The change in the curvature of the hook-like plume can also be spotted easily. Note how superior the eclipse images are to the images from spacecraft, indicating the usefulness of total-eclipse observations for the foreseeable future in which we have the current generation of solar spacecraft. Still, the availability of images from STEREO's two spacecraft, Ahead (A) and Behind (B; Figure 10), from approximately 90° around Earth's orbit, and from Earth-orbiting spacecraft like SDO, should allow for three-dimensional calculations of the angles traveled by CMEs (Mierla et al. 2008, 2010).
The LASCO C2 movies in the CME catalog at http://cdaw.gsfc.nasa.gov/CME_list/ clearly show the outermost ejection as a narrow loop-like structure that is pinching off, similar to the streamer pinch-off events described in Sheeley & Wang (2007) and Wang & Sheeley (2006; see their Figures 1–3). The loop-like structure above the southeast limb in our eclipse images (Figure 1) may well be a helical flux rope with its axis perpendicular to the sky plane. The stretched streamer appears to be undergoing a series of pinch-offs.
Finally, it is worth mentioning a static, extended "nebulous" object we called a "curtain." As already mentioned, this "mysterious" object, brought out by computer enhancing its few-percent contrast, was first detected during the 2006 eclipse (Pasachoff et al. 2007) and is also present in all high-resolution images taken at both Tatakoto and Easter Island. From these images, its intimate relation with the coronal hole observed above the north pole is quite obvious. Perhaps it is related to a prominence-cavity eruption occurring on the backside of the Sun; the curtain may therefore be post-reconnection. An eruption was seen from STEREO B in this area at approximately the corresponding time. As we discussed in Section 3, the hairy-ball plot (Figure 4) suggests that the curtain is merely the arcade of tall, closed loops rooted in front of the north polar hole.
The work of V.R. and M.S. was partially supported by the VEGA grant agency project 2/0098/10 (Slovak Academy of Sciences) and that of H.D. by grant 205/09/1469 of the Czech Science Foundation. V.R. also cordially thanks Shadia Habbal for partial financial support, the ASTELCO for providing the mount, and Heifara Lanteires for hospitality during his stay at Tatakoto. J.M.P.'s eclipse research is supported in part by the Solar Terrestrial Program of the National Science Foundation through grant AGS-1047726; the 2010 expedition received additional support from the Brandi Fund and Science Center funds from Williams College. J.M.P.'s solar research is also supported in part by grant NNX10AK47A from NASA's Marshall Space Flight Center. C.M. was a Keck Northeast Astronomy Consortium Summer Fellow, supported at Williams College by the Research Experiences for Undergraduates program of the National Science Foundation under grant AST-1005024. Partial support for this work was provided by the U.S. Department of Defense's Awards to Stimulate and Support Undergraduate Research Education (ASSURE) program in collaboration with the National Science Foundation's Research Experiences for Undergraduates program. For the Easter Island expedition, we thank Jonathan Kern of the Carnegie Observatories, Nikon Professional Services, Williams College's Equipment Loan Office/James Lillie, and the Photographic Department of the National Geographic Society for providing equipment. For the Tatakoto expedition, we thank ASTELCO Systems GmbH (Germany). J.M.P. thanks the Planetary Sciences Department of the California Institute of Technology for hospitality during the preparation of this paper. Support for D.B.S. and SWAP came from PRODEX grant C90345 managed by the European Space Agency in collaboration with the Belgian Federal Science Policy Office (BELSPO) in support of the PROBA2/SWAP mission, and from the European Commission's Seventh Framework Programme (FP7/2007–2013) under the grant agreement no. 218816 (SOTERIA project, www.soteria-space.eu). SWAP is a project of the Centre Spatial de Liège and the Royal Observatory of Belgium funded by BELSPO. A.E. and L.G. were supported by a contract from Lockheed Martin. We thank the referee, Y.-M. Wang of NRL, for valuable comments and for providing the PFSS figure.