


ABSTRACT
We discuss the proposal of relating the origin of some of the diffuse interstellar absorption bands (DIBs) to neutral polycyclic aromatic hydrocarbons (PAHs) present in translucent interstellar clouds. An assessment of ionized PAHs will be examined in a future report. The spectra of several cold, isolated gas-phase PAHs have been measured in the laboratory under experimental conditions that mimic the interstellar conditions and are compared with an extensive set of astronomical spectra of reddened, early-type stars. This comparison provides—for the first time—accurate upper limits for the abundances of specific PAH molecules along specific lines of sight, something not attainable from IR observations alone. The comparison of these unique laboratory data with high-resolution, high signal-to-noise ratio spectra leads to two major findings: (1) a finding specific to the individual molecules that were probed in this study and, which leads to the clear and unambiguous conclusion that the abundance of these specific neutral PAHs must be very low in the individual translucent interstellar clouds that were probed in this survey (PAH features remain below the level of detection) and, (2) a general finding that neutral PAHs exhibit intrinsic band profiles that are similar to the profile of the narrow DIBs indicating that the carriers of the narrow DIBs must have close molecular structure and characteristics. This study is the first quantitative survey of neutral PAHs in the optical range and it opens the way for unambiguous quantitative searches of PAHs in a variety of interstellar and circumstellar environments.
Export citation and abstract BibTeX RIS
1. INTRODUCTION
There has been recent interest in the study of translucent clouds, which contain atomic and molecular gases mixed with solid dust grains and have intermediate visual extinctions. In the classification of interstellar clouds, translucent clouds fall in between the two extreme cases of dense clouds and diffuse clouds (Snow & McCall 2006). The spectra of translucent interstellar clouds exhibit absorption features which are superposed to the spectra of early-type, reddened, OB stars. Due to the dual nature of the dust, a mix of solid grains and gas-phase molecules and atoms, continuous extinction and discrete absorption features are observed in the spectra of translucent clouds. The continuous extinction is generally associated with the presence of solid dust grain particles made up of a mixture of amorphous silicate and graphitic grains, including varying amounts of polycyclic aromatic hydrocarbons (PAHs; for recent reviews see Draine & Li 2007; Fitzpatrick & Massa 2009, and references therein). The discrete absorption features are associated with atomic and molecular species in the gas phase. Although some simple molecular species such as CH, CH+, CN, C2, NH, H2, and CO have long been identified, a large set of absorption features, the diffuse interstellar absorption bands (DIBs), remains unidentified. The DIBs are widely thought to be associated with large, carbon-bearing molecules and ions that are part of an extended size distribution of the interstellar dust (Tielens & Snow 1995; Sarre 2006).
Here, we focus on the DIBs and, more specifically, on the potential link between neutral PAH molecules and the carriers of the bands.
The DIB spectrum consists of more than 400 confirmed interstellar bands including a large number of weak features that fall in the NUV to the NIR range (4400–10,000 Å). The bands are characterized as diffuse due to the observation that they are broad and shallow in comparison to the well-known, narrow, interstellar atomic lines. The individual DIBs vary widely in strength and shape, with equivalent width per magnitude of visual extinction ranging from about 2 Å to the detection limit of about 0.005 Å. The FWHM values for the DIBs range from about 0.4 to 40 Å. For recent surveys, see Jenniskens & Dèsert (1994), Herbig (1995), Galazutdinov et al. (2000), Tuairisg et al. (2000), and Hobbs et al. (2008, 2009).
PAHs are a class of very stable aromatic organic molecules made only of fused benzenoid rings and hydrogen atoms. Carbon molecules, in their neutral and ionized forms, play an important role in the interstellar medium (ISM) due to the rich chemistry of carbon and its ability to form a large variety of complex molecular species involving hydrogen—the most abundant element (for a recent review see Salama 2008). The PAH–DIB proposal has been put forward, more than two decades ago, on the basis of the expected abundance of PAHs in the ISM and their stability against UV photodissociation (Van der Zwet & Allamandola 1985; Léger & d'Hendecourt 1985; Crawford et al. 1985). PAHs are now thought to be largely responsible for the discrete infrared emission bands observed at 3.3, 6.2, 7.7, 8.6, and 11.3 μm in many astronomical objects including H ii regions, planetary and reflection nebulae, and the ISM of the Milky Way and other galaxies (Tielens 2008). Observations from the IR space satellites Infrared Space Observatory (Mattila et al. 1996), Infrared Telescope in Space (Onaka et al. 1996), and Spitzer (Flagey et al. 2006) have confirmed that PAHs are ubiquitous throughout the general diffuse ISM as well. According to the astrophysical model, PAHs are expected to be present as a mixture of free, neutral, and ionized molecules following a broad size distribution which range from small, gas-phase molecules (⩽25 carbon atoms) to large graphitic platelets (Allamandola et al. 1989; Puget & Léger 1989). PAHs form a link between the gas and the solid phase of interstellar dust and are a key element for the coupling of stellar FUV photons with the interstellar gas.
In addition to assessing the role that PAHs may play as DIB carriers, it is becoming more and more important to search for the signature of these molecules in other wavelength windows (such as in the UV and optical ranges, for example) to test the predictions of the PAH model that is exclusively based on observations in the IR range that only provide information on chemical group structure and cannot be used to identify specific individual PAHs. Infrared spectroscopy measures the bond vibration frequencies of the chemical functional groups present in a molecule. In contrast, UV and visible spectroscopy use electron transitions to determine the bonding pattern, a feature that is unique to a specific molecule.
Extensive laboratory studies have been performed to measure the UV and visible spectroscopic properties of neutral and ionized PAHs in media that are astrophysically relevant, i.e., media where the neutral PAH molecules and their ions are free and isolated at low temperature. First, neutral PAH molecules and ions were isolated at 4.2 K in solid neon matrices (see Salama 1999 and references therein). Based on these preliminary data and on the astronomical data then available, the PAH–DIB proposal was re-assessed and the laboratory data assessed against a survey of five reddened early-type stars (Salama et al. 1996; Salama et al. 1999). The results of this first survey led to the inescapable conclusion that although PAHs (neutral and ions) were promising candidates for the DIB carriers, laboratory gas-phase data were imperatively needed for a quantitative comparison with astronomical data.
Since we performed this first survey, over a decade ago, the laboratory and astronomical data sets have both considerably evolved in size and in quality, thanks to advances in detector technology and in laboratory astrophysics techniques. An extensive set of gas-phase spectra of neutral and ionized PAHs is now available (for a recent review see Salama 2008 and references therein), making it possible for the first time to unambiguously search for the signature of specific PAHs in the diffuse ISM and to test the PAHs as potential DIB carriers.
As a direct result of these advances in the laboratory studies of PAHs, three weak broad DIBs in the 6000–6800 Å range were recently tentatively assigned to the naphthalene cation (C10H8+), while one weak broad DIB near 7088 Å was assigned to the anthracene cation (C14H10+). All these bands were detected in a single line of sight, that of Cernis 52 (BD +31 640), an early-type reddened star behind the Perseus supernova remnant showing anomalous microwave emission (Iglesias-Groth et al. 2008, 2010). Searches for the naphthalene cation (C10H8+) along many other lines of sight of reddened stars were, however, unsuccessful (Snow 1992; Krełowski et al. 2001; Snow et al. 2010).
Here, we consider the case of neutral PAHs and compare the gas-phase laboratory spectra of 10 neutral PAH molecules to an extensive set of high-resolution astronomical data of translucent clouds. The objectives are (1) to search for correlations between these specific PAH molecules and specific DIBs against high-resolution astronomical data, (2) to search for DIBs at the positions predicted by laboratory measurements, (3) to derive—for the first time—reliable, quantitative abundances for specific PAH molecules along specific lines of sight, and (4) to further assess and test the validity of the PAH–DIB proposal.
In Sections 2 and 3, we describe the astronomical and laboratory data sets, respectively. In Section 4, we compare the two data sets, discuss the results of this assessment, and derive some conclusions.
2. THE OBSERVATIONAL PROGRAM
Throughout the last 15 years, we have expanded our database of echelle spectra of reddened OB stars. The spectra of these stars usually contain extended sets of interstellar features, which, for most of them, are associated with DIBs. As mentioned above, most of the features identified as DIBs are very weak bands requiring the acquisition of spectra of very high signal-to-noise (S/N) ratio. This survey is based on a small set of high-quality spectra collected using the UVES spectrograph, fed with the 8 m Kueyen mirror of the Very Large Telescope at the ESO Paranal Observatory. The UVES is a cross-dispersed echelle spectrograph which operates from the atmospheric cutoff at 3000 Å to around 11000 Å. Most of the bands of the neutral PAH molecules considered in this survey fall in the NUV/blue range, available to a few spectrographs only. Heavily reddened stars with a single (or one strongly dominant) velocity component have been selected to facilitate the detection of weak spectral features that likely originate from single clouds (Table 1).
Table 1. Stellar Data
| Star HD | Sp/L | V | B − V | E(B − V) | vsin i | rva |
|---|---|---|---|---|---|---|
| 110432 | B2pe | 5.3 | 0.26 | 0.47 | 200 | +7.7 |
| 115842 | B0.5 Iab | 6.02 | 0.30 | 0.50 | 70 | +8.7 |
| 136239 | B2Iae | 7.82 | 0.92 | 1.08 | 60 | −14.0 |
| 144217 | B0.5V | 2.50 | −0.07 | 0.17 | 100 | −9.1 |
| 147165 | B1 III | 2.90 | 0.14 | 0.35 | 50 | −4.4 |
| 147889 | B2 V | 7.90 | 0.84 | 1.05 | 100 | −7.2 |
| 148184 | B2 Ve | 4.42 | 0.28 | 0.49 | 100 | −10.8 |
| 148379 | B2Iab | 5.32 | 0.54 | 0.70 | 60 | −11.3b |
| 149404 | O9 Iab | 5.48 | 0.39 | 0.62 | 100 | +1.7 |
| 149757 | O9.5V | 2.57 | 0.02 | 0.29 | 400 | −14.7 |
| 151932 | WN7 | 6.48 | 0.26 | 0.55 | +2.0 | |
| 152236 | B1Iae | 4.72 | 0.48 | 0.67 | 60 | +2.2 |
| 152249 | O9.5 Iab | 6.47 | 0.20 | 0.43 | 80 | +3.7 |
| 154368 | O9.5 Iab | 6.13 | 0.51 | 0.74 | 70 | −1.7 |
| 154445 | B1 V | 5.62 | 0.14 | 0.37 | 130 | −15.0 |
| 170740 | B2 V | 5.72 | 0.24 | 0.45 | 25 | −7.6 |
| 163800 | O7.5 | 6.98 | 0.28 | 0.57 | 138 | −5.6 |
Notes. arv is the heliocentric radial velocity (km s−1) of the main component of the interstellar CH 4300.31 Å band. bMid-position between two components.
Download table as: ASCIITypeset image
The reduction of the echelle spectra was made using the DECH code (Galazutdinov 1992). This program allows flat-field division, bias/background subtraction, one-dimensional spectrum extraction from the two-dimensional images, correction for the diffuse light, spectrum addition, removal of cosmic ray features, etc. The DECH code also allows the location of continuum, measurements of the line equivalent widths, positions, and shifts, etc. The spectral range, covered in every exposure, contains the strong and well-identified atomic interstellar lines Ti ii, Ca ii, Ca i, Na i, and K i used for rest-wavelength calibrations together with molecular interstellar lines such as the CH 4300 Å line (see Figures 1 and 2).

Figure 1. Known atomic (K i) and molecular (C3) interstellar lines.
Download figure:
Standard image High-resolution image
Figure 2. Atomic and molecular interstellar lines used for rest-wavelength determination.
Download figure:
Standard image High-resolution imageTable 1 lists the objects considered in this survey together with their spectral types, luminosity classes, color excesses, and the apparent rotational velocities. The table also provides radial velocities for the interstellar CH 4300 Å band that was used, along with the atomic interstellar lines mentioned above (Figures 1 and 2), for the correction of the wavelength scale to the rest position of the interstellar features. Weak and sharp interstellar features observed in spectra of rapidly rotating stars (HD149757) cannot be of stellar origin. The observed colors have been taken from the SIMBAD database and the intrinsic colors from the paper of Papaj et al. (1993). As mentioned above, we have selected heavily reddened stars to enhance the detection of weak interstellar features. We have also selected stars which are characterized by different strength ratios for the major DIBs 5780 and 5797 because it has been shown (Krełowski et al. 1995) that the pattern of the weak features varies with the ratio of the strength of the 5780 and 5797 DIBs.
Figures 3–11 show the spectra of heavily reddened stars in the vicinity of the position of the major neutral PAH features measured in the laboratory experiments. Since the laboratory experiments have been performed with isolated, jet-cooled neutral molecules in the gas phase, the spectral features observed in the astronomical spectra should coincide precisely with their laboratory-measured counterparts. In all the figures, the interstellar spectral features are plotted in the laboratory wavelength scale for the gas-phase lines. Every PAH candidate produces one or more strong bands together with several weaker features. The S/N ratio reported in the figures is derived from the standard error of the mean. The S/N is calculated from the continuum of the normalized spectra in a wavelength range close to the strongest PAH band observed in the laboratory spectrum. An upper limit of the EW is calculated in each case for a wavelength range—Δλ (see Table 2)—that is centered around the strongest PAH absorption feature. As a result, broader features tend to be associated with larger EW values.

Figure 3. 2-Methylnaphthalene—the cavity ring-down spectrum of 2-methylnaphthalene (C11H10) prepared in a cold jet expansion with Ar buffer gas is compared to the average spectrum of the program stars (S/N 930).
Download figure:
Standard image High-resolution image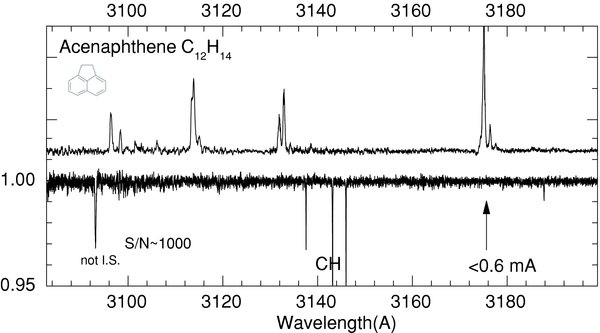
Figure 4. Acenaphthene—the cavity ring-down spectrum of acenaphthene (C12H14) prepared in a cold jet expansion with Ar buffer gas is compared to the average spectrum of the program stars (S/N 1000).
Download figure:
Standard image High-resolution image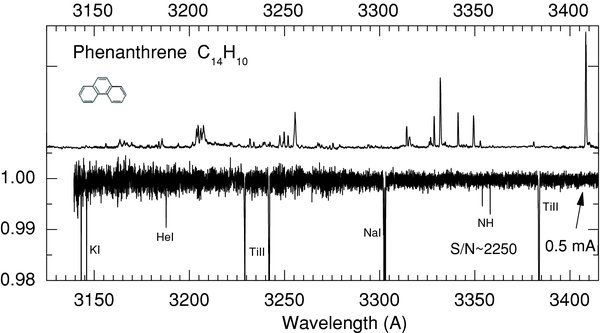
Figure 5. Phenanthrene—the cavity ring-down spectrum of phenanthrene (C14H10) prepared in a cold jet expansion with Ar buffer gas is compared to the average spectrum of the program stars (S/N 2250).
Download figure:
Standard image High-resolution image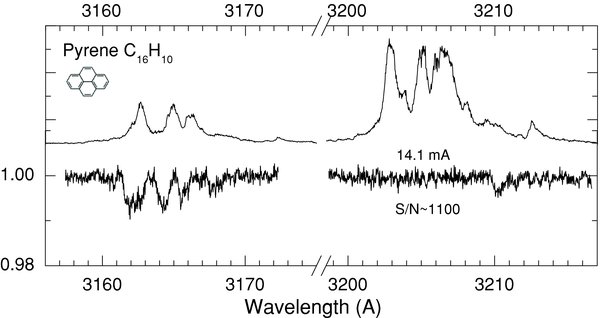
Figure 6. Pyrene—the cavity ring-down spectrum of pyrene (C16H10) prepared in a cold jet expansion with Ar buffer gas is compared to the average spectrum of the program stars (S/N 1000).
Download figure:
Standard image High-resolution image
Figure 7. Benzo[ghi]perylene—the cavity ring-down spectrum of benzo[ghi]perylene (C22H12) prepared in a cold jet expansion with Ar buffer gas is compared to the average spectrum of the program stars (S/N 2500).
Download figure:
Standard image High-resolution image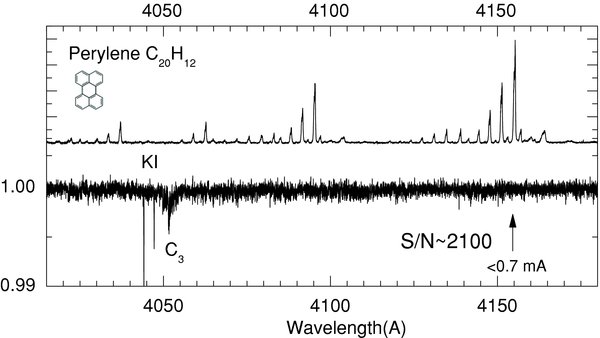
Figure 8. Perylene—the cavity ring-down spectrum of perylene (C20H12) prepared in a cold jet expansion with Ar buffer gas is compared to the average spectrum of the program stars (S/N 2100).
Download figure:
Standard image High-resolution image
Figure 9. Pentacene—the cavity ring-down spectrum of pentacene (C22H14) prepared in a cold jet expansion with Ar buffer gas is compared to the average spectrum of the program stars (S/N 4200).
Download figure:
Standard image High-resolution image
Figure 10. Pentacene closeup—closeup comparison of the 5362.8 Å absorption band of jet-cooled pentacene (C22H14) measured in the laboratory with cavity ring-down spectroscopy with a FWHM of 1.9 Å and the 5363.8 Å DIB, FWHM = 2.1 Å extracted from the average spectrum of the program stars (S/N 2100). Band intensities are normalized for clarity.
Download figure:
Standard image High-resolution image
Figure 11. Pyrene—the cavity ring-down spectrum of pyrene (C16H10) prepared in a cold jet expansion with Ar buffer gas (top) is compared to the average normalized (center) and non-normalized spectra (bottom) of the program stars (S/N 1000).
Download figure:
Standard image High-resolution image
Table 2. Upper Limits of PAHs Abundance Measured in the Spectra of the Individual Program Stars of Table 1 and in the Average Spectrum in the Wavelength Region Corresponding to the Strongest PAH Absorption Feature(s)
| HD | Acenaphthenea | Benzo[ghi]peryleneb | 2-Methylnaphthalenea | Pentacenea | Pentacenea | Perylenec |
|---|---|---|---|---|---|---|
| λ Peak: 3175.0 Å | λ Peak: 3689.4 Å | λ Peak: 3152.7 Å | λ Peak: 5339.5 Å | λ Peak: 5362.8 Å | λ Peak: 4155.0 Å | |
| Δλ: 3174.55–3175.52 | Δλ: 3685.9–3690.9 | Δλ: 3152.2–3153.2 | Δλ: 5336.2–5342.2 | Δλ: 5359.3–5365.0 | Δλ: 4154.4–4155.7 | |
| f = 2.2E(−3)d | f = 1.4E(−1)d | f = 2.3E(−3)d | f = 4.1E(−1)d | f = 4.1E(−1)d | f = 2.4E(−1)d | |
| 110432 | 330 0.0027 1.72907E13 | 840 0.0053 0.31295E12 | 410 0.0021 1.04052E13 | 1170 0.0050 0.48221E12 | 760 0.0014 0.38276E11 | |
| 115842 | 330 0.0024 1.72907E13 | 880 0.0046 0.27162E12 | 470 0.0020 0.99098E13 | 1100 0.0077 0.74261E12 | 900 0.0014 0.38276E11 | |
| 136239 | 940 0.0132 1.27304E12 | 1100 0.0385 0.36811E12 | ||||
| 144217 | 500 0.0018 1.72907E13 | 1100 0.0044 0.25981E12 | 640 0.0014 0.69368E13 | 1280 0.0052 0.50150E12 | 1550 0.0119 0.11378E12 | 970 0.0012 0.32808E11 |
| 147165 | 300 0.0028 1.57650E13 | 700 0.0060 0.35428E12 | 390 0.0022 1.09008E13 | 920 0.0014 0.38276E11 | ||
| 148184 | 280 0.0031 1.22052E13 | 700 0.0060 0.35428E12 | 350 0.0024 1.18917E13 | 980 0.0011 0.30074E11 | ||
| 148379 | 1000 0.0110 1.06087E12 | 1750 0.0311 0.29736E12 | 970 0.0011 0.30074E11 | |||
| 149404 | 210 0.0037 1.93248E13 | 640 0.0068 0.40152E12 | 280 0.0030 1.48647E13 | 1130 0.0073 0.70403E12 | 1390 0.0203 0.19409E12 | 840 0.0013 0.35542E11 |
| 149757 | 410 0.0021 1.11881E13 | 900 0.0044 0.25981E12 | 490 0.0019 0.94142E13 | 1100 0.0048 0.04629E12 | 1970 0.0073 0.06979E12 | 930 0.0012 0.32808E11 |
| 151932 | 260 0.0038 1.88163E13 | 600 0.0077 0.45466E12 | 370 0.0023 1.13962E13 | 1090 0.0073 0.70403E12 | 1600 0.0247 0.23616E12 | 740 0.0013 0.35542E11 |
| 152236 | 350 0.0024 1.62735E13 | 800 0.0056 0.33066E12 | 440 0.0020 0.99098E13 | 2750 0.0137 0.13099E12 | 1060 0.0012 0.32808E11 | |
| 152249 | 260 0.0031 1.42394E13 | 730 0.0057 0.33657E12 | 350 0.0026 1.28827E13 | 1080 0.0070 0.67509E12 | 2050 0.0130 0.12430E12 | 890 0.0013 0.35542E11 |
| 154368 | 240 0.0034 0.91539E13 | 580 0.0075 0.44285E12 | 290 0.0033 1.63511E13 | 1160 0.0075 0.72332E12 | 1250 0.0124 0.11856E12 | 760 0.0014 0.38276E11 |
| 154445 | 250 0.0034 1.22052E13 | 660 0.0076 0.44876E12 | 430 0.0024 1.18917E13 | 1300 0.0060 0.57865E12 | 1400 0.0208 0.19887E12 | 710 0.0016 0.43744E11 |
| 170740 | 260 0.0034 1.37308E13 | 560 0.0080 0.47238E12 | 330 0.0027 1.33782E13 | 780 0.0014 0.38276E11 | ||
| average | 1000 0.0006 0.30513E13 | 2500 0.0021 0.12399E12 | 930 0.0010 0.49549E13 | 4100 0.0050 0.48221E12 | 4300 0.0236 0.22565E12 | 2100 0.0007 0.19138E11 |
| HD | Phenanthrenea | Pyrenea | C42H18e | C42H18e | Benzofluorenef | Anthraceneg |
| λ Peak: 3408.4 Å | λ Peak: 3205.8 Å | λ Peak: 4264.1 Å | λ Peak: 4335.2 Å | λ Peak: 3345.1 Å | λ Peak: 3611.8 Å | |
| Δλ: 3407.7–3409.1 | Δλ: 3199.0–3215.2 | Δλ: 4263.35–4264.85 | Δλ: 4334.45–4335.95 | Δλ: 3345–3345.2 | Δλ: 3611.6–3612.0 | |
| f = 2.3E(−2)d | f = 1.6E(−1)d | f = 8.5E(−4) | f = 2.4E(−4) | f = 2.4E(−2) | f = 1.0E(−2) | |
| 110432 | 830 0.0015 0.63444E12 | 400 0.0359 0.24609E13 | 950 0.0013 9.46039E13 | 660 0.0020 4.92834E14 | 650 0.0003 1.26232E12 | 860 0.0004 3.46490E12 |
| 115842 | 845 0.0017 0.71903E12 | 430 0.0315 0.21593E13 | 950 0.0015 1.09158E14 | 610 0.0022 5.42116E14 | 560 0.0003 1.26232E12 | 780 0.0004 3.46490E12 |
| 136239 | 520 0.0026 1.89208E14 | 315 0.0041 1.01031E15 | 180 0.0012 5.04929E12 | 330 0.0011 9.52848E12 | ||
| 144217 | 1250 0.0009 0.38066E12 | 570 0.0250 0.17137E13 | 1110 0.0012 8.73267E13 | 680 0.0018 4.43551E14 | 1220 0.0002 8.41548E11 | 780 0.0004 3.46490E12 |
| 147165 | 850 0.0016 1.16436E14 | 500 0.0025 3.75786E14 | 450 0.0008 6.92981E12 | |||
| 148184 | 870 0.0015 0.63444E12 | 630 0.0023 1.67355E14 | 630 0.0019 2.85597E14 | 670 0.0004 2.75918E12 | 550 0.0008 6.92981E12 | |
| 148379 | 1030 0.0013 9.46039E13 | 500 0.0024 3.60754E14 | 220 0.0009 6.20815E12 | 180 0.0021 1.81907E13 | ||
| 149404 | 760 0.0017 0.71903E12 | 300 0.0459 0.31464E13 | 860 0.0016 1.16436E14 | 590 0.0021 3.15660E14 | 440 0.0003 2.06938E12 | 670 0.0005 4.33113E12 |
| 149757 | 1100 0.0013 0.54985E12 | 480 0.0311 0.21319E13 | 1030 0.0014 1.01881E14 | 600 0.0023 3.45723E14 | 730 0.0003 2.06938E12 | 730 0.0004 3.46490E12 |
| 151932 | 840 0.0014 0.59214E12 | 370 0.0352 0.24129E13 | 910 0.0015 1.09158E14 | 550 0.0022 3.30691E14 | 535 0.0003 2.06938E12 | 580 0.0006 5.19735E12 |
| 152236 | 1020 0.0012 0.50755E12 | 420 0.0331 0.22690E13 | 1210 0.0011 8.00495E13 | 710 0.0018 2.70566E14 | 740 0.0002 1.37959E12 | 700 0.0004 3.46490E12 |
| 152249 | 910 0.0013 0.54985E12 | 370 0.0367 0.25158E13 | 880 0.0015 1.09158E14 | 510 0.0025 3.75786E14 | 545 0.0004 2.75918E12 | 620 0.0006 5.19735E12 |
| 154368 | 550 0.0024 1.01511E12 | 320 0.0414 0.28379E13 | 820 0.0017 8.23758E13 | 510 0.0026 3.90817E14 | 500 0.0004 2.75918E12 | 520 0.0007 6.06358E12 |
| 154445 | 880 0.0014 0.59214E12 | 380 0.0380 0.26049E13 | 930 0.0014 6.78392E13 | 500 0.0025 3.75786E14 | 570 0.0003 2.06938E12 | 580 0.0005 4.33113E12 |
| 170740 | 665 0.0019 0.80362E12 | 320 0.0425 0.29133E13 | 850 0.0015 1.09158E14 | 500 0.0027 4.05848E14 | 380 0.0005 3.44897E12 | |
| average | 2250 0.0005 0.21148E12 | 1000 0.0141 0.09665E13 | 2790 0.0011 8.00495E13 | 2000 0.0010 1.50314E14 | 1900 0.0001 6.89793E11 | 1730 0.0003 2.59868E12 |
Notes. Signal-to-noise ratio (S/N), equivalent width (EW in Å), and corresponding column density (c.d. in cm − 2) values are given for each PAH band. Δλ represents the wavelength range that was used to derive upper limits for the column densities of the strongest features. aThis work bTan & Salama (2005b) cTan & Salama (2005a) dTan et al. (2010) eKokkin et al. (2008); f value scaled according to Rouillé et al. (2009) fStaicu et al. (2006) gHermine (1994).
Download table as: ASCIITypeset image
3. THE LABORATORY PROGRAM
PAH molecules have a very low vapor pressure and in the absence of direct absorption spectroscopy techniques with high enough sensitivity, PAH absorption was traditionally measured with the help of matrix isolation spectroscopy (MIS). In MIS experiments, neutral PAH molecules are trapped and isolated at low temperatures (<5 K) in solid neon matrices where the perturbations induced in the spectrum of the trapped molecules and ions are minimal (Salama 1996). A large database of the spectra of neutral and ionized PAHs was developed using this technique (see Salama 1999 for a review). The MIS data were used to derive a general assessment of the PAH–DIB proposal by comparing the laboratory data then available to astronomical surveys (Salama et al. 1996; Salama et al. 1999). The advantage of MIS is to allow the trapping and stabilization of a large column density of cold and isolated PAH molecules. The major drawback of this technique is the perturbation that is induced in the measured band profiles and band peak positions due to interaction with the phonons of the lattice in the solid matrix.
The subsequent development of the ultra-high-sensitivity absorption technique of cavity ring-down spectroscopy (CRDS) made it possible to measure the direct absorption spectra of cold PAH molecules and ions in the gas phase (Biennier et al. 2003; Rouillé et al. 2004; Tan & Salama 2005a, 2005b; Staicu et al. 2006; Rouillé et al. 2007; Kokkin et al. 2008). In these laboratory experiments, the harsh physical conditions reigning in interstellar clouds—low temperature, collisionless, strong UV radiation fields—are simulated by generating molecular beams seeded with PAH molecules. Cold, neutral PAH molecules are formed in an isolated environment and probed with high-sensitivity CRDS in the NUV–NIR range (Tan & Salama 2005a, 2005b). These experiments provide unique information on the spectra of free, cold (∼50–100 K) PAH molecules in the gas phase that can now be directly compared to astronomical observations of diffuse and translucent interstellar clouds.
Our approach relies on the association of a pulsed discharge slit nozzle (PDN) with ultra-high-sensitivity CRDS and is independent of inter- and intra-molecular processes. The experimental approach has been described previously (Biennier et al. 2003; Tan & Salama 2005a). In brief, a pulsed planar supersonic beam expansion containing the sample seeded in Ar is prepared with a PDN. The PDN consists of a heated copper sample reservoir and a 10 cm long by 200 μm wide slit, which is sealed from inside by a Vespel (Dupont, SP-22 Grade) slit poppet driven by three synchronized pulsed solenoid valves (General Valve Series 9). Two stainless knife-edge electrodes are mounted outside the PDN on each side of the slit. The two electrodes are separated by an even gap of 400 μm and configured as the cathode of a high-voltage pulse generator. The PDN assembly itself is configured as the anode. This design enables the generation of cold atomic and molecular neutrals, ions, and radicals in the planar jet expansion. In the experiments described here, the high voltage is applied only for the wavelength calibration, which is achieved by monitoring the Ar* atomic lines generated in the discharge. PAHs samples are solid at room temperature. The PAH vapor pressure is increased by heating a pick-up cell that contains the sample upstream the argon flow. The supersonic beam expansion containing the carrier gas seeded with the PAH sample (<0.1%) is probed by CRDS several millimeters downstream with a sub-ppm absorption sensitivity. The spectra are probed using frequency-doubled output of a neodymium-doped yttrium aluminum garnet (Quanta-Ray Lab 150 from spectraphysics) pumped dye laser (Quanta-Ray PDL-2 from spectraphysics). The ring-down cavity consists of two high-reflectivity (99.999%) concave (6 m curvature radius) mirrors (Los Gatos Research) mounted 55 cm apart. The ring-down signal is collected by a photosensor module (H6780-04 from Hamamatsu) and digitized by a 20 MHz 12 bit acquisition board (Adlink, PCI9812). The data are then processed by a personal computer program and the cavity losses are extracted. Detailed investigations of the flow dynamics in the PDN (Biennier et al. 2006) allow full characterization of the cold planar expansion.
The absorption spectra of the cold (∼50–100 K), neutral PAH molecules measured with this approach are reported in Figures 3–11. Note that according to conventions and to enhance the contrast between the laboratory and astronomical spectra, the absorption spectra of the neutral PAH molecules are plotted in absorbance, i.e., with the absorption features shown as "positive" peaks.
Table 2 compares the neutral PAH features, measured in the laboratory gas-phase experiments, with the astronomical spectra. Upper limits for the column densities of the PAH molecular carriers were calculated at the wavelengths associated with specific vibronic transitions of the PAH molecules according to the formula (Frisch 1972):

where EW is the equivalent width and f is the oscillator strength or the "f value" of the vibronic transition that is being considered.
4. DISCUSSION AND CONCLUSIONS
We have compared our recently acquired data on the spectroscopy of free, cold PAH molecules in the gas phase with an extensive set of astronomical observations taken along the lines of sight of selected reddened stars.
From the observational angle, DIBs can be sorted between strong (band equivalent widths, Wλ, ⩾1.0 Å), moderately strong (1.0 Å ⩾ Wλ ⩾0.1 Å), and weak (Wλ ⩽0.1 Å; Salama et al. 1996). There are few strong DIBs and moderately strong DIBs and the distribution is heavily dominated by the weak bands (see, e.g., the distribution of DIBs' equivalent widths reported in Tuairisg et al. 2000 for observations made along the lines of sight of the heavily reddened stars BD+63 1964, HD 183143, and BD+40 4220). The vast majority of DIBs range from weak to very weak (less than 0.01 Å equivalent width). The recent high-quality spectra of reddened stars make it possible to reliably detect hundreds of weak interstellar features. All of them exhibit the same characteristics as the well- known, stronger, DIBs (Ehrenfreund & Foing 1996; Jenniskens et al. 1996; Kerr et al. 1996; Galazutdinov et al. 2008) and are thus also likely of molecular origin. These features are observed in practically all environments, including the very diffuse clouds (Galazutdinov et al. 1998). This indicates that the (molecular) carriers of the weak DIBs must be resistant against UV photons irradiation. PAH molecules satisfy this observational constraint. Although the increased number of observed features provides more clues for the identification of the band carriers, unambiguous identifications are now more complex. Another difficulty comes from the fact that the weak interstellar features are very densely distributed in the near-infrared spectral range.
From the laboratory angle, spectra in the NUV-to-visual spectral range have now been acquired for cold, free PAH molecules in the gas phase, making it possible, for the first time, to unambiguously search for the signature of specific PAH molecules in astronomical spectra (see Figures 3–9) and closely compare band profiles (Figures 10 and 11). This level of scrutiny was not possible in our previous survey (Salama et al. 1999) where we did not have access to gas-phase data and was only made possible by major advances in laboratory astrophysics techniques with the advent of CRDS. The gas-phase electronic spectra of the cold, neutral PAHs methylnaphthalene (C11H10), acenaphthene (C12H10), phenanthrene (C14H10), anthracene (C14H10), pyrene (C16H10), 2,3-benzofluorene (C17H12), perylene (C20H12), pentacene (C22H14), benzo[ghi]perylene (C22H12), and hexa-peri-hexabenzocoronene (C42H18) were compared with high S/N astronomical spectra of 15 selected reddened stars (Figures 3–11 and Table 2).
Three main conclusions can be derived from this comparative survey.
First, a global examination of the spectra of the PAH molecules measured in free jet expansions confirms the general PAH spectral characteristics that were previously derived and reported for PAHs measured in solid inert gas matrices (Salama et al. 1999), i.e., that PAH spectra can generally be characterized by one to two strong features and several related weak bands. The weaker bands associated with a specific PAH are expected to be observed only when the strongest PAH feature is associated with one of the strong or moderately strong, well-known DIBs. Inversely, if the strongest feature of a PAH corresponds to one of the weak DIBs observed in the astronomical spectra (i.e., the features observed at the level of detection shown in Figures 3–11), there is, obviously, no possibility of detecting the weaker PAH band relatives which are estimated to be not deeper than 0.001 of the continuum. In other words, there are two scenarios which can be met while attempting to identify specific DIBs with specific PAH: (1) a situation where many absorption bands of a single PAH correlate with a combination of strong and weak DIBs. This is the most rewarding situation where a decisive and unambiguous spectral identification can be made based on the comparison of the wavelength positions, energy intervals, and relative intensities of numerous bands; (2) a situation where the strongest absorption band of a PAH correlates with a weak DIB. This in itself does not represent a spectral fit. The assignment gains credibility, however, if a significant number of PAH are found to be correlated with weak DIBs along many lines of sight and the correlation is found to increase with reddening.
Second, and most importantly, this survey shows that the first direct comparison of the spectra of a sample of 10 neutral PAH molecules measured under relevant astrophysical laboratory conditions (i.e., free, cold molecules) with high S/N astronomical spectra measured along the lines of sight of a set of 15 selected reddened stars does not lead to the identification of DIBs. The stellar spectra do not contain telluric features which could prevent the detection of weak PAH bands. Accurate upper limits for the abundances of the neutral PAHs population along those lines of sight are derived from this comparison.
Third, the gas-phase laboratory spectra of jet-cooled PAHs allow us to determine the intrinsic band profiles of the cold molecules and show that neutral PAHs exhibit band profiles that are closely similar to the profiles of some DIBs (e.g., see Figures 10 and 11). The case is strikingly illustrated in the comparison of the 5362.8 Å band of neutral pentacene, (C22H14), with the narrow (2 Å FWHM) 5363.8 Å DIB detected along the individual lines of sight we observed in our survey (Figure 10). The laboratory band for pentacene exhibits a 1.9 Å FWHM, while the DIB feature extracted from the average spectrum shows a 2.1 Å FWHM. Note that the laboratory spectrum of C22H14 exhibits another band of comparable strength at 5339.5 Å where only a weaker feature is found in the astronomical spectra (Figure 9) ruling the pentacene molecule out as a potential band carrier for the 5363.8 Å DIB. Similar observations are derived from the comparison of the absorption bands of pyrene (C16H10) with the set of weak DIBs observed in the 3160–3170 Å range (Figure 6). Here, too, both sets of bands have similar FWHM values (of the order of 1.0 Å). Here, too, again, the non-observation of DIBs at the position of the stronger pyrene absorption bands in the 3200–3210 Å range rules out the pyrene molecule as a potential band carrier for the DIBs seen in the 3160–3170 Å region.
We have shown that it is now possible—for the first time—to unambiguously search for the signature of specific PAH molecules and ions in space through a close comparison between intrinsic band peak positions and band structure (band profiles). This information cannot be obtained from IR data alone that is not characteristic enough and can only be retrieved from the UV and optical ranges. This is a requisite for demonstrating the presence of PAHs in the diffuse ISM. A new exciting era opens that will hopefully allow us to detect and/or rule-out specific PAHs in space and fully test the PAH proposal.
More astronomical surveys of DIB profiles in combination with improved modeling of stellar lines are now needed, especially in the ranges which have not been as yet frequently observed (NUV and NIR). The spectrograph used in this project is particularly adapted to this task and will be used to collect an extensive set of high-quality spectra of reddened stars. More laboratory measurements of direct absorption spectroscopy are also needed to measure the spectra of larger PAH molecules and their ions (both positive and negative) as well as radicals (hydrogenated and dehydrogenated PAHs). A new era begins for the search of complex molecules in space.
F.S. acknowledges the support of the NASA Space Mission Directorate (APRA Program). J.K. acknowledges the financial support of the Polish State during the period 2007–2010 (grant N203 012 32/1550). We are deeply grateful to the ESO archive as well as to the ESO staff members who assisted us while conducting our own observing runs. We also acknowledge the outstanding technical support provided by R. Walker at NASA ARC that made the laboratory measurements possible. Finally, we acknowledge the constructive and useful comments from the reviewer, G. Walker.