


ABSTRACT
Based on optical and infrared observations, we study the albedo and the temperature of the dust grains associated with the spectacular 2007 outburst of Jupiter-family comet 17P/Holmes. We found that the albedo at the solar phase angle ∼16° was 0.03–0.12. While the color temperature around 3–4 μm was 360 ± 40 K, the color temperature at 12.4 μm and 24.5 μm was ∼200 K, which is consistent with that of a blackbody. We studied the equilibrium temperature of the dust grains at 2.44 AU and found that the big discrepancy in the temperature was caused by the heterogeneity in particle size, that is, hotter components consist of submicron absorbing grains whereas colder components consist of large (≳1 μm) grains. The contemporaneous optical and mid-infrared observations suggest that the albedo and the temperature could decrease within ∼ 3 days after the outburst and stabilized at typical values of the other comets. We estimated the total mass injected into the coma by the outburst on the basis of the derived albedo and the optical magnitude for the entire dust cloud, and found that at least 4 × 10¹⁰ kg (equivalent to a few meter surface layer) was removed by the initial outburst event. The derived mass suggests that the outburst is explainable by neither the exogenetic asteroidal impact nor water ice sublimation driven by solar irradiation, but by an endogenic energy source. We conclude that the outburst was triggered by the energy sources several meters or more below the nuclear surface.
Export citation and abstract BibTeX RIS
1. INTRODUCTION
There has been no more dramatic comet outburst than the event of 17P/Holmes in 2007 since the development of modern astronomical tools (such as CCDs and infrared cameras). This paper attempts to study the albedo and the temperature of the dust grains associated with the 2007 outburst of 17P/Holmes through optical and infrared observations.
17P/Holmes was an undistinguished comet except for a spectacular outburst in 1892. It was discovered during the 1892 outburst (Barnard 1896). 17P/Holmes has a diameter of 3.42 km (Lamy et al. 2004) and orbital elements typical of the Jupiter-family comets (e.g., its Tisserand parameter with respect to Jupiter of 2.86). This comet passed through the perihelion at 2.05 AU on 2007 May 4.5 UT and underwent an outburst on 2007 October 23.7–23.8 UT at 2.44 AU from the Sun (Sekanina 2009; Hsieh et al. 2007).
From 2007 October 23 to 25, its brightness increased by about a million times within a couple of days, with the apparent magnitude rising from ∼17 to ∼2.5 (Lin et al. 2009). Sekanina (2009) compiled optical magnitude data and derived the onset time of the outburst of October 23.7 (or 172.2 ± 0.2 days after the perihelion passage). He deduced the duration of the active phase of the outburst of 2.3 ± 0.3 days. After the termination of the activity on October 25.9, the total magnitude was constant over >10 days. He interpreted it as evidence that the dust particles were no longer supplied from the nucleus after October 25.9. On the contrary, based on the radio observations, Altenhoff et al. (2009) interpreted the data as indicating that the nucleus had been activated by the outburst and its activity continued over 30 days. The optical spectrum taken at the first phase of the outburst was a strong continuum emission, which suggests that the dust particles were the dominant composition contributing to the scattered light (Kobayashi et al. 2007; Wagner et al. 2007). The optical color was slightly reddish, indicating the particles to be larger than those of the optical wavelength (Lin et al. 2009). Near-infrared spectroscopy revealed the existence of both hot dust particles (360 ± 40 K) and icy particles. It was suggested that cold icy grains and hot grains were not in thermal contact (Yang et al. 2009). On the other hand, a mid-infrared observation showed the 11.2 μm peak of the crystalline silicate feature onto the broad amorphous silicate feature. The mid-infrared color temperature was estimated to be ∼200 K, which is consistent with or slightly higher than the blackbody temperature (Watanabe et al. 2009).
It should be pointed out that the color temperature derived by the near-infrared observation is almost twice that of the mid-infrared observations. This large discrepancy cannot be explained by a measurement error. The question we have to consider first is this temperature discrepancy. The albedo and the temperature could yield important information about the composition and total mass of the particles, which might afford clues to the mysterious megaburst of 17P/Holmes. In this paper, we review the observational data obtained during the initial phase of the outburst and study the albedo and the temperature of the dust grains. Based on the results, we compute the ejecta mass by the outburst.
2. OBSERVATIONS AND THE DATA REDUCTION
The data presented in this paper were taken at Kiso observatory using the 1.05 m Schmidt telescope, Ishigakijima Astronomical Observatory 1.05 m telescope, and Subaru 8.2 m telescope. The journal of the observations is shown in Table 1. Figure 1 shows the optical contour maps, where Subaru's field of view is also displayed for comparison. Due to the limited field of view beyond the near-infrared wavelength, only optical images could covered the entire dust cloud. As shown below, we have also considered the data by Yang et al. (2009) in our analysis. A more detailed description of the observations is given in the next subsections.
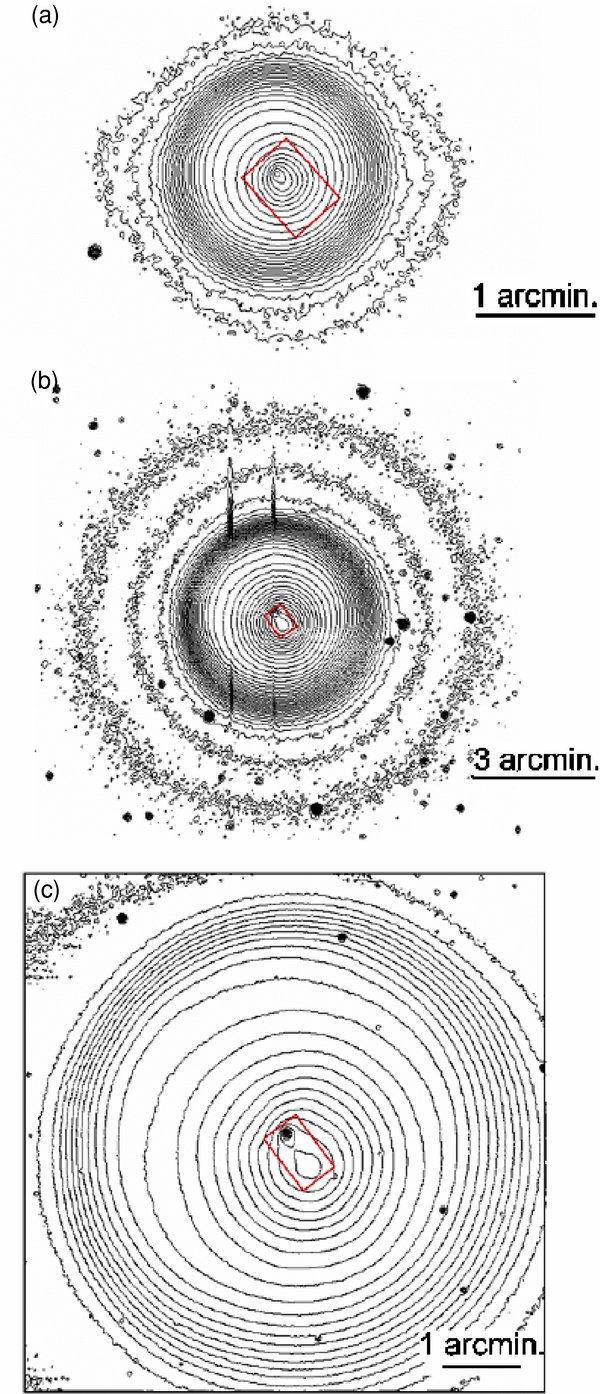
Figure 1. Rc-band (wavelength 0.64 μm) contour maps of 17P/Holmes on 2007 October 25 (a), October 27 (b), and October 28 (c) in arbitrary units. These images have the standard orientation in the sky, that is, north is up and east is to the left. The rectangles near the center denotes the field of view of Subaru/COMICS. (a) and (c) were taken at Ishigakijima and (b) at Kiso. The outer square in (c) corresponds to the field of view of Ishigakijima/Apogee U6. Two vertical lines in (b) are due to defective pixels on 2KCCD.
Download figure:
Standard image High-resolution imageTable 1. Observational Circumstance
| Observatory | Instrument | Date (Δt) | Filter | Exptime | α | rh | Δ | References |
|---|---|---|---|---|---|---|---|---|
| Kiso | 2KCCD | Oct 27.65 (+4.0) | Rc | 1 | 16 | 2.45 | 1.63 | (1) |
| Kiso | 2KCCD | Oct 30.65 (+7.0) | Rc | 1 | 15 | 2.46 | 1.62 | (1) |
| Ishigakijima | Apogee U6 | Oct 25.55–25.86 (+2.0) | Rc | 890 | 17 | 2.44 | 1.63 | (1) |
| Ishigakijima | Apogee U6 | Oct 27.55–27.86 (+4.0) | Rc | 4132 | 16 | 2.45 | 1.63 | (1) |
| Ishigakijima | Apogee U6 | Oct 28.62–28.87 (+5.0) | Rc | 2000 | 16 | 2.46 | 1.63 | (1) |
| Subaru | COMICS | Oct 25.45 (+1.8) | N8.8 | 30.8 | 17 | 2.44 | 1.63 | (2) |
| Subaru | COMICS | Oct 25.45 (+1.8) | N12.4 | 30.1 | 17 | 2.44 | 1.63 | (2) |
| Subaru | COMICS | Oct 25.45 (+1.8) | Q18.8 | 30.7 | 17 | 2.44 | 1.63 | (2) |
| Subaru | COMICS | Oct 25.46 (+1.8) | Q24.5 | 30.8 | 17 | 2.44 | 1.63 | (2) |
| Subaru | COMICS | Oct 26.47 (+2.8) | N8.8 | 32.5 | 16 | 2.45 | 1.63 | (2) |
| Subaru | COMICS | Oct 26.47 (+2.8) | N12.4 | 21.2 | 16 | 2.45 | 1.63 | (2) |
| Subaru | COMICS | Oct 26.48 (+2.8) | Q18.8 | 30.1 | 16 | 2.45 | 1.63 | (2) |
| Subaru | COMICS | Oct 26.48 (+2.8) | Q24.5 | 30.8 | 16 | 2.45 | 1.63 | (2) |
| Subaru | COMICS | Oct 27.45 (+3.8) | N8.8 | 43.4 | 16 | 2.45 | 1.63 | (2) |
| Subaru | COMICS | Oct 27.46 (+3.8) | N12.4 | 63.6 | 16 | 2.45 | 1.63 | (2) |
| Subaru | COMICS | Oct 27.46 (+3.8) | Q18.8 | 60.3 | 16 | 2.45 | 1.63 | (2) |
| Subaru | COMICS | Oct 27.46 (+3.8) | Q24.5 | 60.7 | 16 | 2.45 | 1.63 | (2) |
| Subaru | COMICS | Oct 28.43 (+4.7) | N8.8 | 75.9 | 16 | 2.45 | 1.63 | (2) |
| Subaru | COMICS | Oct 28.44 (+4.7) | N12.4 | 63.6 | 16 | 2.45 | 1.63 | (2) |
| Subaru | COMICS | Oct 28.44 (+4.7) | Q18.8 | 120.6 | 16 | 2.45 | 1.63 | (2) |
| Subaru | COMICS | Oct 28.45 (+4.8) | Q24.5 | 121.4 | 16 | 2.45 | 1.63 | (2) |
| IRTF | SpeX | Oct 27 (+3–+4) | 0.8–4.2 μm | ⋅⋅⋅ | 16 | 2.44 | 1.63 | (3) |
Notes. α, rh, and Δ denote the median Sun-Comet-Observer angle (°), the median heliocentric distance (AU) and the median geocentric distance (AU). Exptime means the total exposure time at each wavelength (s). Δt means the time (days) after the outburst on 2009 October 23.7 (Sekanina 2009). Position data are obtained from our numerical calculation using the orbital elements in JPL's on-line site. References. (1) This work; (2) Watanabe et al. 2009; (3) Yang et al. 2009.
Download table as: ASCIITypeset image
2.1. Optical Imaging at Kiso and Ishigakijima
The Rc-band images of 17P/Holmes were taken at Kiso Observatory (Nagano, Japan, 137°37'42 2E, 35°47'387N, 1130 m) and Ishigakijima Astronomical Observatory (Okinawa, Japan, 124°08'214E, 24°22'223N, 196.7 m). The observations were carried out using the 2KCCD camera mounted on the 105 cm Schmidt telescope (F/3.1) at Kiso and Apogee U6 1 K × 1 K CCD camera on 105 cm Ritchey–Chrétien telescope (F/12) at Ishigakijima, respectively. The field of views of these instruments are 50' × 50' with a pixel resolution of 15 at Kiso and 6
 6 × 66 with a pixel resolution of 039 at Ishigakijima. The observations were performed by the observatory staff mainly for the public relations. The observed raw data were reduced using bias (zero exposure) or dark frames, plus flat-field data. The flattened images were known to be uniform in sensitivity at the ± 3% level around the area of 17P/Holmes. No photometric standard stars were observed at Kiso, while standard stars were observed at Ishigakijima. We calibrated the flux of the data using the field stars listed in the USNO–B1.0 catalog (Monet et al. 2003) and Carlsberg Meridian Catalog (Morrison et al. 1990) to eliminate the uncertainty of time-variable atmospheric absorption (in fact, the weather conditions were unstable during these optical runs). The photometric error was 0.2–0.3 mag.
2.2. Mid-Infrared Imaging by Subaru/COMICS
The mid-infrared images of 17P/Holmes were taken using COMICS (Kataza et al. 2000; Okamoto et al. 2003) mounted on the 8.2 m Subaru Telescope from 2007 October 25 to 28 UT. The details of the observations were given in Watanabe et al. (2009). The combination of COMICS and Subaru telescope provides an imaging capability of 40'' × 30'' field of view with spatial resolution of 013 pixel−1. We used four different filters, that is, 8.8 μm (Δλ = 0.8 μm), 12.4 μm (Δλ = 1.2 μm), 18.8 μm (Δλ = 0.9 μm), and 24.5 μm (Δλ = 0.8 μm) bands. To eliminate the high sky background at mid-infrared wavelengths, we applied the secondary mirror chopping technique with a 60'' throw. HD21552 was observed for the photometric standard stars. We applied a standard reduction procedure of mid-infrared data taken on the ground-based observatories, i.e., chopping subtraction and flat fielding. Note that the mid-infrared images did not cover the entire dust cloud because of the narrow field of view (see Figure 1). Due to the low chopping frequency, the sky emission was not completely canceled out. In addition, some fraction of the thermal radiation of the dust grains was also subtracted through the chopping subtraction technique. This makes it difficult for us to determine the absolute brightness of the 17P/Holmes dust cloud. Therefore, we do not deal here with the absolute brightness of the entire dust cloud. We examined the brightness of the distinctive features by the aperture photometry. We set the same aperture size and the same location in the sky for the aperture photometry when we compared the optical and this mid-infrared data. The flux calibration error was ∼10% at most.
2.3. The Other Data Sources
In addition, we made use of not only our data above but also the near-infrared data. It was acquired on 2007 October 27 using the NASA Infrared Telescope Facility (IRTF) 3 m telescope atop Mauna Kea, Hawaii, with SpeX, when we made observations in both optical and mid-infrared wavelengths (Yang et al. 2009). We compared our data with these to find whether or not our data and those by Yang et al. (2009) are consistent (especially inconsistency in the color temperature). They used 03 × 15'' slit and adopted the point source extraction algorithm using an average extraction aperture box width of 9''. The resultant spectrum appears in Yang et al. (2009). We extracted the data values from the figures in the paper and compared our results. Whereas the detailed observation times of IRTF/SpeX observation are not described in their reference, we ignored small differences in time (<0.5 days).
3. RESULTS
3.1. Definition of Terms
As noted by the previous studies (Watanabe et al. 2009; Montalto et al. 2008; Lin et al. 2009; Moreno et al. 2008), the morphology of 17P/Holmes was quite different from those of the normal comets. It was composed of (1) a spherically expanding envelope around the nucleus (hereafter SPHE), (2) a detached blob extended toward the southwest (BLOB), and (3) a central condensation (CENT). SPHE was not found in Subaru/COMICS images because of the narrow field of view (Figure 1). Similarly, SPHE and BLOB were not mentioned in the near-infrared observation. It is likely that SPHE and BLOB were out of the field of view of IRTF/SpeX or too broad to be detected by these measurements. Apparently, SPHE expanded radially enclosing both BLOB and CENT. The moving direction of BLOB was exactly in correspondence with the projected direction of the Sun and the comet vector, which leads to a presumption that BLOB was accelerated by the solar radiation pressure or the rocket force (Watanabe et al. 2009). CENT could be mainly composed of dust grains ejected with small ejection velocity by the initial outburst. Therefore, we may conjecture that larger particles were dominant in CENT. In addition, there could be fresh particles injected into CENT and SPHE following the initial outburst. Although it might be still an open question whether the 17P/Holmes dust cloud could be categorized into these three, we use SPHE, BLOB, and CENT in this paper for the sake of convenience.
3.2. Spectral Energy Distribution (SED) of CENT and BLOB
As we mentioned above, we cannot derive the albedo and the temperature of the entire dust cloud of 17P/Holmes because only the optical data could cover the whole cloud while the mid-infrared could cover CENT and BLOB. Hence, we derived the flux of the distinctive structures, i.e., CENT (within 9'' aperture diameter) and BLOB (within 15'' aperture diameter) by aperture photometry. We set the aperture of CENT to match the IRTF/SpeX measurement The results are shown in Figures 2–4. We found no obvious differences in spectral energy distribution (SED) shape between CENT and BLOB observed on October 24. In Figure 2(a), we also show the near-infrared spectrum taken by IRTF/SpeX. The near-infrared spectrum is smoothly connected to the optical data, implying that the calibration processes of these two data sets are consistent. In the SED, the dust cloud of 17P/Holmes was observable through the scattered sunlight in the optical and near-infrared wavelengths (λ < 3 μm) and observable through the thermal radiation in the mid-infrared wavelength. At shorter wavelengths (λ < 3 μm), the most significant spectral feature of 17P/Holmes is the negatively sloped continuum mainly originated in the solar spectrum. There is a deep absorption band around λ = 3 μm (Yang et al. 2009). As noticed by Yang et al. (2009), a weak but evident increase in flux was seen at λ>3.2 μm. There were strong silicate emission features at 10 μm and 18 μm as shown in Watanabe et al. (2009).
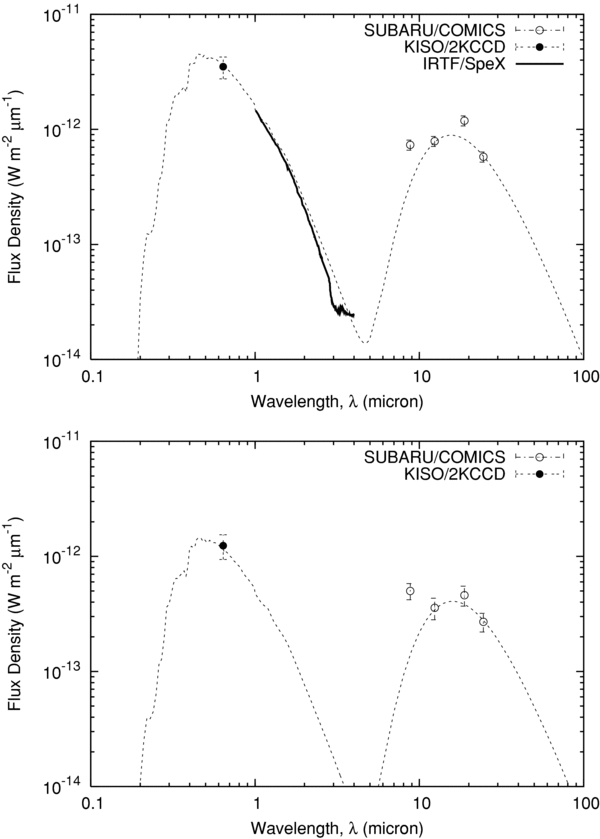
Figure 2. SED of 17P/Holmes on October 27 for the central condensation (CENT, within 9'' aperture diameter, upper) and the isolated dust cloud (BLOB, within 15'' aperture diameter, lower). Continuous curve was obtained by IRTF/SpeX observation (Yang et al. 2009). Dashed curve is an SED of graybody with Ap(α) = 0.043 and T = 186 K.
Download figure:
Standard image High-resolution image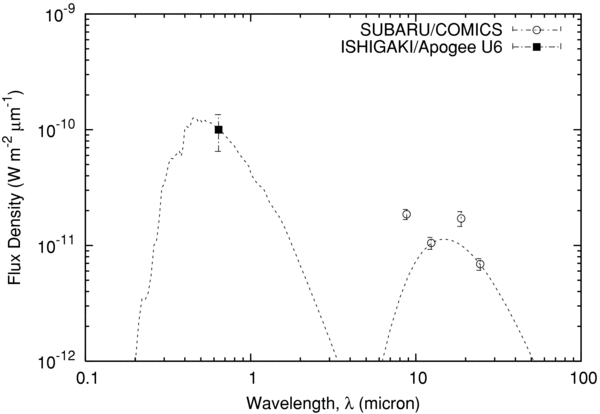
Figure 3. Same as Figure 2 for the central condensation but on October 25. dashed curve is an SED of graybody with Ap(α) = 0.12 and T = 195 K.
Download figure:
Standard image High-resolution image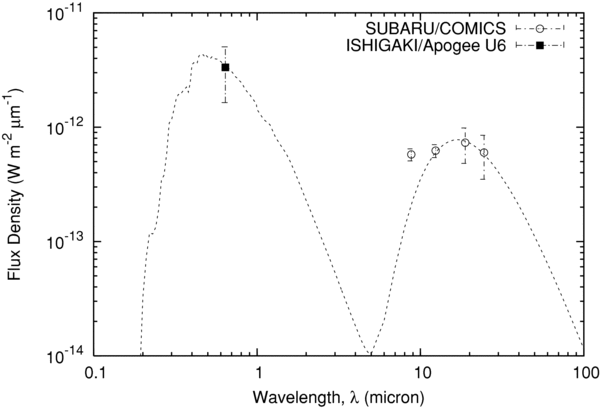
Figure 4. Same as Figure 2 for the central condensation but on October 28. Dashed curve is an SED of graybody with Ap(α) = 0.032 and T = 172 K.
Download figure:
Standard image High-resolution image3.3. Albedo and Temperature by Graybody Assumption
In estimating the albedo and the temperature of the particles in CENT and BLOB, we first assumed that the dust particle has a graybody property which radiates energy having a blackbody distribution reduced by a constant factor, and fit the optical and mid-infrared data. The emissivity, in this assumption, is considered to be independent of particle size and wavelength, in such a way that the entire dust cloud within the aperture behaves as a graybody. We consider the flux at 12.4 μm and 24.5 μm as the thermal continuum flux (discuss later). The model spectrum is shown by the dashed line in Figures 2–4. The best-fit parameters for the albedo and the color temperature are Ap(α) = 0.12 ± 0.04 and 195 ± 17 K on October 25, Ap(α) = 0.043 ± 0.013 and 186 ± 26 K on October 27, and Ap(α) = 0.032 ± 0.014 and 172 ± 35 K on October 28, respectively. There is no difference in the albedo and the temperature between CENT and BLOB (see Figure 2). The similarity between BLOB and CENT would suggest that optical properties of the dust grains in these different dust clouds are similar. Note that we use the albedo Ap(α) defined by Hanner et al. (1981) as the ratio of the energy scattered by particles at phase angle α to that scattered by a white Lambert disk of the same geometrical cross section. The J-band albedo of the other comets was derived to be 0.02–0.1 around the phase angle of 10°–20° (Hanner et al. 1985; Hanner & Newburn 1989; Hanner 2003), which is consistent with our results obtained after October 27 (i.e., 4 days after the outburst). However, we should point out the albedo obtained on October 25 (∼2 days after the outburst) was slightly larger than those of the other comets. The color temperature of 17P/Holmes is consistent with that of a blackbody at 2.44 AU (i.e., 179 K), as already pointed out by Watanabe et al. (2009). It is not obvious but likely that the albedo and probably the color temperature could decrease over the observed duration. The silicate feature could also decrease over 3 days (Table 2).
Table 2. Parameters Used in this Study
| Date | T (K) | Ap(θ) | Iobs(18.8 μm)/Igray(18.8 μm) | Δt (days) |
|---|---|---|---|---|
| Oct 25 | 195 ± 17 | 0.12 ± 0.04 | 1.7 ± 0.3 | +1.8 – +2.0 |
| Oct 27 | 186 ± 26 | 0.043 ± 0.013 | 1.4 ± 0.2 | +3.8 – +4.0 |
| Oct 28 | 172 ± 35 | 0.032 ± 0.014 | 1.0 ± 0.2 | +4.7 – +5.0 |
Download table as: ASCIITypeset image
3.4. Albedo and Temperature by Heterogeneous Size Model
In Figure 2(a), we ignored the observed data at 3–4 μm for the graybody fitting because we could not fit both 3–4 μm and 9–25 μm spectra with a single color temperature. The fitted SED decreases monotonically at wavelengths ≲5 μm but the observed SED shows the minimum around 3–4 μm. Yang et al. (2009) attributed the decreased negative slope to the thermal radiation of the dust grains, and derived the color temperature 360 ± 40 K. Since the flux contribution of the graybody at 170–200 K is negligible around 3–4 μm, it is reasonable to think that the temperature of the dust particles in the cloud is not homogeneous. What caused this lack of uniformity in the temperature?
The equilibrium temperature of the dust particles can be computed by considering the thermal equilibrium, i.e., a balance between the input solar energy on a grain (Ea) and the output energy from a grain (Er) plus sublimation energy (Es, if it includes volatiles), that is, Ea = Er + Es. For the dust particles which have no icy inclusions, we can ignore the sublimation energy Es. These energies are defined by Mukai (1986) as follows:
and
In Equation (1), S☉(λ) is the solar flux at 1 AU at the wavelength λ and rh is the heliocentric distance of the dust particle, which has a radius a and a complex refractive index m*(λ). For the solar spectrum S☉(λ), we use the data in Mukai (1989). We assume a spherical particle for simplicity in calculation, i.e., the efficiency factor for absorption and emission Qabs is obtained by Mie theory as functions of a and λ (Bohren & Huffman 1983). We are not concerned in this paper with the application of nonspherical particles due to the difficulty in Mie theory (Bohren & Huffman 1983), although there are challenging methods of calculation of the optical properties of irregularly shaped particles such as the discrete dipole approximation (DDA) and T-matrix method (Draine 1988; Mishchenko et al. 1996). For a heterogeneous material consisting of an icy matrix embedded with small refractory inclusions, the Maxwell–Garnett mixing rule to calculate m* is applied (Mukai 1986). ρw and Lw in Equations (3)–(4) denote the mass density of grain material and the latent heat of sublimation of ice. In Equation (2), B(λ, Teq) means the Planck function at the grain temperature Teq. The rate of size decrease |da/dt| is shown in Equation (4), where μ is the mean molecular weight of the evaporated molecules and mp and k are the atomic mass unit and the Boltzmann constant, respectively. Since the water ice is the dominant volatile around 2.44 AU, we consider the sublimation of water ice. We apply a functional form of the latent heat of water ice sublimation in Delsemme & Miller (1971). In Equations (3) and (4), we apply μw = 18 and ρw = 1 g cm−3. In Equation (4), the saturated vapor pressure of water pw(T) is given by the Clausius–Clapeyron equation.
We solve this energy balance at 2.44 AU for icy heterogeneous grains (what is called, dirty water ice in Mukai 1986), absorbing grains (magnetite, graphite, amorphous carbon; Kelley & Wooden 2009; Ootsubo et al. 2007), and silicate grains (Draine & Lee 1984) as a function of grain radius (Figure 5). We applied the optical constants of magnetite, graphite, and water ice in Mukai (1989) and amorphous carbon in Preibisch et al. (1993). In Figure 5, we also show the color temperature derived by Yang et al. (2009) and ourselves. Strictly speaking, the color temperature of the grain is not the same as its equilibrium temperature, because the emissivity at infrared wavelengths (where the color temperature is estimated) depends on the wavelength. However, we assume that the wavelength dependence of emissivity is weak in the middle infrared wavelengths, except for remarkable silicate features. The temperature of a grain with a ≳ 1 μm becomes almost independent of the radius and close to the blackbody temperature. On the other hand, the temperature of a small grain with a < 1 μm is largely dependent on the compositions. Only small (a < 1 μm) dry absorbing particles without icy inclusion show the equilibrium temperature >300 K. It is, therefore, likely that the hot dust particles derived by IRTF/SpeX observation are attributed to the small (a < 1 μm) absorbing grains while cold dust particles to the large (a ≳ 1 μm) grains. In addition, this computation suggests that pure water ice grains are less dominant in relation to the thermal radiation in the infrared wavelength.
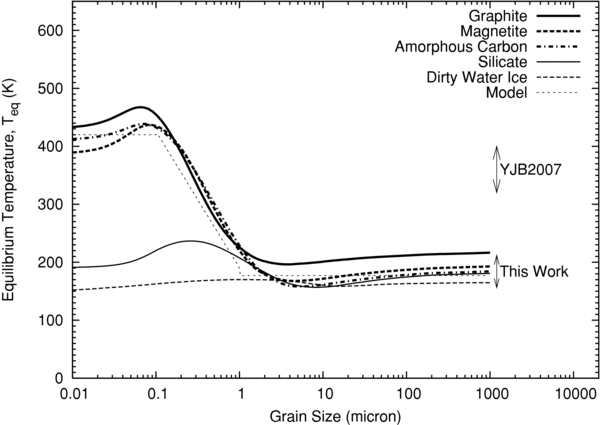
Figure 5. Equilibrium temperature Teq of a spherical grain with radius a at the solar distance rh = 2.44 AU. Two arrows labeled "YBJ2009 and "this work" are the derived color temperature at 3–4 μm and 9–25 μm, respectively.
Download figure:
Standard image High-resolution imageTo duplicate the observed spectrum of 17P/Holmes, we consider the absorbing materials composed of different sizes. We, thus consider the size dependence of the temperature for graphite, magnetite, and amorphous carbon as a representative of absorbing materials. We simplify the computed results of absorbing materials in Figure 5 as follows:
where C1 = 14909.9, C2 = −0.00679919, and C3 = −14719.4 (Figure 5).
A size distribution of the form
was used to fit to the thermal radiation spectrum of 17P/Holmes, where amin and amax are minimum and maximum radii of the grains, q the power index of the size distribution, and N the reference number of the particles. Although grains smaller than amin may be present in the cloud, we assumed that they do not contribute significantly to the observed brightness. The flux density Fλ is computed by integrating over the size distribution at each wavelength:
In Equation (7), we assume that the size of the dust particle is large enough to scatter the sunlight (i.e., a ≧ λopt/(2π)≈ 0.1 μm) because the dust cloud was reported to be distinctively red (Lin et al. 2009). We simplify the absorption efficiency as follows:
Figure 6 illustrates the model fit to the SED. We derived parameters amin, amax, q, and Ap(α) by the simplex method (Press et al. 1992). It is clear that, not only at optical and mid-infrared wavelengths but also at 3–4 μm, our heterogeneous grain size model fit the observed SED. The derived parameters are amin = 0.3 μm, amax>100 μm, q = −2.5, and Ap(α) = 0.032 ± 0.010, respectively. As mentioned above, the thermal radiation around 3–4 μm is sensitive to the small grains, that is, amin and q, but insensitive to amax. It is, therefore, important to notice that our estimate of amax is just a lower limit to the maximum size of the particles. It is worth noting that the derived q is larger than generally refereed values (−4 < q < −3). It is likely that large particles were dominant in the vicinity of the nucleus (within 9'' aperture) because small grains expanded rapidly via gas drag while large grains stayed there. Similar discussion is found in the polarimetric study of dust grains in CENT (Zubko et al. 2009). Assuming steady dust ejection with an ejection velocity given by vej∝ a−0.5, q = −2.5 in Equation (6) corresponds to q = −3 in the production size distribution. Considering the fact that the production rate decreased (Schleicher 2009), we expect q < −3 in the production size distribution, which is consistent with the other comets studies (see Section 3.5).
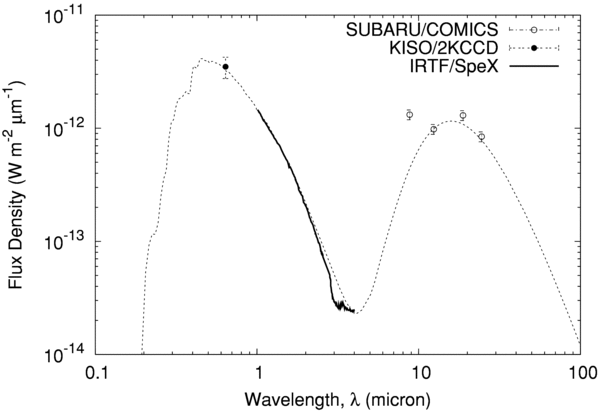
Figure 6. Spectral energy distribution of 17P/Holmes at 2.44 AU. Dashed curve is heterogeneous dust grain size model for absorbing grains.
Download figure:
Standard image High-resolution image3.5. Mass Erosion
We can evaluate the total mass of the particles lost by the outburst based on the albedo evaluated above. It was derived by several authors: Montalto et al. (2008) provided an estimate of the ejected dust mass during the outburst through the extinction of stars behind the dust cloud. Assuming small grains (0.005–1 μm), they obtained a mass between 1012–1014 kg. Sekanina (2008) estimated the mass by the optical magnitude of the whole cloud (i.e., SPHE+BLOB+CENT) on the plateau. He supposed the geometric albedo Ap(0°) = 0.04 and concluded the mass was near 1011 kg. Altenhoff et al. (2009) derived the mass using millimeter observation data near the nucleus (i.e., CENT), and deduced a mass of 4.3 × 10¹⁰ (kg) at the time of the initial outburst.
While a huge number of particles was injected into CENT, BLOB, and SPHE during the initial outburst event, a small number of new particles could be resupplied continually from the new active region on the nucleus created by the initial event. Such an aftermath was ensured by the observations of OH (Schleicher 2009) and H2O (Dello Russo et al. 2008). Nevertheless, we would like to argue that a significant fraction of dust particles was ejected within a couple of days after the outburst because, as Sekanina (2008) asserted, the total magnitude became a constant value around this time. Here, we examine the total mass of CENT, BLOB, and SPHE which are presumably composed of the particles released by the initial event.
First, we derive the total (CENT+BLOB+SPHE) optical magnitude of 2.46 ± 0.20 on the basis of Kiso–Schmidt observation. We assume that the albedo of the dust particles was homogeneous over the entire dust cloud. The magnitude is translated into the cross-sectional area of 6.8 × 10¹³ m2 and 1.8 × 10¹³ m2 when we apply Ap(α) = 0.03 Ap(α) = 0.12. Hence, we follow the methodology employed by Sekanina (2008) in which he discussed the total mass by assuming the dust size distribution and the albedo. The total mass is given by
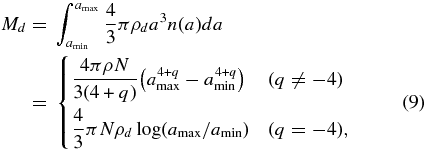
where ρd means the mass density of the dust particles. In Equation (9), a power index of the dust size distribution plays a critical role when we evaluate the total mass of the dust cloud. In the case of q < −4, both the brightness and the mass largely depend on the smallest grains. If q> − 3, both the mass and the brightness depend on the largest grains. The brightness and the mass become decoupled if −4 < q < −3 in which case the dust mass depends on the largest grains, while the brightness depends on the smallest grains. By tradition, it is generally believed that in the comae we see dust particles close to the observation wavelength (i.e., a≈0.1–1 μm). It could be presumed that implications in Montalto et al. (2008) were due to the tradition. Similarly, Sekanina (2008) supposed that the enormous cross-sectional area of the dust cloud resulted from microscopic grains and suggested that the particle-size distribution might be steeper than usual. He derived the mass of the dust particles supposing −4.5 < q < −4.
A near-nuclear dust cloud of 17P/Holmes was, however, detected in the radio wavelength for CENT (Boissier et al. 2008), suggesting that the particle size was large enough to radiate in the radio wavelength. Altenhoff et al. (2009) claimed Sekanina's assumption of grain size because such microscopic particles are too small to detect with radio or millimeter telescopes. It is appropriate to think that only CENT could be detected by their radio observations because the particles near the nucleus are large enough to radiate in the millimeter wavelength range. Moreno et al. (2008) studied the morphology of the dust cloud in terms of the dynamics of the particles, and found that >600 μm particles, which are much less sensitive to radiation pressure than micrometer-sized or smaller particles, could be ejected by the outburst. Evidence of such large particles is found to be ubiquitous in in situ observations (McDonnell et al. 1986; Tuzzolino et al. 2003), by the remote sensing observations of dust tail (Fulle 2004; Moreno 2009; Watanabe et al. 1990) and dust trail (Ishiguro et al. 2007; Ishiguro 2008; Sarugaku et al. 2007; Reach et al. 2000, 2007; Kelley et al. 2008), sub-millimeter and millimeter observations (Jewitt & Matthews 1997; Altenhoff et al. 1999). As a result of these studies, we found that the power index of the size distribution of almost all comets would be in the range of −4 and −3 (Fulle 2004). We would like to emphasize that the power indices for the debris associated with comet outbursts are also in this range, that is, −3.7 < q < −3.3 for 29P/Schwassmann–Wachmann 1 (Moreno 2009) and −3.4 < q < −3.3 for 73P/Schwassmann–Wachmann 3B (Ishiguro et al. 2009). Therefore, we will adopt an assumption of −4 < q < −3. Because q> − 4, the total mass of the fragments strongly depends on the largest fragment, that is, Md≈ 4πρNa4+qmax/(3/(4 + q)). Supposing that the mass density of the particles, ρd = 1 g cm−3, and applying Ap = 0.03 or Ap = 0.12, we can derive the mass of the particles ejected by the outburst.
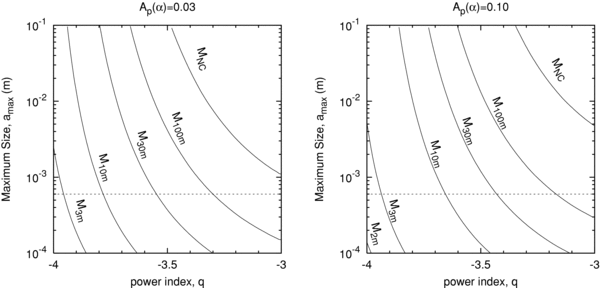
The result is shown in Figure 7. Although the power index of the size distribution q (probably in the range of −4 and −3) and maximum size of the particles amax (probably >600 μm; Moreno et al. (2008)) are not still well known, we can safely say that no less than 4 × 10¹⁰ kg of material, corresponding to the >2.5 m surface layer of the 3.42 km diameter body (we assumed the mass density of the nuclear surface layer of 0.45 g cm−3), was removed by the initial outburst. Note that the derived mass is a lower limit, although the mass (4 × 10¹⁰ kg) is close to that of previous studies (Sekanina 2008; Altenhoff et al. 2009). If dust emission were to take place on inhomogeneously distributed active areas on the nucleus, the derived depth (>2.5 m) would increase. Since the derived depth is deeper than a typical thickness of the surface inert dust mantle (∼1 m), we can conjecture that internal pristine materials were also ejected by the initial event and thereby the mid-infrared spectrum showed silicate features similar to Hale–Bopp (see the mid-infrared spectrum in Watanabe et al. 2009).
Figure 7. Total mass of dust particles (Ap(α) = 0.03 and Ap(α) = 0.12) lost by the initial outburst as a function of the maximum particle radius amax and the power index q of the size distribution (Equation (6)). MNC corresponds to the nuclear mass and  ,
,  ,
,  ,
,  , and
, and  denote the mass of 100 m, 30 m, 10 m, 3 m, and 2 m surface layers. The dashed line denotes the lower limit of amax derived by the morphology (Moreno et al. 2008).
Download figure:
Standard image High-resolution image
4. DISCUSSION AND SUMMARY
In Section 3.3, we suggested that the albedo and the color temperature decreased as time passed. Silicate features could have also decreased (see Table 2). We cannot rule out the possibility of SED model fitting dependence. In general, high color temperature could result in high albedo, while low color temperature could lead to low albedo. In our graybody fitting, there are only two data points at 12.4 μm and 24.5 μm, which may not be enough to rely on the color temperature in the mid-infrared wavelength. Contaminations by silicate features might not be insignificant. The spectrum of Hale–Bopp at 2.9 AU suggests that there is no contamination at 12.4 μm but about 40% contamination at 24.5 μm (Crovisier et al. 1997). Since the spectra of 17P/Holmes are not available around these wavelengths on these nights, we cannot derive the fitting of the continuum emission. Considering the 40% contamination of silicate features, we found that the color temperature and the albedo, respectively, are 230 ± 20 K and 0.30 ± 0.10 on October 25, 215 ± 30 K and 0.10 ± 0.03 on October 27, and 200 ± 40 K and 0.08 ± 0.04 on October 28. The strength of the silicate feature, indicated by the ratio of the flux at 18.8 μm to that of the graybody, also decreased, from 2.4 ± 0.5 to 1.9 ± 0.3, and then to 1.3 ± 0.3 over the course of the three nights. But even so, both the albedo and the color temperature decreased in this case. Thus, we should consider the potential scenario to explain the variation. The sublimation of ice in the dust grains may change the albedo variation. Mukai et al. (1986) examined evolution of albedo of cometary heterogeneous ice grains, and found that the albedo could decrease due to the loss of volatiles because the external reflection dominates for the scattered light as decreasing icy component. Their result for the heterogeneous ice grains shows a tendency opposite to what our results indicate. It may be reasonable to think that high albedo particles such as pure ice grains and small absorbing particles made up a significant fraction in an early stage of the outburst (i.e., within a couple of days), and disappeared due to sublimation or movement related to high ejection velocity. Our assumption may support the conjectural existence of a pure ice layer beneath the surface of 9P/Tempel 1 (Yang et al. 2009; Sunshine et al. 2007). The Deep Impact space mission suggests the existence of pristine materials consisting of very fine-grained ice particles that are free of any impurities (Sunshine et al. 2007) below the surface inert dust mantle.
Comet outbursts are still enigmatic. In particular, the huge increase in brightness of 17P/Holmes is of great concern. We may expect that the brightness increase was caused by the impact of a small object on the surface crust composed of nonvolatile material as mentioned for its first outburst in 1982 (Barnard 1896). In fact, 17P/Holmes underwent an outburst in the middle of the main-belt asteroid region, and then we expect that an impact by an undetectable asteroid might hit 17P/Holmes and generate the ejecta. Thanks to advances in our understanding of small asteroids in the main belt, we are able to estimate the possibility of the asteroid impact quantitatively. To estimate the impactor size and impact frequency, we follow the method written in Yamamoto et al. (2010). The total mass of impact ejecta me(r) escaping from 17P/Holmes surface can be written by a scaling formula for the crater radius and the total mass of impact ejecta escaping from a target body (Yamamoto et al. 2010),
where r is a radius of an impactor, vi and ve are the impact velocity and the escape velocity, and ρi is the mass densities of impactor. Equation (11) was derived on the basis of the crater ejecta scaling law in the gravity regime (Housen et al. 1983). Assuming that both 17P/Holmes and impactor are homogeneous spheres having values of the parameters in Table 3, we obtain
Table 3. Parameters Applied in Section 4
| Parameters | 17P Nucleus | Dust Particles | Impactor | References |
|---|---|---|---|---|
| Rnc | 1710 m | Lamy et al. (2004) | ||
| ρnc | 450 kg m−3 | Davidsson et al. (2007) | ||
| Rickman (1989) | ||||
| ve | 0.86 m s−1 |  |
||
| Pi | 1.16 × 10⁻²⁴ m−2 yr−1 | Gil-Hutton (2000) | ||
| vi | 9.3 m s−1 | Gil-Hutton (2000) | ||
| ρd | 1000 kg m−3 | Harmon & Nolan (2005) | ||
| ρi | 3500 kg m−3 | Hawkes & Eaton (2004) | ||
| κ | 0.1–10 | Sykes & Walker (1992) | ||
| Singh et al. (1992) | ||||
 |
0.9 | Fernández et al. (2000) | ||
| ΔTOB | 2 × 10⁵ s | Sekanina (2009) |
Download table as: ASCIITypeset image
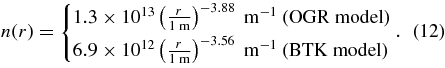
Substituting 4 × 10¹⁰ kg, which is the estimated minimum mass of the material ejected by the initial outburst of 17P/Holmes, into Equation (11), we obtain the radius of impact asteroid r>6 m. The size distribution of asteroids has been examined by many authors (Michel et al. 2009), and we apply the model by O'Brien et al. (2006, hereafter OGR) and Bottke et al. (2005, hereafter BTK) in the form given in Yamamoto et al. (2010). Thus, n(r)dr is given by
The total number of impacts Ncol(r) by asteroids with radii ⩾r into 17P/Holmes with radius of Rnc is given by
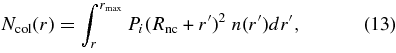
where Pi is the intrinsic collision probability of 17P/Holmes and rmax is the maximum radii of asteroids impacting into the comet. Substituting Equation (12) into Equation (13), we obtain
Equation (14) suggests that collisions with an asteroid of ⩾ 6 m could occur once every ⩾11 Myr (both OGR model and BTK model), which is more than 5 orders of magnitude longer than the frequency of 17P/Holmes outburst (several times per century if we consider the double outbursts in 1982 and single outburst in 2007). Consequently, the hypothesis of the interplanetary collision must be definitively ruled out.
We turn now to a consideration of the probability that the brightness increase on 2007 October 23 was caused by the solar radiation. We considered the energy balance on the surface of the icy body given by (Desvoivres et al. 1999, 2000; Ishiguro et al. 2009)
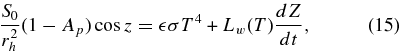
where S0 is the solar flux at 1 AU, z is the zenith distance of the Sun, is the emissivity, and σ is the Stefan–Boltzmann constant. The sublimation rate of the water ice is given by
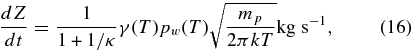
where κ is the water ice-to-dust mass ratio, defined as κ = ρw/ρd. γ denotes the sticking coefficient (Haynes et al. 1992; Enzian et al. 1997) given by
The total mass of the dust particle Md ejected within ΔTOB = 2.3 day (2 × 10⁵ seconds) after 2007 October 23.7 is therefore given by an integral over the sunlit hemisphere of  = 1710 m sized spherical body,
where f is the fractional active area. We used = 0.9. The dust mass was estimated to be in the range between 7.5 × 10⁶ f kg (κ = 0.1) and 5.6 × 10⁸ f kg (κ = 10). Since f < 1 by definition, the calculated dust masses are 2 orders of magnitude smaller than that of the mass we obtained from the observation (4 × 10¹⁰ kg). This result suggests that the large amount of mass released by the initial outburst could not be explained by water ice sublimation driven by solar irradiation.
There is, therefore, no doubt that the 17P/Holmes outburst was caused by a endogenously formed energy. Several possible endogenous scenarios have been presented to explain the cause of the outburst. It has been suggested that exothermic chemical reactions involving free radicals or pockets of volatile gas stored beneath the surface take place until pressure builds, finally leading to explosions. The phase change from amorphous to crystalline ice is an exothermic process giving a substantial amount of energy and triggering the outbursts. Sekanina (2009) and Altenhoff et al. (2009) support this idea. The vaporization of pockets of more volatile ices such as CO2 and CO could produce the outbursts. Schleicher (2009) speculate on this idea. Recently, Reach et al. (2010) guessed that the explosion was due to crystallization of ice and release of volatiles from interior amorphous ice within a subsurface cavity. Kossacki & Szutowicz (2010) simulate the evolution of a nucleus on the orbit of 17P/Holmes and found that the crystallization of the water ice itself is probably not sufficient. Although we derived the mass of the ejecta, we could not figure out the outburst mechanism. We hope that the minimum mass we derived here provides a clue to the mystery.
So far, we described optical and infrared observations, and study the albedo and the temperature of the dust grains associated with the spectacular outburst of Jupiter-family comet 17P/Holmes in 2007. We found:
- 1.the albedo at the solar phase angle ∼16° was 0.03–0.12,
- 2.the color temperature we derived at 12.4 μm and 24.5 μm on October 23 was 182 ± 26 K,
- 3.a large discrepancy in the color temperature between near-infrared and mid-infrared wavelengths could be explained by the mixture of small and large grains, and
- 4.at least 4 × 10¹⁰ kg materials (presumably not only the dust mantle but also the pristine layer beneath the surface) were lost in the initial event.
We express our appreciation to the observatory staff at Kiso Observatory, Ishigakijima Astronomical Observatory, Subaru telescope for their prompt attention to the sudden outburst of comet 17P/Holmes and allocation of observation time. We are also grateful to Professor N. Kawai and the gamma-ray bursts project members for furnishing their optical camera at Ishigakijima Astronomical Observatory. Development of the optical CCD camera at Ishigakijima Astronomical Observatory was supported by the Ministry of Education, Science, Sports and Culture, Grant-in-Aid for Creative Scientific Research. This work is supported by the Publications Committee at the National Astronomical Observatory of Japan.