


ABSTRACT
Near-infrared (near-IR) spectroscopic data for the five Seyfert galaxies with jet–gas interaction Mrk 348, Mrk 573, Mrk 1066, NGC 7212, and NGC 7465, taken with the Long-slit Intermediate Resolution Infrared Spectrograph near-IR camera/spectrometer at the William Herschel Telescope are reported. The long-slit spectra reveal the characteristic strong emission lines of this type of objects. Many forbidden transitions and hydrogen recombination lines are employed here to study the excitation and ionization mechanisms that are dominating the narrow-line region emission of these objects, that is affected by the radio–jet interaction. Several absorption features are also detected in the H and K bands of these galaxies, allowing us to identify the spectral types that are producing them. We find that the continuum can be reproduced by a combination of late-type stellar templates plus a blackbody component associated with hot dust, mainly contributing to the K-band emission. The detection of the permitted O i and Fe ii lines and broad components of the hydrogen recombination lines in the spectra of Mrk 573 and NGC 7465 allows the reclassification of these two galaxies that are not canonical Type-2 Seyferts: Mrk 573 is confirmed to be an obscured narrow-line Seyfert 1, and NGC 7465 is revealed for the first time as a Type-1 LINER through its near-IR spectrum.
Export citation and abstract BibTeX RIS
1. INTRODUCTION
Active galactic nuclei (AGNs) have been intensively studied in the optical due to the widely used ground-based visible spectrographs. However, there are very few detailed near-IR spectroscopic studies of AGN, particularly, of Seyfert galaxies. This spectral range offers a wide variety of diagnostic tools used to characterize relevant phenomena acting in the narrow line region (NLR), partially ionized media or borders of molecular clouds of AGNs. According to the unified model (Antonucci 1993; Urry & Padovani 1995), the differences between the spectra of Type-1 and Type-2 AGN are only due to orientation effects, as a consequence of the existence of a blocking structure of dusty material. Ways of unveiling the supposedly hidden broad line region (BLR) of Type-2 AGN are spectropolarimetric observations (Antonucci & Miller 1985; Tran 1995a, 1995b) and IR spectroscopy. Particularly, near-IR spectroscopy is well suited for detecting broad components in the hydrogen recombination lines through a less extinct line of sight (LOS). On the other hand, the nonstellar emission that dominates the ultraviolet (UV) and optical continuum in Type-1 Seyferts no longer dominates the near-IR emission (Kishimoto et al. 2005). Therefore, this range offers an opportunity to study the stellar content of the nuclear region of Seyferts and reveals signatures of recent or intense star formation.
Gas motions in the NLR are generally dominated by the gravitational field of the galaxy, with the line widths matching the bulge gravitational velocities (Whittle 1985; Wilson 1985; Whittle 1992; Nelson & Whittle 1996). However, in Seyferts with relatively strong radio emission there is evidence for significant jet-related additional acceleration (Ferruit 2002; Veilleux et al. 2002). In Seyfert galaxies presenting this jet–gas interaction, shocks can play several roles. They can compress and sweep the gas, ablate the clouds, destroy them, or even remain separate (Whittle & Wilson 2004). Shocks are usually determinant not only for the morphology, but also for the kinematics and excitation of the NLR. This makes the interaction between the radio-emitting flows and the line-emitting gas an interesting area of research in the study of AGN. For example, Hubble Space Telescope (HST) narrow-band imaging of high spatial resolution revealed bow-shock shaped emission-line regions in sources with jetlike radio structures (Pogge et al. 1996; Axon et al. 1998).
The high-excitation gas is usually confined to a biconical structure centred on the nucleus, usually seen in Seyfert 2 galaxies. The observed morphology of these ionization cones is generally well aligned with the radio emission (Allen et al. 1999), and their detection is usually taken as an evidence of the existence of an inner toroidal distribution of obscuring material (Mulchaey et al. 1996). The dominating excitation mechanism of the gas in the cones is the nuclear photoionization. However, the interaction with fast shocks seems to play an important role in the excitation of the NLR of Seyfert galaxies (Dopita & Sutherland 1995, 1996; Rosario et al. 2004; Ramos Almeida et al. 2006). In particular, for the case of Mrk 78, which is a classical example of a jet–gas interating AGN with large bipolar flows (Whittle et al. 1988; Pedlar et al. 1989), Ramos Almeida et al. (2006) presented evidences of the radio jet influence based on the detection of enhanced [Fe ii] emission and double-peaked profiles in the spectrum of the outer regions. In a similar study, Jackson & Beswick (2007) reported the existence of an extranuclear region with radio–jet interaction in Mrk 34, where the [Fe ii] is considerably enhanced.
We present here near-IR spectra of five nearby Seyferts presenting jet–gas interaction and optical ionization cones. Extended NLR emission has been reported and characterized by other authors for some of the objects (e.g., Mrk 573, Falcke et al. 1998; Ferruit et al. 1999 or Mrk348, Alonso-Herrero et al. 1998). The high quality of our data permits us to assess the presence of extended line emission up to hundreds of kiloparsecs in most of the galaxies considered here. In this paper, we report only about the nuclear properties. A detailed study of the extended emission will be the subject of a forthcoming paper (C. Ramos Almeida et al. 2009, in preparation). Numerous emission features, including both low- and high-ionization lines and molecular transitions are present in our nuclear spectra. We study the acting excitation mechanisms, together with other properties of the galaxies that can be derived from near-IR diagnostics (e.g., extinction). We analyze the continuum shape and dominant stellar populations toward the nucleus.
No previous high-quality near-IR spectroscopy is available in the literature for these galaxies, with the exceptions of Mrk 1066, observed by Knop et al. (2001) and Mrk 573 together with Mrk 1066, studied by Riffel et al. (2006). Indeed, the spectra presented here constitute a homogeneus data set, taken with the same instrument and covering the same spectral range. Several emission and absorption features detected in our spectra are not reported in previous works. Many of these lines, together with the detection of a broad pedestal in the Paβ profile of Mrk 573, have recently led to the reclassification of this galaxy as an obscured narrow-line Seyfert 1 (Ramos Almeida et al. 2008). Morphological classification of the galaxies, spectroscopic redshifts, distance, physical scale, galactic extinction amount (Schlegel et al. 1998), and hydrogen density column (Guainazzi et al. 2005; Awaki et al. 2006) are reported in Table 1.
Table 1. Basic Galaxy Data
| Galaxy | Morphology | zspec | Distance (Mpc) | Scale (pc arcsec−1) | E(B − V) (mag) | NH (cm−2) |
|---|---|---|---|---|---|---|
| Mrk 348 | SA(s)0/a | 0.015a | 60 | 291 | 0.067 | 1.3 × 10²³ |
| Mrk 573 | (R)SAB(rs)0+ | 0.017b | 69 | 333 | 0.023 | >1.6 × 1024 |
| Mrk 1066 | (R)SB(s)0+ | 0.012c | 48 | 233 | 0.132 | 9.0 × 10²³ |
| NGC 7212 | Sab | 0.027d | 106 | 516 | 0.072 | >1.6 × 1024 |
| NGC 7465 | (R')SB(s)0 | 0.007e | 26 | 127 | 0.078 | 4.6 × 10²³ |
Notes. Morphology of our targets taken from the NASA/IPAC Extragalactic Database (NED), spectroscopic redshift, distance, physical scale, galactic extinction amount, and hydrogen column density. The distance to the galaxies was determined using H0 = 75 km s−1 Mpc−1. References. (a) Huchra et al. (1999); (b) Ruiz et al. (2005); (c) Bower et al. (1995); (d) Keel (1996); (e) Lu et al. (1993).
Download table as: ASCIITypeset image
2. OBSERVATIONS AND DATA REDUCTION
Near-IR spectra in the range 0.8–2.4 μm were obtained from 2005 July to 2008 August, using the near-IR camera/spectrometer LIRIS (Long-slit Intermediate Resolution Infrared Spectrograph; Manchado et al. 2004; Acosta-Pulido et al. 2003), attached to the Cassegrain focus of the 4.2 m William Herschel Telescope (WHT). LIRIS is equipped with a Rockwell Hawaii 1024 × 1024 HgCdTe array detector. The spatial scale is 0 25 pixel−1, and the slit width used during the observations was 075 (allowing a spectral resolution of ∼450 and 500 km s−1 in the ZJ and HK ranges, respectively) except for the case of NGC 7212, for which the 1'' slit (∼600 and 650 km s−1 resolutions in the ZJ and HK ranges, respectively) was chosen because of the worse value of the seeing. The journal of the observations is reported in Table 2.
Table 2. Summary of Near-IR Observations
| Exposure Time | Airmass | |||||||
|---|---|---|---|---|---|---|---|---|
| Galaxy | Obs. Date | ZJ | HK | P.A. | ZJ | HK | Seeing | Telluric Star |
| Mrk 348 | 2005 July 7 | 12 × 300 s | 12 × 250 s | 155° | 1.30 | 1.10 | ∼ 08 |
Hip5671 |
| Mrk 573 | 2006 July 17-18 | 8 × 500 s | 8 × 400 s | 122° | 1.33 | 1.38 | ∼ 08 |
Hip2047 |
| Mrk 1066 | 2006 July 18a | 3 × 500 s | 8 × 400 s | 135° | 1.21 | 1.08 | ∼ 08/07 |
Hip8581 |
| NGC 7212 | 2006 July 16 | 6 × 500 s | 10 × 400 s | 145° | 1.14 | 1.06 | ∼ 1'' | Hip113977 |
| NGC 7465 | 2005 July 5-6 | 8 × 300 s | 12 × 300 s | 327° | 1.03 | 1.03 | ∼ 07 |
Hip1264/Hip198 |
Note. aThe HK spectra of Mrk 1066 was taken in 2008 August 12.
Download table as: ASCIITypeset image
Observations were performed following an ABBA telescope-nodding pattern, placing the source in two positions along the slit, separated by 15''. Individual frames were taken with the integration times reported in Table 2 in each of the ZJ and HK ranges. The wavelength calibration was provided by observation of the argon lamp available in the calibration unit at the A&G box of the telescope. In order to obtain the telluric correction and the flux calibration for each galaxy, nearby A0 stars were observed with the same configuration and the most similar airmass to the galaxy as possible (see Table 2).
The data were reduced following stardard procedures for near-IR spectroscopy, using the lirisdr dedicated software within the IRAF1 enviroment. For a detailed description of the reduction process, see Ramos Almeida et al. (2006). Consecutive pairs of AB two-dimensional spectra were subtracted to remove the sky background. The resulting frames were then wavelength-calibrated and flat-fielded before registering and co-adding all frames to provide the final spectra.
In order to study the nuclear emission of the five galaxies here considered, we have extracted the spectra covering 15 centered on the maximum of the galaxy profiles. The aperture was selected attending to the spatial resolution given by the seeing conditions.
The extracted nuclear spectra were then divided by their corresponding A0 spectra to remove telluric contamination. A modified version of Xtellcor (Vacca et al. 2003) was used in this step. The resulting nuclear spectra in the ZJ, H, and K bands are plotted in Figures 1–5, where the wavelength has been translated to the observer's rest frame. Note that the absolute flux calibration is intended to be an approximation since the spectra of the comparison star is likely subjected to slit losses due to centering and tracking errors. Nevertheless, the agreement in the continuum flux level in the overlap region for the ZJ and HK bands are quite good in spectral shape and absolute value.
Figure 1. Flux-calibrated spectra corresponding to the nuclear region of the galaxy Mrk 348 within an aperture of 15, in the ZJ, H, and K ranges. Note the red excess towards long wavelengths.
Download figure:
Standard image High-resolution image
Figure 2. Same as in Figure 1, but for Mrk 573. Note the broad wings of Paβ and Paα as well as the presence of the permitted Fe ii and O i lines.
Download figure:
Standard image High-resolution image
Figure 3. Same as in Figure 1, but for Mrk 1066. Note the presence of the intense H2 lines as well as the prominent He iλ2.06 μm line.
Download figure:
Standard image High-resolution image
Figure 4. Same as in Figure 1, but for NGC 7212.
Download figure:
Standard image High-resolution image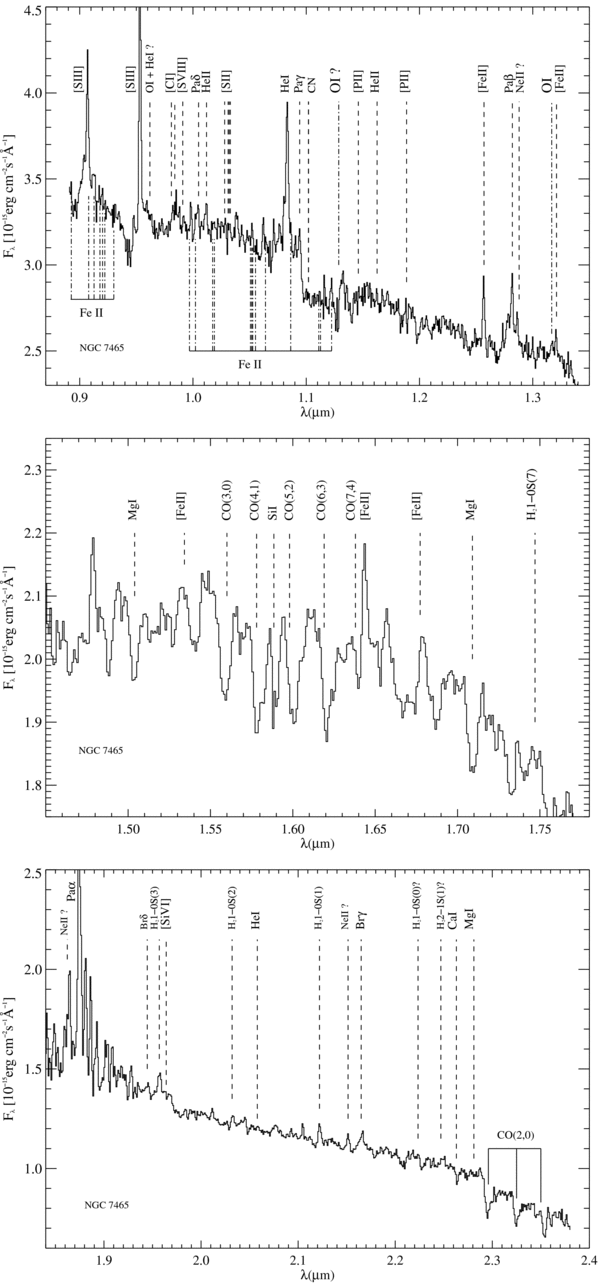
Figure 5. Same as in Figure 1, but for NGC 7465. Note the broad pedestals of Paβ and Brγ as well as the presence of the permitted Fe ii and O i lines.
Download figure:
Standard image High-resolution image3. RESULTS
3.1. The Emission Line Spectra
The nuclear spectra are plagued of emission lines, as can be seen in Figures 1–5. The features were measured by fitting a Gaussian using the Starlink program DIPSO. The resulting fluxes and FWHMs are reported in Table 3. In case of blended features two Gaussians have been employed to separate the different components. For example, the H2 1–0S(3) line is strongly blended with the coronal line [Si vi]λ1.963 in our resolution range.
Table 3. Measured Emission Lines
| Mrk 348 | Mrk 573 | Mrk 1066 | NGC 7212 | NGC 7465 | |||||||
|---|---|---|---|---|---|---|---|---|---|---|---|
| Line Nucleus | λ (μm) | Flux | FWHM | Flux | FWHM | Flux | FWHM | Flux | FWHM | Flux | FWHM |
| [S iii] | 0.907 | 63.4 ± 1.6 | 600 ± 20 | 116 ± 3 | 470 ± 20 | 157 ± 4 | 300 ± 20 | 35.2 ± 0.8 | 660 ± 30 | 21.5 ± 2.6 | 750 ± 170 |
| [S iii] | 0.953 | 141.3 ± 1.5 | 420 ± 10 | 279 ± 3 | 378 ± 8 | 429 ± 4 | 340 ± 10 | 82 ± 1 | 550 ± 10 | 32.3 ± 1.9 | ... |
| O i + He i ? | 0.962 | 5.9 ± 0.9 | 920 ± 110 | 26.5 ± 1.7 | 680 ± 50 | ... | ... | 5.6 ± 0.4 | 510 ± 60 | ... | ... |
| [C i] | 0.982 | 2.7 ± 0.6 | 680 ± 190 | 2.9 ± 0.6 | 260 ± 90 | 11.3 ± 2.4 | ... | 0.3 ± 0.6 | ... | 1.89 ± 1.27 | ... |
| [C i] | 0.985 | 5.1 ± 0.4 | 420 ± 50 | 5.4 ± 0.8 | 250 ± 90 | 40.4 ± 3.1 | 620 ± 70 | 2.3 ± 0.6 | 730 ± 260 | 2.57 ± 1.36 | 400 ± 400 |
| [S viii] | 0.991 | 2.1 ± 0.4 | 160 ± 90 | 13.6 ± 0.8 | 200 ± 40 | ... | ... | 1.6 ± 0.3 | 540 ± 180 | 3.1 ± 3.7 | 560 ± 560 |
| Paδ | 1.005 | 2.7 ± 0.4 | 260 ± 90 | 4.4 ± 0.5 | ... | 23.5 ± 1.4 | 30 ± 30 | 3.1 ± 0.3 | 560 ± 100 | 2.8 ± 0.9 | 400 ± 200 |
| He ii | 1.012 | 4.6 ± 0.4 | 520 ± 70 | 21.3 ± 0.8 | 510 ± 30 | 13.5 ± 1.7 | 560 ± 90 | 3.7 ± 0.3 | 570 ± 80 | 2.8 ± 0.8 | 190 ± 190 |
| [S ii] | 1.029 | 6 ± 1 | 500 ± 100 | 5.6 ± 0.7 | 210 ± 80 | 9.98 ± 1.34 | ... | 1.5 ± 0.5 | ... | ... | ... |
| [S ii] | 1.032 | 16.4 ± 1.4 | 1100± 100 | 9.4 ± 0.9 | 670 ± 90 | 30.6 ± 1.8 | 650 ± 60 | 6 ± 1 | 1100± 190 | ... | ... |
| He i | 1.083 | 79 ± 2 | 540 ± 20 | 119 ± 2 | 370 ± 14 | 240 ± 4 | 410 ± 10 | 52.1 ± 0.6 | 580 ± 10 | 34.9 ± 2.9 | 1060 ± 130 |
| Paγ | 1.094 | 7.1 ± 1.2 | 650 ± 150 | 16.6 ± 1.6 | 430 ± 60 | 59.4 ± 3.7 | 240 ± 40 | 4.8 ± 0.6 | ... | 4.5 ± 1.4 | 220 ± 180 |
| O i | 1.128 | ... | ... | 2.6 ± 0.9 | ... | ... | ... | ... | ... | ... | ... |
| [P ii] | 1.147 | 1.6 ± 0.3 | 640 ± 140 | 3.3 ± 0.7 | 340 ± 140 | 18.9 ± 2.6 | 580 ± 120 | 0.8 ± 0.2 | ... | ... | ... |
| He ii | 1.163 | 0.7 ± 0.3 | ... | ... | ... | 3.81 ± 1.79 | ... | ... | ... | ... | ... |
| [P ii] | 1.188 | 2.9 ± 0.4 | 510 ± 120 | 3.4 ± 0.7 | ... | 33.6 ± 2.9 | 620 ± 90 | 2.8 ± 0.3 | 630 ± 90 | :1.6 | ... |
| [S ix] | 1.252 | 2.9 ± 0.7 | 500 ± 100 | 8.5 ± 0.7 | 200 ± 40 | ... | ... | 1.0 ± 0.2 | ... | ... | ... |
| [Fe ii] | 1.257 | 12 ± 1 | 400 ± 40 | 17 ± 1 | 620 ± 50 | 92.2 ± 1.9 | 360 ± 10 | 10.2 ± 0.4 | 750 ± 40 | 8.2 ± 0.7 | 200 ± 50 |
| Paβ narrow | 1.282 | 12.1 ± 0.6 | 340 ± 30 | 15.7 ± 1.3 | ... | 116.3 ± 2.8 | 160 ± 10 | 11.9 ± 0.5 | 580 ± 30 | 6.4 ± 1.6 | 120 ± 80 |
| Paβ broad | 1.282 | ... | ... | 16 ± 3 | 1700 ± 400 | ... | ... | ... | ... | 13 ± 3 | 2300 ± 450 |
| Ne ii ? | 1.287 | 5 ± 1 | 770 ± 140 | 10.3 ± 1.7 | 270 ± 50 | 15.7 ± 2.6 | ... | 4.6 ± 0.6 | 800 ± 150 | 2.2 ± 0.8 | ... |
| Ne i ? | 1.292 | 0.4 ± 0.2 | ... | 8.6 ± 0.9 | 350 ± 60 | 8.55 ± 2.55 | ... | 1.9 ± 0.5 | 450 ± 180 | ... | ... |
| O i | 1.317 | 2.3 ± 0.9 | 650 ± 200 | 8 ± 2 | 320 ± 100 | ... | ... | ... | ... | 3 ± 1 | 540 ± 260 |
| [Fe ii] | 1.321 | 10.8 ± 1.2 | 800 ± 100 | 13 ± 3 | 480 ± 160 | 33.5 ± 4.9 | 600 ± 100 | 3.5 ± 1.4 | 300 ± 200 | 3.1± 0.8 | ... |
| [Si x] | 1.430 | ... | ... | 17.3 ± 2.8 | 330 ± 80 | 11.4 ± 3.8 | 280 ± 120 | 2.2 ± 0.4 | 400 ± 100 | ... | ... |
| [Fe ii] | 1.533 | 2.2 ± 0.3 | 800 ± 150 | 7.7 ± 1.4 | 1200 ± 200 | 11.7 ± 3.4 | 580 ± 220 | 1.7 ± 0.3 | 970 ± 180 | 4.8 ± 1.7 | 930 ± 370 |
| [Fe ii] | 1.644 | 14.5 ± 0.6 | 660 ± 40 | 11.3 ± 1.8 | 510 ± 130 | 95 ± 4 | 330 ± 30 | 9.0 ± 0.3 | 720 ± 40 | 6.7 ± 1.4 | 350 ± 140 |
| [Fe ii] | 1.679 | 2.6 ± 0.6 | 640 ± 170 | 8.3 ± 2.4 | 1000 ± 300 | 16.99 ± 4.43 | 530 ± 160 | 2.0 ± 0.3 | 870 ± 110 | 6.8 ± 0.6 | 790 ± 80 |
| H2 1-0S(7) | 1.747 | 1.7 ± 0.3 | 870 ± 160 | 3.2 ± 2.1 | 680 ± 470 | 17.05 ± 4.14 | 850 ± 240 | 1.04 ± 0.43 | ... | 4.4 ± 1.1 | 1070 ± 250 |
| Ne ii ? | 1.866 | ... | ... | 17.1 ± 2.8 | ... | ... | ... | ... | ... | ... | ... |
| Paα narrow | 1.875 | 35.5 ± 1.5 | 440 ± 30 | 37.2 ± 8.6 | ... | 185 ± 34 | 910 ± 180 | 37.1 ± 1.8 | 620 ± 50 | 39.9 ± 3.7 | 390 ± 60 |
| Paα broad | 1.875 | ... | ... | 70.9 ± 10.1 | 1160 ± 210 | ... | ... | ... | ... | ... | ... |
| [S xi] | 1.920 | ... | ... | 9.2 ± 2.1 | 440 ± 110 | ... | ... | 0.7 ± 0.3 | ... | ... | ... |
| Brδ | 1.944 | 3.3 ± 1.3 | 900 ± 300 | ... | ... | 11.8 ± 2.6 | ... | 0.5 ± 0.2 | ... | ... | ... |
| H2 1-0S(3) | 1.957 | 3.4 ± 0.6 | 290 ± 120 | 6.6 ± 1.9 | 400 ± 200 | 36.1 ± 4.7 | ... | ... | ... | 4.05 ± 0.65 | 350 ± 80 |
| [Si vi] | 1.963 | 9 ± 1 | 450 ± 50 | 27 ± 2 | 350 ± 50 | 9.7 ± 3.1 | ... | 6.7 ± 0.4 | 610 ± 50 | 0.3 ± 0.4 | ... |
| H2 1-0S(2) | 2.032 | 0.88± 0.32 | 320 ± 220 | :3.8 | ... | 13.8 ± 1.6 | ... | 0.8 ± 0.1 | 810 ± 160 | 1.4 ± 0.3 | ... |
| He i | 2.060 | ... | ... | ... | ... | 24.7 ± 2.2 | 530 ± 70 | 0.7 ± 0.1 | 470 ± 150 | ... | ... |
| H2 1-0S(1) | 2.121 | 2.8 ± 0.3 | 140 ± 50 | 3.1 ± 1.3 | 190 ± 190 | 51.8 ± 1.9 | 220 ± 20 | 2.0 ± 0.2 | 600 ± 80 | 3.2 ± 0.4 | 200 ± 50 |
| Brγ narrow | 2.165 | 3.01± 0.42 | 400 ± 100 | 3.5 ± 1.4 | 300 ± 200 | 44.3 ± 1.8 | 100 ± 20 | 2.8 ± 0.2 | 550 ± 70 | 3 ± 1 | 540 ± 210 |
| Brγ broad | 2.165 | ... | ... | ... | ... | ... | ... | ... | ... | 18.3 ± 6.8 | 2900 ± 500 |
| H2 1-0S(0) | 2.222 | :0.6 | ... | :2.8 | ... | 16.4 ± 2.5 | 260 ± 70 | 0.6 ± 0.2 | 190 ± 190 | :1.6 | ... |
| H2 2-1S(1) | 2.248 | :0.6 | ... | :2.8 | ... | 8.11 ± 2.07 | ... | :0.6 | ... | :1.6 | ... |
| [Ca viii] | 2.322 | 1.98± 0.48 | 400 ± 100 | ... | ... | ... | ... | 0.7 ± 0.2 | ... | ... | ... |
Notes. Emission lines detected, central wavelength (rest frame), line fluxes (10−15 erg cm−2 s−1), and FWHM (in km s−1) corrected for instrumental broadening. Lines whose fluxes are reported and whose FWHM values are not, are narrower than the instrumental profile. For several faint transitions, the fluxes reported correspond to an upper limit of 2σ (those beginning with:).
Download table as: ASCIITypeset image
The most prominent features in the nuclear spectra are [S iii]λλ0.907,0.953; He iλ1.083, [Fe ii]λλ1.257,1.644; Paβ; Paα; [Si vi]λ1.963; and Brγ (all the wavelengths are given in μm). Several other lower intensity lines are detected in our spectra, namely, [C i]λ0.985; [S viii]λ0.991; Paδ; He iiλλ1.012,1.163; [S ii]λ1.029,1.032 (the reddest line is indeed a blend of three [S ii] transitions); Paγ; [P ii ]λ1.147,1.188, [Fe ii]λλλλ1.295,1.321,1.533,1.679, He iλ2.058, and [Ca viii] λ2.322. The high-ionization transitions [S ix]λ1.252, [Si x] λ1.430, and [S xi]λ1.920 are also detected in the spectra of some objects. Broad wings in the Paβ and Paα profiles of Mrk 573 and in the Paβ and Brγ profiles of NGC 7465 are clearly detected, together with the permitted O iλλ1.128,1.317, Fe ii 9200 Å, and Fe ii 1 μm lines.
A noticeable feature at 0.962 μm is clearly detected very close to the [S iii]λ0.953 line in Mrk 348, Mrk 573, and NGC 7212 (see top panels of Figures 1, 2, and 4). In NGC 7465 it seems to be blended with the [S iii] line (see Figure 5). The detection of this line in Mrk 573 was firstly reported by Ramos Almeida et al. (2008), and it was tentatively identified as O i (3D0–3D) or He i (1P0–1D). A blend of both transitions cannot be discarded, considering the large FWHM of the line (see Table 3).
Emission from the H2 molecule is clearly detected in the galaxies of our sample, except for Mrk 573. The most prominent transitions are H2 1–0S(3), H2 1–0S(2) and H2 1–0S(1). In the H band, the H2 1–0S(7) line is detected in most for the galaxies, whereas both the H2 2–1S(1) and H2 1–0S(0) emission lines are barely detected at ⩽ 2σ level in the majority of the galaxies, except in the case of Mrk 1066.
3.2. The Absorption Line Spectra
Various stellar absorption features populate the H and K nuclear spectra of our galaxies (see Figures 1–5). The most prominent ones are Mg i 1.50, CO 1.56, 1.58, Si i 1.59, CO 1.62, 1.64, and Mg i 1.71 (all wavelengths in μm) in the H band. These stellar features are named depending on their principal contributor, that depends on the spectral type. For example, for early M types, the Si i 1.59 absorption is due to silicon, whereas for very cool stars, OH dominates it (Origlia et al. 1993; Dallier et al. 1996). In the case of Mrk 573 and NGC 7465, also the CO 1.60 μm absorption band appears very deep. The 12CO(2,0) 2.29 band is detected in all the galaxies, together with the Ca i 2.26 and Mg i 2.28 μm bands. In the J range, it is noticeable the presence of the 1.1 μm CN band in the spectra of all the observed galaxies, firstly reported by Riffel et al. (2007) for Mrk 573 and Mrk 1066.
The equivalent widths (EWs) of the Si i 1.59, CO(6,3) 1.62, and CO(2,0) 2.29 μm bands are reported in Table 4 for the five galaxies in our sample. These absorption line features were measured using the Starlink program DIPSO.
Table 4. Absorption Line Spectra Measurements
| EW (Å) | |||||
|---|---|---|---|---|---|
| Galaxy/Star Class | Si iλ 1.589 | CO(6,3)λ 1.619 | CO(2,0)λ 2.29 | H-band Dilution | K-band Dilution |
| Mrk 348 | 1.0 ± 0.2 | 2.8 ± 0.2 | 1.1 ± 0.2 | 62%–66% (40%) | 92% (77%) |
| Mrk 573 | 1.2 ± 0.2 | 4.6 ± 0.3 | 8.0 ± 0.9 | 37%–46% (15%) | < 59% (45%) |
| Mrk 1066 | 3.0 ± 0.1 | 4.5 ± 0.4 | 12.7 ± 0.7 | ... (14%) | < 8% (48%) |
| NGC 7212 | 1.4 ± 0.2 | 5.4 ± 0.4 | 5.9 ± 0.9 | 26%–37% (0%) | < 69% (20%) |
| NGC 7465 | 1.8 ± 0.2 | 5.0 ± 0.3 | 10.5 ± 1.5 | 32%–38% (6%) | 24% (32%) |
| K5 III | 2.8 | 7.8 | 14.1 | ... | ... |
| M3 III | 2.9 | 8.1 | 15.3 | ... | ... |
| K4 I | 2.2 | 7.3 | ... | ... | ... |
| M1 I | 2.8 | 8.6 | 19.4 | ... | ... |
Notes. Absorption line EWs in the H and K bands for the five galaxies in our sample and for the two giant and supergiant stellar types considered. The last two columns correspond to the starlight dilution in the H and K bands. Values within parenthesis correspond to the dilution fraction obtained from the continuum fitting described in Section 4.2.
Download table as: ASCIITypeset image
4. DISCUSSION
4.1. The Underlying Stellar Population
To identify the spectral types that produce the absorption features in our galaxies to a first approximation, we compare our H-band spectra with digitally avalaible stellar templates from Dallier et al. (1996; see Figure 6). After visual inspection, it can be noticed that the nuclear spectra resemble those of late-type stars2. In order to establish which are the stellar populations dominant in each galaxy, measurements of the EWs of several absorption features (Si i 1.59 μm, CO(6,3) 1.62 μm, and CO(2,0) 2.29 μm bands; see Table 4) are compared with those derived from stellar spectra. The intrinsic stellar features reported in Table 4 have been computed after convolving by a Gaussian kernel, in order to match the resolution of our galaxy spectra.
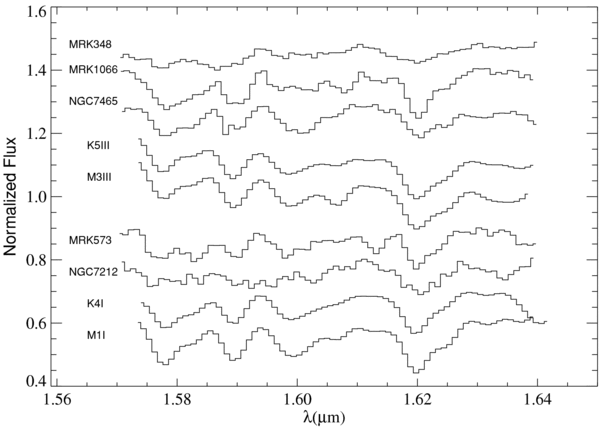
Figure 6. H-band spectra of Mrk 348, Mrk 1066, NGC 7465, and two giant stars (K5 III and M3 III types) at the top, and the same for Mrk 573, NGC 7212, and two supergiant stars (K4 I and M1 I) at the bottom. The spectra of stars have been convolved and rebinned in order to obtain the same resolution as those of the galaxy spectra. All spectra are normalized and shifted vertically for clarity.
Download figure:
Standard image High-resolution imageIn particular, the ratio of the EW of the 1.62 μm CO(6,3) feature to that of the 1.59 μm Si i is a good temperature indicator for late-type stars (Origlia et al. 1993). In this case, dilution and reddening effects are cancelled out, due to the closeness of the features in wavelength (Origlia et al. 1993; Förster Schreiber 2000; Ivanov et al. 2004). The EW ratio of the CO 1.62 feature to Si i 1.59 μm corresponds to late spectral types for all galaxies in our sample (see Table 4). Late-type giants are dominating the near-IR spectra of Mrk 348, Mrk 1066, and NGC 7465, which is consistent with the results obtained by Ramos Almeida et al. (2006) for Mrk 78 and those by Oliva et al. (1995) for a variety of AGN. The values of the CO 1.62 to Si i 1.59 ratio for Mrk 573 and NGC 7212 are larger, closer to late-type supergiants. Nevertheless, the use of this ratio to discriminate between old stellar population (red giants) and recent starburst (red supergiants) is not a reliable diagnostic (Oliva et al. 1995). A lower limit of ∼100 Myr can be estimated for the age of the nuclear stellar population of the studied galaxies, since intermediate-to-low-mass giants dominate the IR spectrum (Renzini & Buzzoni 1986).
As it is mentioned in Section 3.2, we detect the 1.1 μm band in the J range of all our nuclear spectra. A prominent CN band indicates the existence of thermal-pulsing AGB stars with ages ∼1 Gyr (Maraston 2005), and it is associated with the presence of bright carbon stars (Riffel et al. 2007). According to population synthesis models this feature appears very deep for ages ∼0.3–1 Gyr, becoming diluted for older populations.
The stellar features may be substantially diluted by the contribution of the nonstellar emission. Thus, the dilution fraction (D) can be estimated from the expression D = 1 − EWobs/EWint, being EWobs and EWint the observed and intrinsic EWs of a given absorption feature (Oliva et al. 1995), assuming a single stellar population. Dilution fractions in the H and K bands have been computed using the CO 1.62 μm and CO 2.29 μm features, respectively. For giant stars, digitally available spectra from Wallace & Hinkle (1997) are used. The resulting dilution factors are given in Table 4, together with those derived from the fits to stellar templates plus blackbody (BB) component described below in Section 4.2.
Summarizing, the stellar population present in the nuclear region of our five galaxies is dominated by late-type giants, although a low fraction of low-mass supergiants could be also present. The average age of these stellar populations must be between 100 Myr and 1 Gyr, according to the observed stellar features.
4.2. The Continuum Spectra
The near-IR continua of the five galaxies in our sample are shown in Figure 7. The normalized spectra are ordered from the flattest continuum (Mrk 348) to the steepest (Mrk 1066). The continuum of Mrk 348 presents a peculiarity, compared with the rest of the galaxies. There is a red excess, similar to the one observed in the spectrum of Mrk 1239 (Rodríguez-Ardila & Mazzalay 2006). These authors suggested the presence of a BB of T≃1200 K that would be dominating the emission in the L and M bands.
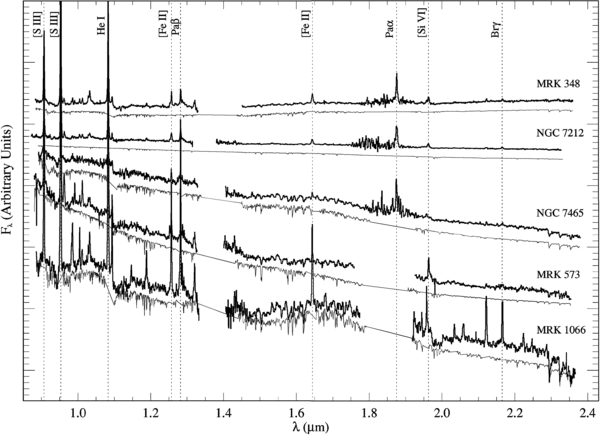
Figure 7.
Normalized nuclear spectra ordered according to their spectral shapes from the flattest continuum (top) to the steepest one (bottom). The fitted templates have been shifted vertically for clarity. The wavelength has been translated to the observer's rest frame. Most prominent emission lines are labelled. Color versions of the individual fits including residuals can be seen in the electronic edition of the Journal. An extended color version of this figure is available in the online journal
Download figure:
Standard image High-resolution imageGiven the multitude of stellar absorption features present in the nuclear spectra of our galaxies, it is reasonable to think that a major continuum contributor is the stellar population. In addition, it is expected that in the J band the emission from the active nucleus (that is the main contribution to the UV and optical ranges in Type-1 AGN) does not longer dominate (Kishimoto et al. 2005; Riffel et al. 2006). The reprocessed nuclear emission coming from hot dust emerges in the K band as an important source of continuum (Rodríguez-Ardila & Mazzalay 2006; Glikman et al. 2006). It seems clear that the best way of modelling the continuum of our galaxies must be based on a composition of stellar templates plus a nonstellar continuum which is a rising contribution at K band (BB). Indeed, the continuum spectra of our galaxies do not display a clear break at 1.1 μm, contrary to what is seen in the spectra of Type-1 Seyferts, similar to the findings reported by Riffel et al. (2006) for a large sample of AGN. This fact supports that a power-law component (associated to the active nucleus) is not relevant in this spectral range for Type-2 objects.
The continua have been fitted with stellar templates from the IRTF stellar library3 (Cushing et al. 2005; J. T. Rayner et al. 2009, in preparation), plus a BB component (see Figure 7 and Appendix). The relative contributions of the stellar template and BB component are allowed to vary freely. In addition, the stellar templates can suffer from a moderate amount of extinction, which is also a free parameter in the fitting process.
The stellar templates that produce the best-fitting model to the continuum range from spectral types K3 to M1, including dwarf and giant luminosity classes (see Appendix for details on individual objects). In some cases the CO(2,0) 2.23 μm bandhead and the depression at 1.1 μm cannot be reproduced by the best fitting template, suggesting the additional contribution of a population of giant or supergiant stars, depending on the primary template, to match the details of the absorption features. The required extinction of the fitted stellar templates is negligible in all cases except in Mrk 348 and Mrk 1066, for which is about E(B − V) = 0.12. In the case of Mrk 1066 this value is compatible with Galactic extinction (see Table 1). A non-negligible contribution of the nonstellar BB component at the K band is found for all the galaxies. Similarly, Glikman et al. (2006) showed that a BB component is almost ubiquitous in the near-IR spectrum of radio quiet AGN. The dilution fraction of the stellar spectra ranges from the lowest values of 20% in NGC 7212 and 32% in NGC 7465 to the highest value of 77% in Mrk 348 (see Table 4).
4.3. Extinction Towards the Nucleus
The near-IR spectral region offers new and more reliable reddening diagnostics, compared to the optical range. Few ratios of hydrogen recombination lines can be used as reddening indicators, together with suitable pairs of forbidden lines.
In order to estimate the obscuration of the nuclear region of our galaxies, we have employed the Paγ-to-Paβ and [Fe ii]λ1.257-to-[Fe ii]λ1.644 line ratios. The intrinsic Paγ/Paβ ratio depends on the density and temperature of the line-emitting gas (Hummer & Storey 1987). We have adopted theoretical values corresponding to Te = 10,000 K and Ne = 104 cm−3. In those cases where a broad component appears in Paβ (Mrk 573 and NGC 7465) the line ratio has been computed using only the narrow component. The Paα line was not used, because it is subject to strong telluric absorption. In contrast, the [Fe ii]1.257/1.644 line ratio seems to be a reliable indicator given the fact that it is less sensitive to the line-emitting gas density or temperature. The intrinsic value has been taken from Bautista & Pradhan (1998).
From the above line ratios, we have determined the optical extinction (AV) by using Draine's parametrization, Aλαλ−1.75 (Draine 1989). The results are reported in Table 5, and a comparison of the reddening estimations from both ratios is presented in Figure 8. As can be seen in this figure, there are discrepancies between the two reddening estimations, a fact already discussed in Riffel et al. (2006). The intrinsic ratio of the recombination lines is very likely affected by high density and radiation transfer effects. Assuming that the [Fe ii]1.257/1.644 line ratio is a more reliable indicator, an extinction sequence can be established from little reddened nuclei as Mrk 573 and NGC 7465 to the most reddened one, Mrk 348 (AV ∼ 6 mag), passing through NGC 7212 (AV ∼ 2 mag) and Mrk 1066 (AV ∼ 4 mag). It is noticeable that the two nuclei where broad emission lines have been detected present the less extinct NLRs. It is worth remembering that the extinction measured using this combination of narrow lines provides only an indication of the material located between us and the NLR. However, the innermost nucleus of the galaxy and the BLR may be hidden by a larger amount of material. In particular, the nondetection of broad wings (if a hidden BLR is already present) in the recombination lines implies nuclear AV > 10 mag (Veilleux et al. 1997).
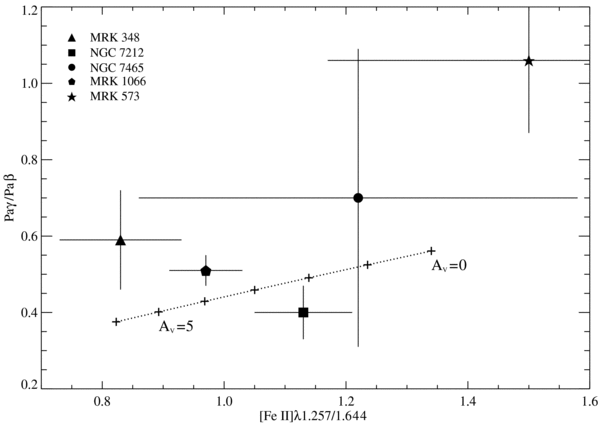
Figure 8. Paγ/Paβ vs. [Fe ii]λ1.257/1.644 for the five galaxies in our sample. The theoretical sequence of AV values is represented with the dashed line, with crosses marking increments of 1 mag.
Download figure:
Standard image High-resolution imageTable 5. Nuclear Extinction Measurements
| Mrk 348 | Mrk 573 | Mrk 1066 | NGC 7212 | NGC 7465 | |||||||
|---|---|---|---|---|---|---|---|---|---|---|---|
| Line Ratio | Theor. | Obs | AV | Obs | AV | Obs | AV | Obs | AV | Obs | AV |
| [Fe ii] 1.26/1.64 | 1.34 | 0.83 ± 0.10 | 5.89 | 1.50 ± 0.33 | ... | 0.97 ± 0.06 | 3.91 | 1.13 ± 0.08 | 1.97 | 1.22 ± 0.36 | 1.10 |
| Paγ/Paβ | 0.56 | 0.59 ± 0.13 | ... | 1.06 ± 0.19 | ... | 0.51 ± 0.04 | 1.42 | 0.40 ± 0.07 | 5.05 | 0.70 ± 0.39 | ... |
Notes. Theoretical values for the [Fe ii]1.257/1.644 ratio (Bautista & Pradhan 1998) and for the Paγ /Paβ ratio (Hummer & Storey 1987). Measured values of these ratios from our spectra, and optical extinctions calculated using Draine's parametrization are also reported.
Download table as: ASCIITypeset image
4.4. Coronal Lines
The simultaneous observation of very high- and low-ionization lines in the spectra of our Seyfert galaxies implies that a wide variety of physical conditions must co-exist in the nuclear region of these objects. This constitutes a characteristic feature of gas photoionized by a radiation source extending from the UV through the X-ray regime, typical of extreme energetic environments such as AGN (Prieto & Viegas 2000).
In particular, the detection of strong coronal lines (IP > 100 eV) such as [S viii]λ0.991, [S ix]λ1.252, [Si x]λ1.4304, [Si vi]λ1.963, and [S xi]λ1.920 in the spectra of some of our galaxies is a confirmation of their AGN nature. These transitions are strong in Mrk 348, Mrk 573, and NGC 7212 (see Figures 1, 2, and 4). These lines can be produced neither in starburst regions nor in low-luminosity AGN (LINERs) due to their high ionization potentials. Indeed, coronal lines can only exist very close to the ionization source, making them unique tracers of AGN activity and energetics. For the other two galaxies, Mrk 1066 and NGC 7465, these lines are extremely faint or undetected (see Figures 3 and 5), indicating that their nuclei are likely low-luminosity AGN (for a more detailed discussion of the individual properties of these objects see Appendices A.3 and A.5).
4.5. Photoionization Versus Shock Excitation
It is well known that strong [Fe ii] emission is indicative of shock-excited gas as occurs in the filaments of supernova remnants, in contrast to the weak [Fe ii] emission characteristic of photoionized gas as observed in H ii regions. In AGN, strong [Fe ii] emission is also common, although there is still some controversy about the dominant mechanism responsible for such emission. Several processes may contribute to the production of the [Fe ii] lines: (1) photoionization by extreme UV to soft X-ray radiation from the central source, producing large partially ionized regions in the NLR clouds; (2) interaction of radio jets with the surrounding medium, inducing shocks and hence partially ionized cooling tails; and (3) fast shocks associated with supernova remnants present in starburst regions. The [Fe ii]λ1.257/Paβ line ratio (or equivalently [Fe ii]λ1.644/Paα) is very useful for distinguishing between a stellar or nonstellar origin of the [Fe ii] emission. These line ratio increases from H ii regions (photoionization by hot stars) to supernova remnants (shock excitation), passing through starburst and active galaxies (Alonso-Herrero et al. 1997; Rodríguez-Ardila et al. 2004). Galaxies exhibiting [Fe ii]λ1.257/Paβ ratios lower than 0.3 are usually classified as starbursts, and those with values larger than 2 as LINERs. Seyfert galaxies are contained in the range of 0.4–2 (Larkin et al. 1998; Rodríguez-Ardila et al. 2004).
The above-mentioned line ratios for the five galaxies in our sample, plus the nuclear value of Mrk 78, taken from Ramos Almeida et al. (2006), are plotted in Figure 9. In the cases of Mrk 573 and NGC 7465, the narrow component of Paβ has been employed to compute the ratio, since both galaxies have also broad components of the recombination lines. For all the galaxies, the [Fe ii]λ1.257/Paβ nuclear ratio is within the expected range for Seyfert galaxies, although NGC 7465 approaches to the LINER regime.
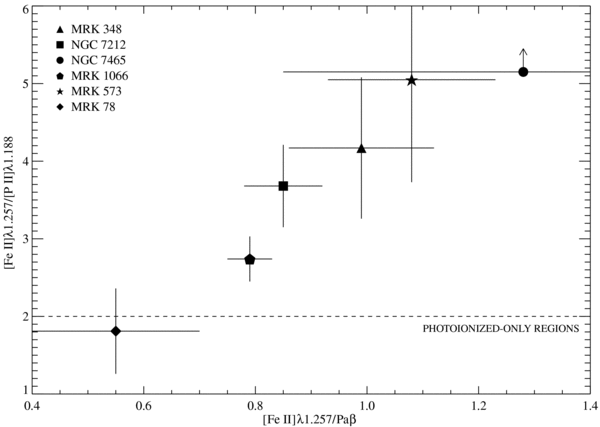
Figure 9. [Fe ii]λ1.257/[P ii ]λ1.188 vs. [Fe ii]λ1.257/Paβ for the five galaxies in our sample plus Mrk 78 (nuclear values taken from Ramos Almeida et al. 2006). Dashed line represents the upper limit for pure photoionized gas.
Download figure:
Standard image High-resolution imageAnother emission line useful for discriminating between the different excitation mechanisms acting in the NLR is [P ii ]λ1.188, which is detected in most of our spectra, together with the weaker [P ii ]λ1.147 transition. In particular, [P ii ]λ1.188 is very useful when compared with the [Fe ii]λ1.257 line (Oliva et al. 2001). Both lines are produced in partially ionized regions, having similar critical densities and excitation temperatures. However, iron is a well known refractory species and is strongly depleted in dust grains, whereas phosphorus is not. Photoionization alone is unable to destroy the tough iron-based grains that are easily sputtered by shocks, passing to gaseous phase. Thus, the [Fe ii]/[P ii] ratio is high (≳ 20) in fast shock-excited regions, and low (≲ 2) in pure photoionized regions (Oliva et al. 2001). Values of this ratio for our five Seyfert galaxies and Mrk 78 are reported in Figure 9. For all the sources, except for the nucleus of Mrk 78,5 the [Fe ii]/[P ii ] ratio is larger than the predicted value for pure photoionized regions, indicating that interaction with the radio emission likely increases the proportion of iron in the partially ionized regions of these galaxies. This is especially critical in Mrk 573 and NGC 7465, although they are still far from pure shock excitation.
4.6. Comparison with Photoionization Models
We employed the photoionization code Cloudy (calculations were performed with version C07.02.01 of Cloudy, last described by Ferland et al. 1998) trying to reproduce line ratios measured from our nuclear spectra. We have computed a grid of models based on photoionization by a given continuum and the expected physical conditions of the NLR. We used as ionizing continuum the so-called Table agn provided in Cloudy, that is very similar to that of typical radio quiet active galaxies (presented in Mathews & Ferland 1987). A plane–parallel geometry was employed, metallicity equal to 0.3 solar, and grains with similar properties to those of the Orion Nebula. Two different values of hydrogen density were explored, namely nH = 103 and 105cm−3. The ionization parameter U, defined as U = QH/(4πd2nHc) was varied between 10−4 and 10.
Line ratio diagrams are shown in Figure 10 for the following combination of lines: [Fe ii]λ1.644/Paβ versus He iλ1.083/Paβ and He iiλ1.012/Paβ versus [S iii]λ0.953/Paβ, respectively. The dotted and dashed lines represent the computed line ratios for the two hydrogen densities considered, varying the ionization parameter from log U = 1 to −4 with a step of 0.5. Values of the observed line ratios from Table 3, corresponding to the five galaxies considered in this work are overplotted for comparison with our calculations made with Cloudy. We have also included the nuclear Mrk 78 measurements in these diagnostic diagrams (Ramos Almeida et al. 2006) for comparison with the rest of the galaxies.
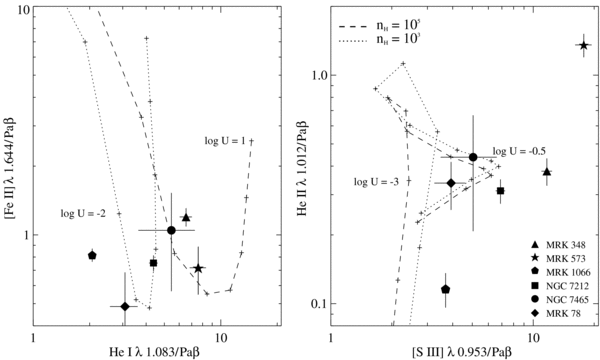
Figure 10. Diagnostic diagrams computed with Cloudy. Models are calculated using the Table agn continuum, two diferent values of the hydrogen density (dotted and dashed lines) and a sequence of ionization parameters. The marks along the log U sequence are separated by a step of 0.5. Measurements from our spectra are overplotted with different symbols for each galaxy.
Download figure:
Standard image High-resolution imageThe diagnostic diagram involving the [Fe ii] and He i lines predicts values of the ionization parameter larger than log U ∼−2 for all the galaxies considered, while the one including He ii and [S iii] is less restrictive. Actually, the computed models do not predict a simple behavior for the considered line ratios, making difficult to determine any sound value of the ionization parameter capable of explaining simultaneously our measurements for most of the galaxies. More sophisticated modeling is needed in order to correctly reproduce the observations, including e.g., combination of optically thin and thick clouds, similarly as done in the visible range (Binette et al. 1996) or ionization by fast shocks (Dopita & Sutherland 1996).
4.7. The Origin of the H2 Emission
Several molecular hydrogen-emission lines are present in the K-band spectra of our Seyfert galaxies. The H2 1–0S(1) 2.12 μm is the strongest molecular transition in our spectra, followed by H2 1–0S(2) 2.03 μm. The H2 1–0S(3) 1.96 μm line is detected in all the galaxies, although in the case of NGC 7212 is strongly blended with the [Si vi] coronal line. Both H2 1–0S(0) 2.22 μm and H2 2–1S(1) 2.25 μm are marginally detected in practically all the sources, except in Mrk 1066 (see bottom panel of Figure 3), the galaxy with the strongest stellar emission.
Basically, there are two H2 excitation mechanisms: "thermal" and "nonthermal" processes or radiative decay from excited levels. In the thermal case, the molecules are heated by shocks, UV photons or X-rays, whereas in the nonthermal case the molecules are excited after absorption of an UV photon or through collision with a fast electron from an X-ray ionized plasma. These two mechanisms produce different spectral features, and the relative emission-line intensities can be used to identify the dominant mechanism. In particular, the H2 1–0S(1)/2–1S(1) line ratio is higher for thermal excitation (5–10) than for UV fluorescence (∼1.82), as proposed by Mouri (1994). Nevertheless, in the case of a dense gas (Ne ⩾ 104 cm−3), collisional de-excitation of the H2 molecule modifies the spectrum, approaching the thermal one. The values obtained for the nuclear region of our galaxies tend to be closer to the case of thermal excitation (see Figure 11). Excitation by hard X-rays is ruled out by other authors based on considerations of energetics (Rodríguez-Ardila et al. 2004) and on the detection of the H2 1–0S(3) transition in several Seyfert galaxies (Davies et al. 2005), which would otherwise be suppressed in an X-ray-irradiated gas.
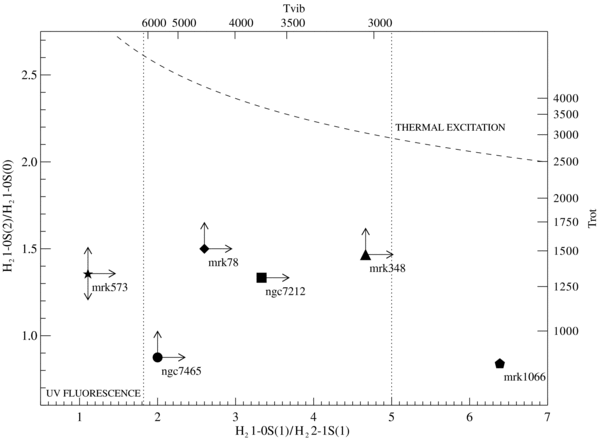
Figure 11. H2 1–0S(2)/1–0S(0) vs. H2 1–0S(1)/2–1S(1) line ratios of the five galaxies in our sample, together with nuclear Mrk 78 values (Ramos Almeida et al. 2006). The dashed line indicates the locus of equal Tvib and Trot. In the case of Mrk 573, Trot is unconstrained, because both H2 1–0S(2) and H2 1–0S(0) lines are upper limits. Vertical dotted lines represent the regions of "thermal" and "nonthermal" excitation from (Mouri 1994).
Download figure:
Standard image High-resolution image
Another way to discriminate between the thermal and fluorescent excitations is through the rotational and vibrational temperatures. We have determined both temperatures using the expressions given by Reunanen et al. (2002), using the H2 1–0S(1)/2–1S(1) and H2 1–0S(2)/1–0S(0) line ratios (see Figure 11). In the case of thermal excitation, both temperatures should be similar, whereas in the case of fluorescent excitation a high vibrational temperature must be in contrast with a lower rotational temperature. According to this criterion, the excitation of the H2 molecule in the nucleus of our galaxies would be due to UV fluorescence, although the line ratios H2 1–0S(1)/2–1S(1) are in most cases lower limits. The values of Tvib for most of our galaxies are larger than those found by Reunanen et al. (2002) for a sample of Seyfert galaxies (between 1800 K and 2700 K) and among the highest values found by Rodríguez-Ardila et al. (2004) for a similar group of AGNs.
The faintness of the lines involved in these diagnostics introduces uncertainties that do not allow a more precise determination of the excitation mechanism. We tentatively conclude that thermal excitation is the most likely excitation mechanism in our galaxies, although UV fluorescence surely plays its role.
5. CONCLUSIONS
We presented and analyzed nuclear near-IR spectra covering the range from 0.8 to 2.4 μm for five Seyfert galaxies, taken with the LIRIS/WHT facility. The main results are summarized as follows.
- 1.The continua of the five galaxies considered in this work have been modeled with a combination of stellar templates plus a BB component associated with hot dust emission (T = 1000 K). This confirms that for the objects analyzed here the UV/optical power-law contribution to the nuclear continuum in the near-IR range is negligible, in contrast to what happens in Type-1 AGN.
- 2.The H and K ranges of the spectra are plagued of absorption features, that in some cases are highly diluted by nonstellar emission. The stellar population of the five galaxies is dominated by late-type giants, with the average age of the stellar systems being constrained between 100 Myr and 1 Gyr.
- 3.Different values of the optical extinction (AV) among the galaxies have been derived from emission-line ratios. Mrk 348 presents the most extinguished NLR (AV ∼ 6 mag), whereas Mrk 573 and NGC 7465 have the lowest amount of extinction. It is noticeable that the two galaxies with detection of broad components in their emission line profiles present the less extinguished NLRs.
- 4.High-ionization coronal lines with ionization potentials larger than 100 eV as [Si vi]λ1.963, [Si x]λ1.430, and [S xi]λ1.920 μm are detected in Mrk 348, Mrk 573, and NGC 7212. In contrast, for NGC 7465 and Mrk 1066, these transitions are extremely faint or undetectable, indicating their low-luminosity AGN nature.
- 5.Diagnostic diagrams involving iron and phosphorus forbidden transitions from the spectra of the galaxies considered allow us to study the excitation mechanisms of the gas, indicating that not only photoionization, but also radio–jet interaction is taking place in the nuclear region of the galaxies.
- 6.Several molecular transitions are detected in the K range of the spectra. The dominant excitation mechanism seems to be thermal excitation, although UV-fluorescence may be also present in some cases.
- 7.The detection of broad wings in the Paα profile of Mrk 573 (FWHM ∼1200 km s−1) confirms the classification of this galaxy as an obscured NLSy1 galaxy, first claimed by Ramos Almeida et al. (2008).
- 8.The near-IR spectrum of NGC 7465 confirms its LINER nature, lacking completely of high-ionization lines, and presenting strong H2 emission. The detection of broad wings in the profiles of Paβ and Brγ (FWHM>2000 km s−1) and of Fe ii and O i permitted lines allows us to reclassify this galaxy as a Type-1 LINER.
This work was partially funded by PN AYA2007-67965-C03-01, PN AYA2004-03136, and PN AYA2005-04149. The William Herschel Telescope and its service programme are operated on the island of La Palma by the Isaac Newton Group in the Spanish Observatorio del Roque de los Muchachos of the Instituto de Astrofísica de Canarias.
The authors acknowledge the data analysis facilities provided by the Starlink Project, which is run by CCLRC on behalf of PPARC. The authors acknowledge Elena Puga Antolín and María Rosa Zapatero Osorio for their valuable help during observations. Finally, we appreciate the very useful comments of the anonymous referee.
APPENDIX: INDIVIDUAL OBJECTS
A.1. Mrk 348 (NGC 262)
The nucleus of Mrk 348 is optically classified as a Type-2 Seyfert. HST observations of this galaxy (Capetti et al. 1996; Falcke et al. 1998) show that the [O iii] line emission is confined to a linear structure of 045 in size, oriented at a P.A. of 155°. The good agreement between the radio and optical structures (Capetti et al. 1996) supports the hypothesis of a nuclear engine located near the optical nucleus and coinciding then with the apex of an ionization cone.
From the X-ray point of view, Mrk 348 shows an absorbed hard X-ray spectra with Γ = 1.61 ± 0.02, and the EW of its Kα iron line similar to those of Seyfert 1 galaxies (Awaki et al. 2006), plus a reflection component at higher energies (Smith et al. 2001). This feature classifies the galaxy as a Compton-thin Seyfert 2. X-ray variability in the continuum flux was found by Smith et al. (2001), while the iron Kα line and the reflection component did not vary. This suggests a scenario where the central X-ray source would be surrounded by a clumpy distribution of absorbing material.
From our near-IR spectrum, this galaxy appears as an archetypal Seyfert 2, showing prominent low- and high-ionization emission lines, together with a continuum flattening or even rising in the H and K bands (see Figure 7). The shape of its near-IR continuum constitutes one of the most peculiar cases in our sample. It can be fairly reproduced by the combination of a stellar template of type K3 III plus a BB component (T ≃ 1000 K), which dilutes the stellar contribution by 40% and 77% at the H and K bands, respectively. In detail, there are few mismatches between the observed spectrum and the fitted model with respect to the stellar absorption features: the CO 2.29 μm band appears very diluted, whereas it is well marked in the model. The same happens with the CN feature at 1.1 μm. The stellar template has to be reddened using a color excess E(B − V) = 0.12. According to the EW ratio of CO 1.62 μm to Si i 1.59 μm (see Table 4) the dominant stellar population in the H band of Mrk 348 corresponds to spectral types between K3 III and M3 III, which is consistent with the best-fitting stellar template. On the other hand, González Delgado et al. (2001) found that the stellar population present in Mrk 348 is composed of old stars, with the absorption bands significatively diluted by the nonstellar continuum. They conclude that the stellar population of the nuclei of this galaxy is similar to that of an elliptical galaxy, but also with larger contribution of intermediate age stars.
The emission-line spectrum presents few coronal or high-ionization lines. The extinction derived from the ratio of [Fe ii] lines is the largest in the sample. Assuming that the coronal lines are produced in the inner part of the NLR, the high extinction implies that either there is a screen in front of the NLR or it is already immersed in dust. This dust distribution could be in turn related to the excess observed in the K-band continuum due to thermal BB emission.
A broad Hα component of FWHM ∼8400 km s−1 has been detected using optical spectropolarimetry (Miller & Goodrich 1990; Tran 1995b). However, we do not detect any broad emission wings in any of the recombination lines.
We have compared some line ratios with the predictions of photoionization models, that are represented in Figure 10. The [S iii]/Paβ ratio is subestimated by the models, in comparison with the observed value for Mrk 348. The value of the ionization parameter seems to be log U ∼ 0 by looking at the diagnostic diagram involving the [S iii] and He ii lines, but it is difficult to confirm it based on the [Fe ii]/Paβ versus He i/Paβ diagram.
According to the H2 line ratios displayed in Figure 11 for Mrk 348, the galaxy is located closer to the thermal excitation region. However, due to the uncertainties in the Trot and Tvib calculations, that are lower and upper limits, respectively, UV fluorescence cannot be discarded.
Summarizing, the continuum of this Seyfert 2 galaxy is well reproduced by a stellar spectrum of type K3 III plus a BB of T∼1000 K, showing a notable excess in the K band. The stellar absorption features present in the H and K bands are strongly diluted in comparison with the rest of the sample. According to the emission lines, Mrk 348 is the archetypal Seyfert 2, presenting prominent low- and high-ionization transitions. The nucleus of this source is the most extinguished of the sample with an AV ∼ 6 mag.
A.2. Mrk 573
This galaxy is known to have an extended emission-line region (Unger et al. 1987; Haniff et al. 1988; Tsvetanov & Walsh 1992). [O iii] images from the HST reveal two ionization cones (Pogge & De Robertis 1995; Capetti et al. 1996; Falcke et al. 1998). The radio-extended emission axis is aligned with the major axis of the NLR and misaligned with the host galaxy major axis. The high intensity of the [Fe ii] lines is also indicative of the influence of the radio emission in the gas excitation. In the X-ray regime, this galaxy is a Compton-thick object that presents a soft X-ray excess and a steep photon spectral index (Guainazzi et al. 2005), together with X-ray variability of a factor ∼2 within 300 s (Ramos Almeida et al. 2008).
The nuclear near-IR spectrum of Mrk 573 presents very strong emission lines together with prominent absorption features in the H and K bands. The shape of its continuum appears very steep and it can be well reproduced by a nonreddened stellar spectrum of type K3V (see Figure 7) plus a BB contribution which dilutes the stellar spectrum by 15% and 45% at H and K bands, respectively. The depth of some stellar features (the CN 1.1 μm and the CO 2.29 μm bands) cannot be reproduced only by the dwarf+BB template, requiring the contribution of a giant or supergiant population. Indeed, from the high CO 1.62 μm to Si i 1.59 μm ratio (see Table 4) the derived population corresponds to late-type supergiants K4 I and M1 I. González Delgado et al. (2001) found old stars in the nuclear region of Mrk 573, based on the EWs of the Ca iiλλ0.393,0.430 μm bands. As in the case of Mrk 348, they claimed for a stellar population typical of an elliptical galaxy, with contribution of intermediate age stars. Rainmann et al. (2003) determined that old population (∼10 Gyr) is dominating the central parsecs of Mrk 573.
Mrk 573 has been classified by many authors as a Seyfert 2 galaxy, based on optical (Tsvetanov & Walsh 1992; Erkens et al. 1997; Mullaney & Ward 2008) and IR spectroscopy (Veilleux et al. 1997; Riffel et al. 2006). However, based on recent near-IR spectroscopy in the ZJ range of Mrk 573, together with the detection of X-ray variability in the X-rays, Ramos Almeida et al. (2008) have recently reclassified this object as an obscured NLSy1. The ZJ range of the spectrum (also reported here in Figure 2) shows permitted O i and Fe ii lines well above the noise level. In addition, broad wings are detected in the Paβ profile. All these features can only be produced in a high-density optically thick gas, more internal than the NLR, and consequently, they are exclusive of Type-1 AGN and never seen in canonical Seyfert 2 galaxies. In this work, we present also the HK spectral range of Mrk 573 that confirms the previously mentioned classification. Strong [Si x]λ1.430 and [Si vi]λ1.963 emission, together with the [S viii]λ0.991, [S ix]λ1.252, and [S xi]λ1.920 lines reveal a high-ionization region, likely located closer to the nucleus than the classical NLR. The Paα profile shows also a broad pedestal of FWHM ∼1200 km s−1. This component is narrower than the Paβ broad component (FWHM ∼1700 km s−1), although both measurements are consistent within the errors (see Table 3). Spectropolarimetric observations (Nagao et al. 2004) reveal prominent scattered broad Hα emission, together with the optical Fe ii multiplet. The measured [Fe ii]1.257/1.644 μm line ratio for Mrk 573 indicates a negligible extinction toward the NLR, likely allowing us to see more internal regions.
The comparison of the observed line ratios with the predictions from photoionization models does not show a good matching with any of the inspected models by looking at the He ii/Paβ versus [S iii]/Paβ diagram. It appears that either a harder ionizing continuum is needed or the line flux of the narrow component of Paβ is underestimated. In contrast, the He i/Paβ and [Fe ii]/Paβ ratios are nicely reproduced by the models, using a hydrogen density of nH = 105 cm−3 and a log U∈ [−1.5, − 1].
With respect to the molecular content, the H2 emission is very weak in Mrk 573, and the most likely excitation mechanism is UV fluorescence according to the H2 1–0S(1)/2–1S(1) ratio (see Figure 11).
In conclusion, the steep continuum of this obscured NLSy1 galaxy can be reproduced with a stellar spectrum of type K3 V with the extinction of the stellar spectrum being negligible. The dilution in the H and K bands is intermediate, compared with the rest of the sample, and the emission lines are the most prominent. Strong coronal lines are detected in the spectrum, revealing a high-ionization region, likely closer to the nucleus than the NLR. Simple photoionization models are unable to reproduce accurately the line ratios. From the intensity of [Fe ii] lines, it seems very likely that the interaction with radio emission plays a role.
A.3. Mrk 1066
Bower et al. (1995) reported low-excitation emission-line ratios similar to those of LINERs for this Seyfert 2 galaxy, from ground-based spectroscopy. Spectropolarimetric observations of Mrk 1066 have not revealed broad components in the permitted lines (Miller & Goodrich 1990). The results of the observations are consistent with the polarization being almost completely due to foreground sources. Ulvestad & Wilson (1989) mapped the linear nuclear radio source finding a jetlike morphology elongated with a P.A. = 134°, close to the [O iii] axis. The P.A. of the optical ionization cones is 135°. HST Wide Field Planetary Camera 2 (WFPC2) and Very Large Array (VLA) radio imaging were employed by Bower et al. (1995) to analyze the distributions of the emission-line gas and radio continuum that are consistent with a bipolar jet, significantly inclined with respect to the galaxy disk. From an X-ray perspective, this galaxy has been classified by Shu et al. (2007) as a Compton-thick object on the basis of its large Fe Kα EW (> 1 keV). The power-law photon index reported by these authors is 2.75±0.170.07. On the other hand, it is a very luminous object in the far-IR, showing a double nucleus (Gimeno et al. 2004).
From our near-IR spectrum, Mrk 1066 seems to be a Seyfert 2 with relatively weak AGN signatures. The high-ionization lines are faint in comparison with the recombination lines. The strength of the Brγ and H2 transitions is indicative of vigorous star formation activity. As an example, we note that the H21–0S(3) line is ∼4 times more intense than the [Si vi]λ1.963 feature. Its nuclear continuum is the steepest in our sample, showing the deepest stellar features. According to its CO 1.62 μm to Si i 1.59 μm ratio (see Table 4), the stellar population responsible for the absorption bands is dominated by K3 III stars. The dilution fraction derived from the absorption features is negligible in the H band. González Delgado et al. (2001) found that the stellar population in Mrk 1066 is compatible with young and intermediate age stellar systems. Rainmann et al. (2003) claim for a 1 Gyr stellar population dominating the nuclear region of this galaxy. On the other hand, the shape of the continuum of Mrk 1066 can be well reproduced by a stellar template of type M1 III. The depth of the CO 2.29 μm feature in the M1 III template is not as deep as observed, indicating the presence of supergiant stars or possible starburst activity. The CN 1 μm feature appears very strong, and it is reproduced very approximately by the stellar template. From the best-fitting model (stellar template plus BB) the required extinction of the stellar spectrum is E(B − V) = 0.12 (compatible with Galactic extinction), and the dilution fractions are 14% and 48% in the H and K bands, respectively.
The extinction derived from the [Fe ii]1.257/1.644 μm line ratio (see Figure 8) is among the highest (AV = 4 mag) in our sample. The observed line ratios shown in Figure 10 are not perfectly reproduced with the photoionization models obtained with Cloudy for the case of Mrk 1066.
Mrk 1066 is the object in our small sample of galaxies with more intense H2 emission. As can be seen from Figure 11, the H2 1–0S(1)/2–1S(1) line ratio locates the galaxy in the thermal excitation region. Nevertheless, the difference between its rotational temperature (Trot = 850 ± 170 K) and the vibrational temperature (Tvib = 2600 ± 400 K) seems to indicate that thermal excitation is not the only exciting mechanism.
Summarizing, the shape of the continuum (the steepest of the sample) is reproduced by a stellar spectrum of type M1 III. Nevertheless, the CO 2.23 μm feature is deeper than the observed for this type of stars, indicating the presence of supergiant stars in the nuclear region of the galaxy, where likely starburst activity is taken place. A moderate amount of dilution is affecting the H and K absorption features. High-ionization lines are very weak in comparison with the recombination lines. The results obtained from the comparison with photoionization models indicate low values of the ionization parameter. Both facts point toward a weak-luminosity AGN. The NLR of Mrk 1066 presents a considerable amount of extinction. The observed H2 emission is the most intense of the sample, and the more likely excitation mechanism is thermal excitation.
A.4. NGC 7212
NGC 7212 is part of a triple interacting system (Wasilewski 1981). HST [O iii] images reveal that the emission is extended along a P.A. = 170°, and it is composed of several individual blobs toward the north and south of the nucleus (Schmitt et al. 2003). This [O iii] emission is aligned with the radio emission of the galaxy. Several dust lanes are revealed in the continuum images (Falcke et al. 1998), together with the elongated and diffuse NLR structure, with a strong central peak near the continuum maximum. The VLA maps show a double compact radio source orientated in the north–south (NS) direction. Spectropolarimetric observations reveal a broad Hα component of FWHM ∼4000 km s−1 (Tran et al. 1992; Tran 1995a). At the X-ray range, its spectrum (Chandra/ACIS) has been fit by a pure Compton-reflection component and a strong Kα iron line, suggesting that the source is Compton-thick (Bianchi et al. 2006).
From our near-IR data, NGC 7212 presents the typical spectrum of a Seyfert 2 galaxy, similar to that of Mrk 348, but without the K band excess. Its continuum is very flat (see Figure 7), and several narrow emission lines are present in the spectrum, including all the high-ionization species seen in Mrk 573. The [S ix]λ1.252 line is strongly blended with the [Fe ii]λ1.257 feature in NGC 7212. The best fit of the continuum was found with a stellar template of type M1V plus a relatively small BB contribution in the K band. The required extinction of the stellar template is negligible, and the dilution fractions are 0% and 20% at H and K bands, respectively. Nevertheless, the depth of the CN 1 μm feature is better reproduced by a M1 III template. González Delgado et al. (2001); Rainmann et al. (2003) found the same old stellar population as in Mrk 348 and Mrk 573, described above.
The amount of extinction derived from the [Fe ii]1.257/1.644 μm line ratio is about AV ∼ 2. The line ratios considered in Figure 10 for their comparison with photoionization models are nicely reproduced for the case of NGC 7212, using an ionization parameter log U ∼ 0. Thus, photoionization seems to be confirmed as the dominant mechanism in the nucleus of this galaxy.
The vibrational and rotational temperatures determined for the case of NGC 7212 are considerably different, with Tvib ≫ Trot, which is typical of UV fluorescence. Nevertheless, its H21–0S(1)/2–1S(1) ratio is in the intermediate region between the thermal excitation and UV pumping values, making difficult to determine which H2 excitation mechanism is dominating in this galaxy.
In summary, the flat continuum of NGC 7212 is reproduced by a stellar spectrum of type M1 V, although the depth of the CN 1.1 μm feature is better fitted using a M1 III template. The extinction of the stellar spectrum is negligible, and the dilution factor in the H and K bands is the lowest in the sample. The emission-line spectrum corresponds to a typical Seyfert 2 galaxy, very similar to that of Mrk 348, but without the red excess. Several narrow emission lines populate the spectrum, including high-ionization species. The comparison with photoionization models indicates that the considered line ratios can be reproduced by this type of ionization mechanism.
A.5. NGC 7465 (Mrk 313)
Osterbrock & Pogge (1987) and van Driel et al. (1992) claimed for the low-ionization AGN nature of the nucleus of NGC 7465, based on optical spectroscopy. Its spectrum fulfils the criterium of having [O II]λ3727 Å at least as strong as [O iii]λ5007 Å (Heckman 1980),6 but the ratio [O i]λ6300/[O iii]λ5007 = 0.1 (Osterbrock & Pogge 1987) appears too small for a classical LINER. Nevertheless, Filippenko & Terlevich (1992) defined the weak-[O i] LINERs as those having [O i]λ6300/Hα < 0.17. The reported value of this ratio for Mrk 7465 by Osterbrock & Pogge (1987) is 0.1, which classifies it in this LINER subclass. The hard X-ray absorption-corrected luminosity of NGC 7465 is 1042 erg s−1, according to Guainazzi et al. (2005), that is within the typical LINER intrinsic luminosities in the 2–10 keV band (1040–1042 erg s−1; Terashima et al. 2000).
Our near-IR spectrum confirms the LINER nature of this galaxy, that lacks completely of the high-ionization lines [S ix]λ1.252, [Si x]λ1.430, and [S xi]λ1.920. [S viii]λ0.991 and [Si vi]λ1.963, which are usually very prominent in Seyfert galaxies, are only marginally detected in NGC 7465.
The dominant stellar population in the nuclear region of NGC 7465 corresponds to types between K3 III and M3 III, according to relative absorption bands measurements (see Table 4). The spectral shape in the near-IR range is relatively steep, similar to that of Mrk 573 (see Figure 7), and it can be well reproduced by a stellar template of type K3 III. The depth of the CN 1 μm and CO 2.29 μm features are well matched between the template and the observations. The dilution fractions due to the BB component are 6% and 32% at H and K bands, respectively.
Apart from confirming NGC 7465 as a low-ionization AGN, our near-IR emission-line spectrum reveals for first time the Type-1 AGN nature of this galaxy, based on the detection of broad components of Paβ and Brγ (with FWHM > 2000 km s−1), together with Fe ii and O i permitted lines (see Figure 5). The broad component of Paα cannot be properly measured because of its coincidence with a strong telluric absorption band. The width of the lines in the optical has been measured with different results: Osterbrock & Pogge (1987) found very narrow Hα and Hβ profiles (∼250 km s−1), while Maehara & Noguchi (1988) reported on emission lines as broad as 600 km s−1. The detection of broad wings in the recombination lines of LINERs (reported for first time by Heckman 1980), indicates that the photoionizing source is an AGN, and not a strong stellar emission, as it seems to happen in a different type of LINERs (Alonso-Herrero et al. 2000). Moreover, the presence of O i and Fe ii lines7 suggests that strong UV emission is present, as well as high-density clouds similar to those of the BLR.
The nuclear region of NGC 7465 is little extincted (AV = 1.1 mag) according to its [Fe ii]1.257/1.644 μm line ratio (see Figure 8). In addition, the nuclear spectrum of NGC 7465 shows the highest value of [Fe ii]λ1.257/Paβ. Larkin et al. (1998) proposed two different classes of LINERs according to this ratio: weak-[Fe ii] LINERs (those with [Fe ii]λ1.257/Paβ< 2) and strong-[Fe ii] LINERs ([Fe ii]λ1.257/Paβ> 2). The former class would be low-luminosity AGN, whereas the latter would be powered by starburst. According to this classification, NGC 7465 would be a weak-[Fe ii] LINER, consistent with being a low-luminosity AGN as derived from its X-ray luminosity.
The line ratios considered in Figure 10 for the comparison with photoionized models computed with Cloudy are perfectly reproduced using values of the ionization parameter log U∼ −0.5 and a hydrogen density of 103 cm−3. This indicates that photoionization alone permits us to explain the measured values of the considered lines.
In comparison with the rest of our sample, NGC 7465 has the strongest H2 emission (see Table 3), which is also typical of LINERs (Larkin et al. 1998). Its H2 1–0S(1)/2–1S(1) line ratio is near the typical values for UV fluorescence (see Figure 11). Concretely, this case is similar to that of Mrk 504 (Rodríguez-Ardila et al. 2004). The Tvib and Trot differ appreciably, indicating the presence of nonthermal excitation. The low value of Trot can be attributed to UV heating, and this process can be the main source of the H2 excitation. UV heating models (Black & van Dishoeck 1987), where far ultraviolet (FUV) photons emitted by OB stars (photodissociation regions) heat the gas, predict excitation temperatures of 1000 K for the H2 thermal component. Such low values are typically found in starburst galaxies (Mouri 1994). Consequently, the molecular spectrum of NGC 7465 would be produced by UV fluorescence, according to its H2 2–1S(1)/1–0S(1) line ratio and vibrational and rotational temperatures.
Summarizing, the shape of the continuum of this Type-1 LINER is well reproduced by a stellar spectrum of type K3 III, with the depth of the CO 2.23 μm feature correctly matched. A moderate amount of dilution is affecting the absorption bands seen in the H and K bands of the galaxy. Hydrogen recombinations lines are also very prominent in the nucleus of this galaxy, probably due to star formation. The comparison with photoionization models confirms that the photoionizing source is a low-luminosity AGN, and not a strong stellar continuum, as it would happen in other type of LINERs. In addition, the [Fe ii]λ1.257/Paβ ratio classifies the galaxy as a weak-[Fe ii] LINER.
Footnotes
- 1
IRAF is distributed by the National Optical Astronomy Observatory, which is operated by the Association of Universities for the Research in Astronomy, Inc., under cooperative agreement with the National Science Foundation (http://iraf.noao.edu/).
- 2
In this work, we always refer the emission toward the nucleus as the nuclear stellar population, although we cannot discriminate between nuclear-located and foreground stellar emission because of the projection effects along the LOS.
- 3
Available in the electronic form at http://irtfweb.ifa.hawaii.edu/~spex/WebLibrary/.
- 4
The [Si x]λ1.430 line is inmersed in a telluric absorption band due to the redshift of the galaxies considered, making it difficult to detect it except under good atmospheric transmission.
- 5
- 6
Osterbrock & Pogge (1987) reported [O ii]λ3727 / [O iii]λ5007 = 1.4.
- 7
These lines are produced by Lyβ and Lyα pumping in a fluorescence mechanism, respectively.