


ABSTRACT
We report on the detection of EUV wave reflection from a coronal hole, as observed by the Solar Terrestrial Relations Observatory mission. The EUV wave was associated with a coronal mass ejection (CME) erupting near the disk center. It was possible to measure the kinematics of the reflected waves for the first time. The reflected waves were generally slower than the direct wave. One of the important implications of the wave reflection is that the EUV transients are truly a wave phenomenon. The EUV wave reflection has implications for CME propagation, especially during the declining phase of the solar cycle when there are many low-latitude coronal holes.
Export citation and abstract BibTeX RIS
1. INTRODUCTION
Extreme-ultraviolet (EUV) transients were first reported by Neupert (1989). They have been extensively studied since their detection (Thompson et al. 1998) by the Solar and Heliospheric Observatory (SOHO) mission's Extreme-ultraviolet Imaging Telescope (EIT), and have come to be known as EIT waves, interpreted as fast mode magnetosonic waves (Wills-Davey & Thompson 1999). Similar waves have also been observed at other wavelengths, such as X-rays (Narukage et al. 2002; Hudson et al. 2003; Warmuth et al. 2005) and microwaves (White & Thompson 2005; Vršnak et al. 2005). At some stage of their evolution, faster EUV waves also seem to steepen into shocks known as brow waves (Gopalswamy 2000; Gopalswamy et al. 2001) or sharp waves (Biesecker et al. 2002) and are associated with metric type II bursts. EUV waves with metric type II radio bursts are also associated with Hα Moreton waves (Smith & Harvey 1971), which are assumed to be the chromospheric counterparts of the EUV waves (Thompson et al. 1999; Warmuth et al. 2001; Veronig et al. 2006). Some authors think that the EUV transients are not waves at all (Delanee & Aulanier 1999; Attrill et al. 2007). In particular, Delanee & Aulanier (1999) suggest that the EUV transients indicate Joule heating in the regions where the magnetic field lines open during the associated coronal mass ejecion (CME). Attrill et al. (2007) propose that successive flare-like brightenings due to the interaction of CME flux rope with low-lying coronal loops might be seen as the EUV transients. Podladchikova & Berghmans (2005) have demonstrated that some coronal waves rotate in addition to propagating radially, but they could not choose between a wave and a non-wave model based on the rotation. However, if the flux rope has an azimuthal component of the speed (see, e.g., Green et al. 2007), one can expect the wave driven by it to have an azimuthal component as well. Therefore, the rotation need not imply a non-wave interpretation. Wills-Davey et al. (2007) claim EIT waves to be coronal MHD solitons, but they do not show how observationally one can distinguish between solitons and non-soliton waves. Numerical simulations suggest that the EUV transient is a wave surrounding the CME, while a second slower pseudowave is seen near the expanding loops associated with the CME (Chen et al. 2005). Thus the nature of the EUV transients (wave or not) has been controversial for some time.
EUV waves have been observed to interact with coronal structures along their path (Thompson et al. 1998, 1999; Wills-Davey & Thompson 1999; Veronig et al. 2006). Thompson et al. (1998) reported on EUV waves that are stopped by coronal holes. This is confirmed by numerical simulations (Wang 2000; Wu et al. 2001). Stopping of EUV waves by an active region has also been reported by Ofman & Thompson (2002). Moreton waves have also been found to stop at or partially intrude into coronal holes (Veronig et al. 2006). In this Letter, we report the detection of EUV wave reflection from the boundary of a coronal hole and the observation of both direct and retrograde waves as well as the wave bending around the coronal hole. This result has important implications to the controversy regarding the nature of EUV transients. The wave reflection is clear evidence favoring the wave nature, which is an important clue to modeling these waves and the associated CMEs.
2. OBSERVATIONS
Observations reported in this Letter were made by the Solar Terrestrial Relations Observatory (STEREO; Kaiser et al. 2008) mission's Extreme Ultraviolet Imager (EUVI). EUVI belongs to STEREO's Sun Earth Connection Coronal and Heliospheric Investigation (SECCHI; Howard et al. 2008) instrument suite. The EUV transient was observed on 2007 May 19 in association with a fast CME (speed ∼950 km s−1) and a long-duration flare (GOES X-ray class B9.5) from active region NOAA 10956 located close to the disk center (N07W06). The CME involved the eruption of a filament located just at the northwestern edge of the active region. The flare itself occurred near the southern end of the filament. The eruption was fully observed at the four wave bands of EUVI (171, 195, 284, and 304 Å). One of the main problems with the SOHO/EIT was its poor cadence (typically 12 minutes), which prevented tracking EUV waves over large distances. STEREO/EUVI obtains images with a higher cadence (2.5 minutes at 171 Å), which makes it ideal for tracking EUV waves. The spatial resolution of EUVI is also much better than that of EIT (1.6 versus 2.6 arcsec per pixel). Aspects of the EUV transient and the wave interpretation have already been reported (Long et al. 2008; Veronig et al. 2008). The CME had a well-defined solar source (Liu et al. 2008). Here we concentrate on the wave reflection aspect of the event. We use data from both STEREO-A (SA) and STEREO-B (SB), but the separation between the two spacecraft was not large enough to make a significant difference in the wave appearance.
The EUVI 171 Å image in Figure 1 shows five prominent coronal holes (two polar and three equatorial). The western coronal hole (CH) extends roughly from ∼W15 to W45 in longitude and S10-S30 in latitude. The northern portion of the CH was somewhat inhomogeneous (it has finger-like extensions to the north). The nose of the direct wave (red traces in Figure 1) moves to the west and its southern flank approaches the CH and gets reflected. The reflected disturbance moves in the three directions (green traces). The progression of time is to the right for the direct wave traces; the progression is to the left, top, and bottom, respectively for the reflected waves in the eastward (E), northward (N), and southward (S) directions. No disturbance was seen in the southwest direction from the CH.
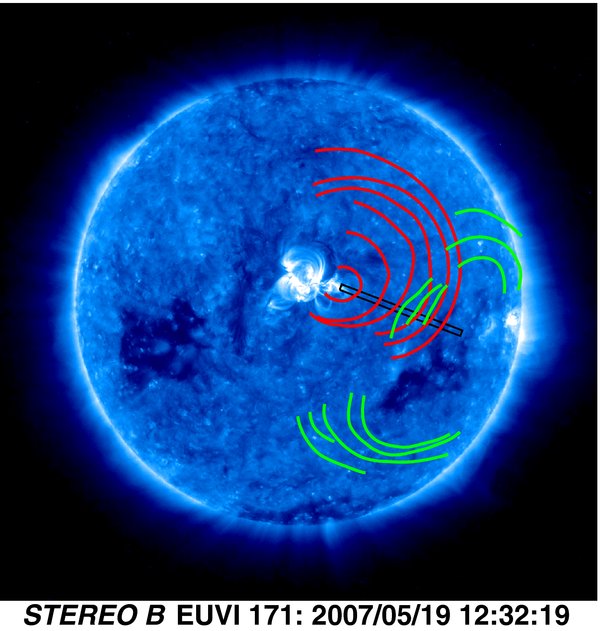
Figure 1. Sketch of the EUV wave at different times superposed on a EUVI 171 Å image. Direct wave (red) and reflected waves (green) are distinguished. The rectangular slit is used to investigate the wave motion (see Figure 2). Three low latitude coronal holes can be seen in the EUV image. The western one is of primary importance for this work. The two eastern coronal holes also played a role in the propagation of the CME. There are also small coronal holes at the poles. Note that there is no wave to the west of the western coronal hole.
Download figure:
Standard image High-resolution imageIn order to see the reflection better, we selected a rectangular slice of EUV difference images extending from N01W08 (near the source active region) to S10W45 (northern part of the CH). The slice has a width of 13 pixels and a length of 4.1 × 10⁵ km (0.59 R☉) lying roughly along a position angle of 255°. Figure 2 shows the stack of these slices taken at different times, giving a distance–time plot. Direct and reflected waves can be seen as bright features with positive and negative slopes, respectively. The dark features are at lower distances for the direct wave and at larger distance for the reflected wave because we have used running difference images, thus correctly pointing to the direction of motion of the waves. The CH appears as the diffuse horizontal feature between 0.46 and 0.51 R☉ in the stack plot. The feature with negative slope starts around 13:00 UT (pointed by arrow) and lasts for at least 20 minutes. From the slope of the features, we estimate speeds of ∼363 km s−1 and ∼188 km s−1, respectively, for the direct and reflected waves. Note that the rectangular strip is not at the fastest section of the wave and covers only the reflected wave to the east.
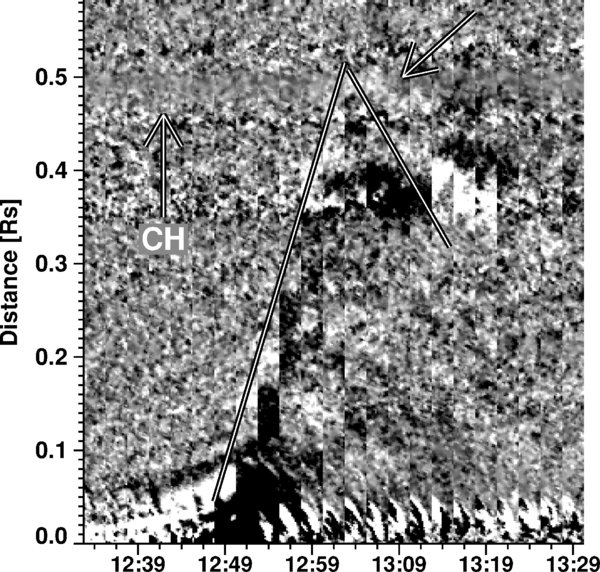
Figure 2. Distance–time plot made by stacking EUV difference images within the rectangular slit (see in Figure 1) at different times. The bottom of the plot corresponds to the slit end near the active region (N01W08). The top end is near the coronal hole (S10W45). The diffuse horizontal feature between 0.46 and 0.51 R☉ is the coronal hole. Note the reflection around 13:00 UT (indicated by the arrow).
Download figure:
Standard image High-resolution image3. WAVE SPEEDS
Figure 3 shows distance–time plots of the EUV wave as observed by SA and SB. The direct wave (marked D) propagates in the westward direction with a speed of about 385 km s−1, as observed by both SA and SB. The reflected waves toward east (E) and south (S) have speeds lower than the direct wave in both SA and SB. However, the reflected wave toward north (N) has a speed higher than that of the direct wave in both SA and SB. It is not clear if the higher speed in the N direction is due to the superposition of direct and retrograde waves. Note also that the nose of the direct wave was in the northwest direction. There is also indication that a second filament departed with ∼5 minutes delay from the northern part of the active region (Veronig et al. 2008). Figure 3 also shows that a metric type II radio burst was observed at 12:52 UT. The EUV wave had already started before the type II onset, at which time the EUV wave must have become a fast mode shock accelerating electrons that produce the type II radio burst. The type II burst started well before the wave reflection and continued until 13:18 UT, which is only slightly after the reflection.
Figure 3. Distance–time plots of the direct wave (D) moving westward and the reflected waves in the eastward (E), southward (S), and northward (N) directions. The straight lines are least-squares fits to the distance–time measurements. D and E are measured close to the rectangular slit shown in Figure 1. N and S are measured roughly along the nose of the reflected waves. The vertical dashed line marks the onset of the type II radio burst at metric wavelengths (from the Solar Geophysical Data).
Download figure:
Standard image High-resolution imageThe speeds shown in Figure 3 are at the position angle of the rectangular slit (see Figure 1). However, the wave speed changes considerably along different position angles, as can be seen in Figure 4. The speeds were measured at different position angles along the four sets of wave traces shown in Figure 1 and then plotted as a function of position angle. The direct wave has maximum speed in the northwest direction (position angle ∼40°: 450 km s−1 (SA) and 490 km s−1 (SB). It is not clear if the slightly higher speed in SB (∼40 km s−1) in the northernmost section of the direct wave is real or not. The difference is more significant in the east and south directions. In these cases, SB observations indicate 100–300 km s−1 higher speed (see Figure 4). This is most likely due to the different sections of the Sun observed by SA and SB. Since SB observes the wave over a shorter distance than SA (the wave propagates toward the W-limb of SB), the decay phase of the wave is seen only in SA (Veronig et al. 2008), leading to a higher speed observed by SB. It is worth noting that the position angle plot in Figure 4 is consistent with other measurements of the direct wave. Long et al. (2008) measured the speed of the direct wave at a position angle of 270° and found an average speed of ∼430 km s−1, consistent with our measurements shown in Figure 4. Veronig et al. (2008) computed an average distance across position angles to the speed, which is within the range of speeds shown in Figure 4.
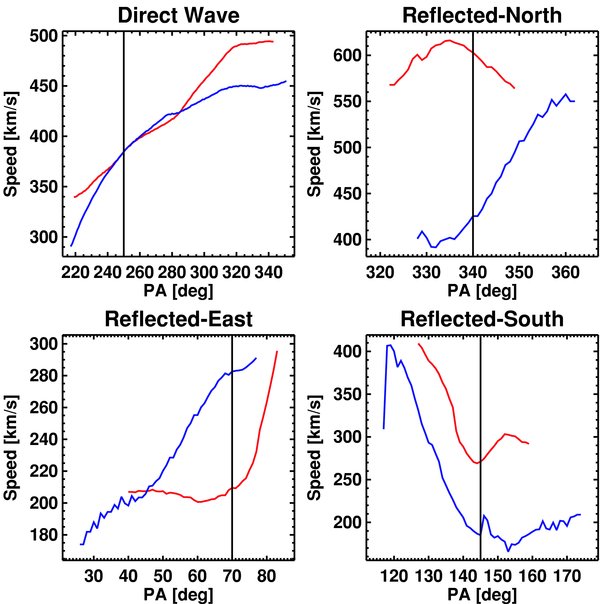
Figure 4. Variation of the wave speed as a function of the position angle for the direct wave and the reflected wave in the eastward, northward, and southward directions. SA and SB observations are shown in each case. The vertical solid lines mark the position angle at which the height–time plots in Figure 3 were made.
Download figure:
Standard image High-resolution image4. OTHER CORONAL HOLES
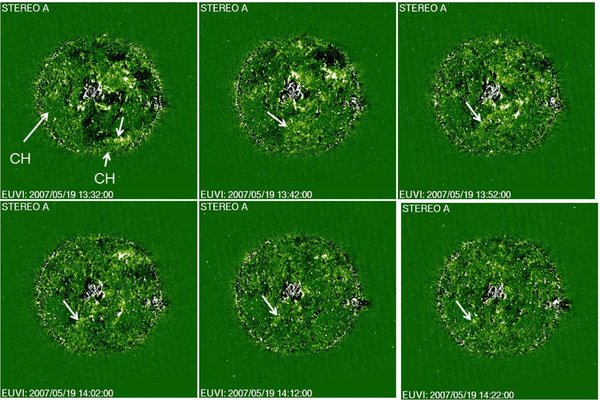
In Figure 1 one can see three significant coronal holes at low latitudes, two to the east of AR 10956 (the source region of eruption) and one to the west that reflected the EUV wave. One can also see polar coronal holes, the one at the south pole being larger. Of these, the south polar coronal hole shows definite reflection of the wave propagating to the south. Figure 5 shows a series of running difference images taken at EUVI 195 Å. Traditionally, the EUV transient has been extensively observed at this wavelength. In spite of the lower cadence, one can see the reflection of the wave at this wavelength. However, the wave reflection from the western coronal hole was not observed at this wavelength. The wave has slowed down considerably by the time it reached the southern coronal hole, so the reflection was observed even with poorer cadence. The wave reflected from the southern coronal hole seems to be finally stopped by the dark coronal hole to the east of AR 10956. The reflection from the southern coronal hole confirms that this phenomenon is quite common. The eastward wave from the western coronal hole and the northward wave from the south-polar coronal hole cannot be due to the interaction of the CME flux rope with low-lying coronal loops.
Figure 5. Reflection of the secondary EUV wave from the south polar corona hole as illustrated by the running difference images taken by EUVI (STEREO A) at 195 Å. The wave front is marked by arrows. The coronal holes at the south pole and to the east of the source region are marked by CH.
Download figure:
Standard image High-resolution image
5. DISCUSSION AND CONCLUSION
The primary finding of this Letter is the measurable reflection of EUV wave from a coronal hole, which was located at a distance ∼30° in longitude, yet produced a measurable effect on the wave surrounding the CME. Examination of the coronal dimming in the vicinity of the active region shows that most of the motion was to the west of the active region, which may be a confining effect that the eastern coronal holes had on the eruption (Gopalswamy et al. 2004). The flux rope associated with the CME was observed as a high-inclination cloud at 1 AU (Liu et al. 2008). This means the east–west extension of the flux rope may not be very large near the Sun and may not have reached the coronal hole. Therefore, what was reflected from the western coronal hole must be the wave driven by the CME flux rope. The white light CME observed by SOHO was extremely faint (see http://cdaw.gsfc.nasa.gov/CME_list), with no bright part within. This means what was observed above the west limb of the Sun is likely to be the western flank of the wave around the flux rope. Observations presented in this Letter thus provide the first clear evidence that the EUV disturbances are waves rather than brightening resulting from non-wave processes suggested in the literature (Delanee and Aulanier 1999; Attrill et al. 2007). The secondary reflection from the south-polar coronal hole further confirms the wave nature of the EUV disturbances. Finally, the metric type II burst is also clear evidence of a fast mode shock, which must have formed due to the steepening of the magnetosonic wave.
S.Y. acknowledges support by NASA (NNX08AD60A). M.T. acknowledges support by the project APART 11262 of the Austrian Academy of Sciences. R.T.J.Mc.A. is a Marie Curie Intra-European Fellow. The SECCHI instrument was constructed by a consortium of international institutions: the Naval Research Laboratory (USA), the Lockheed Martin Solar and Astrophysical Laboratory (USA), the NASA Goddard Space Flight Center (USA), the Max-Planck-Institüt für Sonnensystemforschung (Germany), the Centre Spatial de Liege (Belgium), the University of Birmingham (UK), the Rutherford Appleton Laboratory (UK), the Institut d'Optique (France), and the Institute d' Astrophysique Spatiale (France).