


ABSTRACT
A 100 m2 muon detector (MD) was successfully constructed under the existing Tibet air shower (AS) array in the late fall of 2007. The sensitivity of the Tibet AS array to cosmic gamma rays can be improved by selecting muon-poor events with the MD. Our MC simulation of the MD response reasonably agrees with the experimental data in terms of the charge distribution for one-muon events and the background rejection power. Using the data collected by the Tibet AS array and the 100 m2 MD taken from 2008 March to 2010 February, we search for continuous gamma-ray emission from the Crab Nebula above ∼100 TeV. No significant excess is found, and the most stringent upper limit is obtained above 140 TeV.
Export citation and abstract BibTeX RIS
1. INTRODUCTION
Very high-energy (VHE) astrophysical objects in our Galaxy are supposed to accelerate cosmic rays up to the knee (∼4 PeV) energy region. One naturally expects that gamma rays are produced in the 10−1000 TeV region by π0 decay due to the interactions of accelerated charged cosmic rays with matter surrounding the VHE sources. Meanwhile, VHE gamma rays may also arise through leptonic processes, such as the inverse-Compton (IC) scattering and the bremsstrahlung of accelerated electrons. An approach to positively identify the sources accelerating cosmic rays up to the knee is to search for gamma-ray sources with energy spectra extending up to 100 TeV and higher because gamma rays of leptonic origin decrease sharply in flux at such high energies due to synchrotron cooling and the rapid suppression of the IC cross section (Klein–Nishina effect). From the experimental point of view, however, there has been no convincing evidence for those π0-decay gamma rays so far. An experiment with an unprecedentedly high sensitivity aimed at the observation of gamma-ray spectra in the 10−1000 TeV energy region is very interesting at the moment.
The Crab Nebula is commonly used as a standard calibration candle for TeV gamma-ray detectors today. TeV gamma rays from the Crab Nebula were first detected by the Whipple collaboration in 1989 (Weekes et al. 1989). Since then the energy spectrum of the Crab Nebula has been measured by a number of imaging air Cherenkov telescopes as well as air shower (AS) arrays; the Tibet ASγ collaboration was the first AS array which successfully observed the Crab Nebula at multi-TeV energies (Amenomori et al. 1999). None of the experiments has detected gamma rays above 100 TeV from the Crab Nebula, and the best upper limits have been given by the CASA-MIA experiment (Borione et al. 1997). The observations of the synchrotron radiation extending beyond 100 MeV (Kuiper et al. 2001; Abdo et al. 2010) have led to the common understanding that electrons are accelerated up to PeV energies in the Nebula. If the IC gamma-ray flux above 100 TeV caused by those PeV electrons is measured, the comparison of the synchrotron/IC fluxes will provide precious information on the magnetic field of the Nebula. On the other hand, there still remains a possibility for gamma-ray emission originating from PeV cosmic rays to come into play above 100 TeV. If we detected those gamma rays of hadronic origin above 100 TeV, we might be able to identify the Crab Nebula as a source accelerating cosmic rays up to the knee. For these reasons, we search for gamma rays above ∼100 TeV from the Crab Nebula, using the Tibet AS array combined with a 100 m2 muon detector (MD) described below.
2. TIBET AS EXPERIMENT
The Tibet ASγ experiment started in 1990 at Yangbajing in Tibet (90 522E, 30102N) at an altitude of 4300 m above sea level, which corresponds to an atmospheric depth of
  (Amenomori et al. 1992). After several upgrades, the Tibet AS array now consists of 761 fast-timing (FT) scintillation counters and 28 density (D) counters, covering an effective area of 36,900 m2. All of the FT counters are equipped with an FT 2-inch-in-diameter photomultiplier tube (PMT), whereas 249 FT counters and all of the D counters are equipped with a wide dynamic range 1.5-inch-in-diameter PMT. The energy of primary cosmic rays and gamma rays is estimated by
  the sum of the number of detected secondary particles/m2 for each FT counter. The performance of the Tibet AS array has been well examined by the observation of the Moon's shadow (Amenomori et al. 2003, 2009). The energy resolution and the angular resolution for primary gamma rays is 40% and 02 around 100 TeV, respectively. The displacement of the shadow's center from the Moon's apparent position in the north–south direction demonstrates that the pointing error of the array is smaller than ∼001. The uncertainty in the absolute energy scale is estimated to be < ±12% from the displacement of the shadow's center in the east–west direction due to the geomagnetic field.
The Tibet ASγ experiment has produced a lot of results on gamma-ray astronomy as well as on cosmic-ray physics: the steady emission of TeV gamma-rays from the Crab Nebula (Amenomori et al. 1999, 2009), multi-TeV gamma-rays from Mrk 421 (Amenomori et al. 2003) and Mrk 501 (Amenomori et al. 2000), etc. To improve the sensitivity of the AS array to gamma rays in the 10−1000 TeV region, we are planning to add a water-Cherenkov MD array to the AS array. Since gamma-ray-induced ASs are muon-poor and cosmic-ray-induced ones muon-rich, the number of muons in ASs can be a good parameter to distinguish gamma rays from cosmic rays. The currently planned full-scale MD array is made up of 12 pools, set up under a 2.6 m thick layer of soil that is supposed to absorb the electromagnetic components of ASs. Each pool consists of 16 MDs. Each MD is a waterproof concrete cell, 7.15 m wide × 7.15 m long × 1.5 m deep in size, equipped with two downward-facing 20-inch-in-diameter PMTs (HAMAMATSU R3600) to detect Cherenkov photons emitted by AS muons. The total effective area of the MD array amounts approximately to 10,000 m2 for muons with energies greater than ∼1 GeV. Our detailed MC simulation predicts that using the full-scale MD array we will be able to reject background cosmic-ray events by ∼99.99% at 100 TeV, and that the sensitivity of the AS array to gamma-ray sources will improve by more than an order of magnitude in the 10−1000 TeV region (Sako et al. 2009). To confirm the construction feasibility of the MD and the hadron rejection power obtained by our MC simulation, we constructed a 100 m2 MD in 2007.
3. 100 M2 MUON DETECTOR
The 100 m2 MD was constructed 90 m southwest of the center of the existing Tibet AS array in the late fall of 2007, as shown in Figure 1. The detector consists of two waterproof concrete cells set up 2.6 m underground (the thickness of the soil and the concrete ceiling is 2.25 and 0.35 m, respectively). The measured density of the soil and the concrete cells is 2.1 and 2.41 g cm−3, respectively. Each cell, 7.15 m wide × 7.15 m long × 1.5 m deep in size, is filled with water and equipped with three downward-facing PMTs (HAMAMATSU R3600) on the ceiling. One of the 3 PMTs, which we do not use for analysis in this paper, is covered by an opaque sheet with ∼1% light transmission to reduce the number of detected photons. The timing and charge information of each PMT is recorded when a trigger signal is issued by the surface AS array. Neither water purifier nor water circulation system has been installed; the water temperature is cold and stable at 5°C−10°C at the depth of 2.6 m underground, so that bacteria scarcely proliferate and water never freezes. The data collected by the 100 m2 MD from 2008 March to 2010 February (438 live days) are used in this paper.
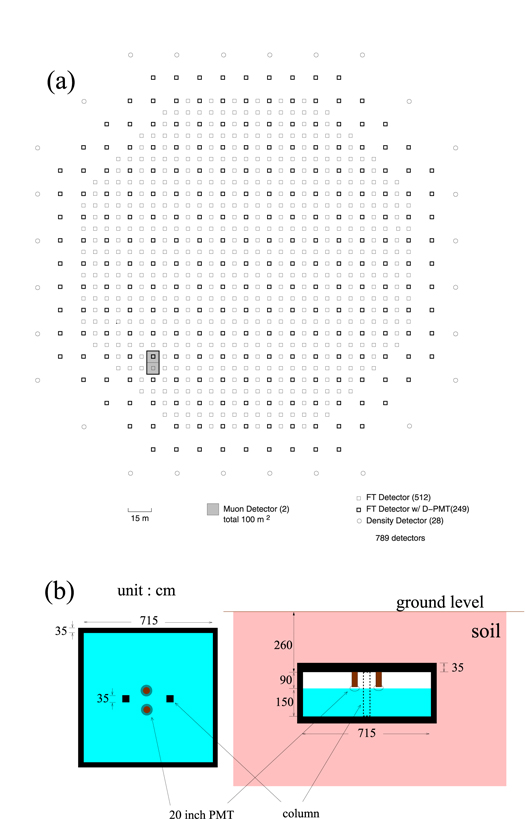
Figure 1. (a) Schematic view of the Tibet AS array. Open squares represent surface scintillation counters. The 100 m2 muon detector (two small shaded boxes) was constructed 90 m southwest of the center of the Tibet AS array. (b) Schematic view of a muon detector cell (left: top view, right:side view). The water volume is 7.15 m wide, 7.15 m long, and 1.5 m deep. Two vertical pillars reinforce the structure. Each cell is equipped with three downward-facing 20-inch-in-diameter PMTs (HAMAMATSU R3600) on the ceiling. One of the three PMTs, which is not used for analysis in this paper, is omitted from the figure.
Download figure:
Standard image High-resolution image4. RESULTS AND DISCUSSION
Figure 2 shows the ADC charge distribution recorded by one of the two PMTs in a cell extracted from the AS data, along with the corresponding photo-electron distribution obtained by our MC simulation. Details about our MC simulation are described elsewhere (Sako et al. 2009). It can be seen from Figure 2 that the MC simulation reasonably reproduces the experimental data. The charge distribution is fitted with the Landau distribution, and then the value of the charge at the peak is defined as the charge for "one muon." The average of the numbers of muons from the two PMTs is calculated for each cell, and then the sum of the averages from the two cells becomes the number of muons Nμ for an AS event. We then select gamma-like (muon-poor) events on the basis of Nμ so as to maximize the detection significance of the gamma-ray source. Over 90% of gamma rays survive the Nμ-based event selection above 100 TeV.
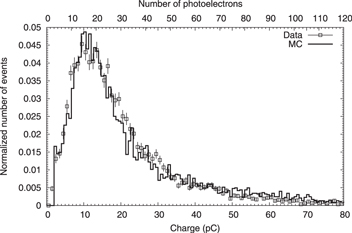
Figure 2. Charge distribution recorded by one of the two PMTs in a cell of the 100 m2 muon detector extracted from air shower data (open squares), along with the corresponding photo-electron distribution obtained by our MC simulation (solid line).
Download figure:
Standard image High-resolution imageFigure 3 shows the fraction of the number of background cosmic rays that survive the Nμ-based event selection, as a function of  ρFT approximately proportional to the primary cosmic-ray energy. The experimental data taken by the 100 m2 MD demonstrate that the fraction greatly decreases with increasing energy, and that the fraction reaches 5 × 10⁻⁴ at around 4000 TeV. Considering the difference of the covering area between the full-scale MD array and the 100 m2 MD, the number of muons detected by the 100 m2 MD would be about 100 times smaller than that by the full-scale MD array, since the lateral distribution of AS muons is rather flat. In terms of the number of muons, the 100 m2 MD observes the energy scale about 100 times higher in comparison with the full-scale MD array, because the number of muons contained in ASs is roughly proportional to the primary particle's energy (∝E0.85). It is seen in Figure 3 that the fraction expected by the full-scale MD array (10,000 m2) comes at about 200 times lower along the horizontal axis than the experimental data by the 100 m2 MD. This fact assures that our MC simulation for the full-scale MD array is valid, at least up to ∼20 TeV.

Figure 3. Fraction of the number of background cosmic rays that survive the Nμ-based event selection, as a function of  ρFT. Open diamonds represent the fraction obtained by our detailed MC simulation (Sako et al. 2009) for the full-scale (10,000 m2) MD, while closed circles indicate the fraction calculated from the experimental data of the 100 m2 MD. Open squares show the fraction by MC simulation for the 100 m2 MD.
Download figure:
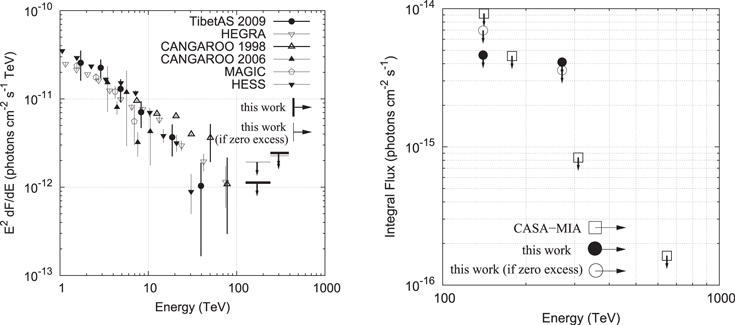
Standard image High-resolution imageWe next search for steady gamma-ray emission from the Crab Nebula above ∼100 TeV. To estimate the numbers of background events (NOFF) and signal events (NON), we adopt what we call the equi-zenith angle method (Amenomori et al. 2009), in which the search window radius is fixed at 04. Table 1 summarizes the statistics of the data that remain within the 04 radius window centered at the Crab Nebula. Note that the NONs and NOFFs are the numbers of events that remain after the Nμ-based event selection by the 100 m2 MD. No significant excess is found, and the upper limits at the 90% confidence level are obtained on the Crab's differential and integral flux, as shown in Figures 4(a) and (b), respectively, according to a statistical prescription (Helene 1983). Figure 4(b) also includes upper limits at the 90% confidence level obtained by the CASA-MIA experiment (Borione et al. 1997). It can be seen that this work provides the most stringent upper limit above 140 TeV.
Figure 4. (a) Upper limits on the Crab Nebula's differential flux at the 90% confidence level obtained by this work (thick solid lines with downward arrows). The upper limits obtained by this work assuming zero excess counts are drawn by thin solid lines with downward arrows. The flux points measured by our previous work (closed circles; Amenomori et al. 2009) as well as by HEGRA (open inverse triangles; Aharonian et al. 2004), CANGAROO (filled and open triangles; Tanimori et al. 1998; Enomoto et al. 2006), MAGIC (open pentagons; Albert et al. 2008), and H.E.S.S. (filled inverse triangles; Aharonian et al. 2006) are also shown. (b) Upper limits on the Crab Nebula's integral flux at the 90% confidence level obtained by this work (filled circles with downward arrows), along with the upper limits at the 90% confidence level by CASA-MIA (open squares with downward arrows). The upper limits obtained by this work assuming zero excess counts are drawn by open circles with downward arrows.
Download figure:
Standard image High-resolution image
Table 1. Data Statistics of the Search for Gamma Rays From the Crab Nebula by Means of the Equi-Zenith Angle Method (Amenomori et al. 2009)
| Differential | |||||
|---|---|---|---|---|---|
 ρFT Bin ρFT Bin |
Energy (TeV) | NON | NOFF | Excess | Flux Upper Limit (90% C.L.) |
| × 10−17 (cm−2 s−1 TeV−1) | |||||
1700 ≤  ρFT < 3000 ρFT < 3000 |
170 | 59 | 68.9 | −9.9 | 3.89 |
| if 0 | 6.65 | ||||
3000  4500 4500 |
300 | 12 | 11.3 | +0.7 | 2.75 |
| if 0 | 2.55 | ||||
| Integral | |||||
 ρFT Bin ρFT Bin |
Energy (TeV) | NON | NOFF | Excess | Flux Upper Limit (90% C.L.) |
| × 10−15 (cm−2 s−1) | |||||
| ≥1700 | ≥140 | 75 | 83.5 | −8.5 | 4.61 |
| if 0 | 6.95 | ||||
| ≥3000 | ≥270 | 16 | 14.6 | +1.4 | 4.10 |
| if 0 | 3.58 | ||||
Note. The representative energy for a differential upper limit is the logarithmic mean of the primary gamma-ray energies in the corresponding  ρFT bin, while the representative energy for an integral upper limit is the mode of the primary gamma-ray energies in the corresponding
  ρFT bin. The NONs and NOFFs are the numbers of events within the 04 radius window centered at the crab nebula after the Nμ-based event selection by the 100 m2 MD. The upper limits assuming zero excess counts are also written.
Download table as: ASCIITypeset image
During the whole period of the 100 m2 MD's operation, there were two gamma-ray flares from the Crab Nebula reported above 100 MeV (Abdo et al. 2011; Tavani et al. 2011); one lasted ∼16 days in 2009 February with a flux of four Crabs, and the other occurred for 4 days in 2010 September with a flux of six Crabs. Unfortunately, the Tibet AS array was briefly not in operation at the times of those flares.
5. CONCLUSIONS
The 100 m2 water Cherenkov MD was successfully constructed in 2007. We find that our MC simulation is in good agreement with the experimental data. Using the data collected by the 100 m2 MD from 2008 March to 2010 February (438 live days), we search for continuous gamma-ray emission from the Crab Nebula above 100 TeV. No significant excess is found, and the most stringent upper limit is obtained above 140 TeV.
The collaborative experiment of the Tibet Air Shower Arrays has been performed under the auspices of the Ministry of Science and Technology of China and the Ministry of Foreign Affairs of Japan. This work was supported in part by a Grant-in-Aid for Scientific Research on Priority Areas from the Ministry of Education, Culture, Sports, Science and Technology, by Grants-in-Aid for Science Research from the Japan Society for the Promotion of Science in Japan, and by the Grants from the National Natural Science Foundation of China and the Chinese Academy of Sciences.