


ABSTRACT
We present simultaneous, high-resolution, multi-temperature observations of running waves and umbral flashes in a sunspot with the Interface Region Imaging Spectrograph. We analyze intensity variations in slit-jaw images to investigate the relationship between running waves in the 1400 Å (Si iv/transition region) passband and umbral flashes in the 2796 Å (Mg ii/chromosphere) passband. Using global wavelet analysis, we find that the dominant wave periods increase from approximately 150 s near the sunspot center to about 300 s in the penumbra in both passbands. This coincides extremely well with the radially increasing inclination of magnetic field lines observed with Solar Dynamics Observatory/Helioseismic and Magnetic Imager, suggesting that the waves are propagating vertically along the inclined field lines. Furthermore, apparent horizontal velocities for running waves decrease from about 12 km s−1 in the umbra to about 4 km s−1 in the penumbra which is predicted by the same inclined field geometry. Finally, we find that umbral flashes lead running waves in both the spatial and temporal domains. The former result is attributable to the inclined field geometry; however, the geometry does not predict the radially increasing time lag which is likely due to the opacity difference between the emission lines that dominate the two passbands. These results suggest that running waves and umbral flashes both originate from photospheric p-mode oscillations and are manifestations of upward-propagating slow magnetoacoustic modes at different altitudes and temperatures. The apparent trans-sunspot propagation of running waves is not real but rather an image of these upward-propagating modes traveling along field lines of radially increasing inclination.
Export citation and abstract BibTeX RIS
1. INTRODUCTION
Magnetohydrodynamic (MHD) waves are subject to intense scrutiny in solar physics as they are believed to play a key role in transporting energy through the solar atmosphere. Furthermore, observing the propagation of these waves can probe the underlying atmospheric plasma and magnetic field, the properties of which are notoriously difficult to observe directly.
Sunspot oscillations are some of the most notable wave phenomena observed in the solar atmosphere. They were first observed by Beckers & Tallant (1969) as sudden brightenings in Ca ii H and K lines known as umbral flashes (UFs). UFs were found to have periods of around three minutes in chromospheric lines and are now understood to be the chromosphere's response to forcing from photospheric p-mode oscillations (Kneer et al. 1981; Thomas et al. 1982; Thomas 1985; Lites 1992; Yuan et al. 2014). Early theories suggested that UFs were a chromospheric resonant standing wave in the sunspot umbra, but observations of highly nonlinear three-minute oscillations in the transition region and corona suggested they are likely propagating waves (Brynildsen et al. 1999a, 1999b, 2002, 2004; Maltby et al. 1999; O'Shea et al. 2002; De Moortel et al. 2002; Tian et al. 2014).
Running waves (RWs) appear as radially propagating concentric wave fronts emanating from the inner part of sunspots. These waves were first observed in the chromosphere by Giovanelli (1972) and Zirin & Stein (1972) in Hα, and were found to propagate with typical apparent speeds of 10–25 km s−1. The former interpreted the waves as Alfvénic modes while the latter concluded they were acoustic in nature. Early observations established a usual period range of 200–300 s; however, periods close to 1000 s have been observed near the outer edge of the penumbra (Jess et al. 2013). Until recently, these waves were only observed in the penumbra, hence their original moniker: "running penumbral waves (RPW)." Kobanov & Makarchik (2004) first observed RWs in the umbra, but believed the waves were unrelated to those in the penumbra; furthermore, Freij et al. (2014) observed RWs in a solar pore. Briskin & Zirin (1997) and Kobanov & Makarchik (2004) found that wave periods tend to increase and apparent phase speeds tend to decrease in the penumbra with distance from the sunspot center. Recent velocity and intensity observations have shown that RWs exhibit significant nonlinear behavior including shock wave behavior (Hansteen et al. 2006; De Pontieu et al. 2007; Rouppe van der Voort & de al Cruz Rodriguez 2013; Tian et al. 2014; Chae et al. 2014). Improvements in ground-based and space-based observations have allowed for the investigation of the influences of RWs upon other small-scale features; for example, Chae et al. (2014) proposed that superpenumbral fibrils are powered by the shock behavior of RWs.
The origin and means of propagation of RWs have been heavily debated over the past few decades. Two theories have emerged to explain the nature of these waves. The first suggests RWs are trans-sunspot waves, propagating outward from the sunspot center at a fixed altitude. This was first motivated by Alissandrakis et al. (1992) and Tsiropoula et al. (1996, 2000) who suggested that umbral oscillations trigger RWs which then propagate across the sunspot into the penumbra. The other theory suggests that the apparent radial propagation of RWs is a signature of upward-propagating magnetoacoustic modes traveling along inclined field lines (Christopoulou et al. 2000, 2001; Rouppe van der Voort et al. 2003; Bloomfield et al. 2007; Jess et al. 2013). Work over the past decade has focused on multi-altitude observations of RWs and UFs. Christopoulou et al. (2000, 2001) and Georgakilas et al. (2000) used velocity and intensity data from Hα and Fe i 5576 Å lines to determine phase lags between sunspot oscillations at different chromospheric altitudes, concluding that RWs are upward-propagating modes triggered by photospheric oscillations. Tziotziou et al. (2006) and Tziotziou et al. (2007) used Ca ii 8542 Å and Hα in a similar analysis, but they could not conclude whether RWs were upward-propagating or trans-sunspot modes due to large jumps in the dominant wave period near the umbra-penumbra boundary. Jess et al. (2013) found a similar jump in periodicity in one quadrant of a sunspot and showed that it corresponded with a sharp change in the magnetic inclination angle using a potential field source surface (PFSS) field extrapolation.
According to Bogdan (2000), poor angular and temporal resolution are significant limitations to further investigation of sunspot oscillations. The work presented in this paper makes use of the high-resolution, high-cadence imaging data collected by the Interface Region Imaging Spectrograph (IRIS; De Pontieu et al. 2014). IRIS allows near simultaneous observation of UFs in chromospheric lines and RWs in transition region lines.
The goal of this work is to determine the relationship between UFs and RWs whereby we can eliminate one of the two theories of RW propagation. We will achieve this goal using the near ultraviolet (NUV) and far ultraviolet (FUV) slit-jaw images of a single sunspot located near the disk center. This analysis will combine observations of both chromospheric (Mg ii) and transition region (Si iv) emission whereas most previous observations focused only on chromospheric emission. Using several image processing and signal processing techniques, we measure the spatial distribution of dominant wave periods and apparent velocities in both passbands. We also determine the separation between occurrences of UFs and RWs in the spatial and temporal domains.
The remainder of this paper is structured as follows. Section 2 will discuss the IRIS slit-jaw observations and the target sunspot. Section 3 will explain the image and signal processing techniques applied to the data. Section 4 will explain the four main results of the analysis and discuss how each does or does not support the two theories of RW propagation. Finally, Section 5 summarizes and further elaborates upon the findings presented in the previous section.
2. OBSERVATIONS
In this work, we analyze slit-jaw images from sit-and-stare observations collected from 16:39 to 17:59 UT on 2013 September 2. For an analysis of the accompanying spectral observations, please refer to the companion paper ("Paper I," Tian et al. 2014). A single sunspot was observed near the disk center (Solar X = 100 arcsec, Solar Y = 59 arcsec) in the 1330 Å (C ii), 1400 Å (Si iv), and 2796 Å (Mg ii) passbands. Each of the slit-jaw images had a plate scale of 0.167 arcsec per pixel, an integration time of 2 s, and a cadence of 12 s between successive images in the same passband. The data were calibrated via dark current subtraction, and flat-field and geometrical corrections (De Pontieu et al. 2014).
We focus our study on two IRIS passbands: 1400 Å and 2796 Å. The 1400 Å passband is dominated by two strong, optically thin Si iv lines (1393.8 Å and 1402.8 Å). These lines form in the transition region at a temperature of approximately 80,000 K. The 2796 Å passband is dominated by the strong, optically thick Mg ii k line. This line forms in the upper chromosphere at an approximate temperature of 10,000 K. The width of the 2796 Å passband is very small (Δλ = 4 Å) and is encompassed almost entirely by the Mg ii k line. However, the 1400 Å passband is considerably broader (Δλ = 40 Å), so it is critical to check for contamination by upper photospheric UV continuum in this passband. Figure 1 compares the time evolution of the average peak emission incident within two pixels of the slit on the 1400 Å slit-jaw images to the Si iv spectral line intensity isolated by the spectrometer in Paper I. Both space–time plots exhibit remarkably similar oscillatory structure, indicating that Si iv line emission accounts almost entirely for the total emission incident on the 1400 Å slit-jaw images for this observation. If significant continuum emission were present in the 1400 Å passband, it would be difficult to distinguish oscillations observed in the photosphere (continuum) from similar phenomena in the transition region (line emission).
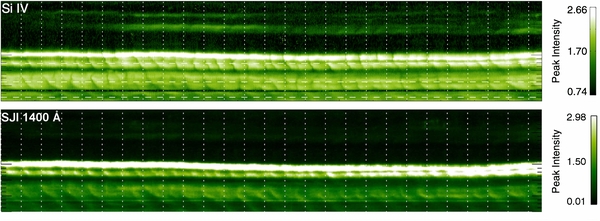
Figure 1. Comparison of Si iv line emission from Paper I (top) and emission incident within two pixels of the slit from 1400 Å slit-jaw images (bottom). Each dotted vertical line represents three minutes of observation and the vertical axis shows 22 arcsec along the length of the slit. The units of peak intensity are arbitrary. A two-pixel radius was sampled around the slit to account for convolution of the slit image though IRIS's optics assembly. Similar oscillatory intensity variations are found in both time series, suggesting that photospheric UV continuum emission is negligible compared to transition region Si iv line emission in the 1400 Å slit-jaw images from this observation.
Download figure:
Standard image High-resolution imageThe sunspot belongs to NOAA active region 11836 located near the disk center at the time of observation. Slit-jaw images of the sunspot in 1400 Å and 2796 Å can be found in Figure 2, while online movies of RWs in 1400 Å and UFs in 2796 Å can be viewed in Paper I. The sunspot is fairly circular and exhibits a light bridge west of the sunspot center. A clear umbra-penumbra boundary could not be identified from the 1400 Å and 2796 Å slit-jaw images; instead, the boundary was defined using a 4500 Å observation taken at 17:00 UT using the Atmospheric Imaging Assembly (AIA; Lemen et al. 2012) onboard the Solar Dynamics Observatory (SDO; Pesnell et al. 2012). The RWs are clearly seen across the sunspot except in the northwest quadrant of the umbra and penumbra where the signal-to-noise ratio is low. Umbral flashes are observed throughout the sunspot umbra in 2796 Å slit-jaw images. The oscillations are more clearly seen when the contrast between the umbra and the surrounding environment is eliminated. We achieved this by subtracting a centered running mean from each slit-jaw image. The mean was taken over 25 images, equivalent to five minutes of observation. The mean was subtracted from the 13th image (the central image) of each running set with the exception of the first and last 12 images, each of which were reduced by the mean of the first or last 25 images, respectively. The 1400 Å and 2796 Å images were coaligned by matching the fiducial lines found on the slit.
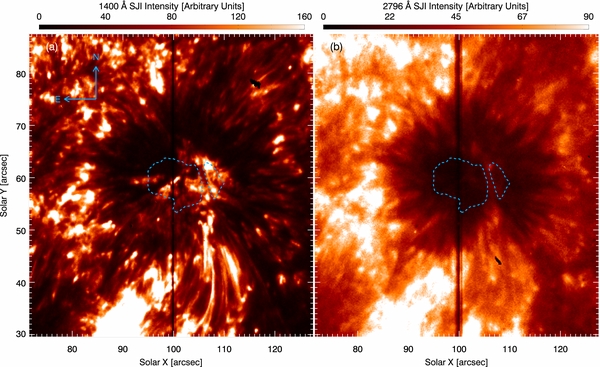
Figure 2. IRIS slit-jaw images from the (a) 1400 Å and (b) 2796 Å passbands. The brighter features surrounding the sunspot have been artificially saturated to enhance contrast within the umbra and penumbra. The blue dashed contours represent the umbra-penumbra boundary identified from SDO/AIA 4500 Å observations
Download figure:
Standard image High-resolution image3. DATA ANALYSIS
The motivation for this analysis is to produce more evidence to test the two theories of RW propagation by better understanding the relationship between UFs and RWs. We achieve this by using several image and signal processing techniques to determine dominant wave periods, apparent trans-sunspot velocities, and spatial and temporal separations between UFs and RWs.
First, we determined the spatial distribution of dominant wave periods in both passbands. We applied global wavelet analysis (Torrence & Compo 1998) to the mean-subtracted intensity signal as a function of time. Using a Morlet wavelet, we generated wavelet time series for the intensity signal at each pixel. We determined the global wavelet power as a function of Fourier period by averaging the wavelet power across all time bins. We define the dominant wave period as the Fourier period associated with the maximum global wavelet power. A dominant wave period above the 95% confidence threshold was found for all pixels.
Next, we estimated the apparent velocities of RWs and UFs with space–time plots. A one pixel wide horizontal cut was established across the sunspot center for each mean-subtracted slit-jaw image. The waves produce alternating chevron-like bands of low and high intensity that are roughly perpendicular to the time axis. The apparent velocity of the propagating oscillations within the umbra and penumbra were determined by taking the average slope (i.e., extent along the spatial axis divided by extent along the time axis) of the repeating bright features. Frequency filtering was not used to determine the slopes across distinct regions of the sunspot; instead, a best-fit process was applied to each bright feature across five small (3–5 arcsec) spatial bins. Three bins sampled the sunspot umbra: two extending on either side of the sunspot center to the light bridge and a third covering the umbral region west of the light bridge. Two bins sampled the sunspot penumbra: one extending from the eastern umbra-penumbra boundary on the eastern side of the light bridge and the other extending the same distance from the western umbra-penumbra boundary on the western side of the light bridge. These bins extended five arcseconds in 1400 Å and three arcseconds in 2796 Å. A best-fit line was determined for each feature in each bin by fixing the endpoints of the line to the points of maximum intensity along the boundaries of the bins.
Next, we determined the spatial and temporal separation between the oscillations observed in the two passbands. We determined the offset visually by superimposing contours of 2796 Å intensity atop the mean-subtracted 1400 Å images. Next, we calculated the time lag between appearances of oscillations in the two passbands along the same line-of-sight. We cross-correlated the 1400 Å mean-subtracted intensity signal at each pixel with the corresponding mean-subtracted 2796 Å signal. Both signals were spline interpolated to improve the time resolution by an order of magnitude (12 s to 1.2 s) before undergoing cross-correlation. The time lag at a given pixel was taken to be the time shift corresponding to the maximum cross-correlation coefficient. However, a problem arises since the cross-correlation coefficient as a function of time shift is sinusoidal if the two input signals are also sinusoidal with similar periods. In this case, the local maximum closest to zero represents the true time lag while all other local maxima represent integer multiples of the time lag. To avoid this ambiguity, we only selected maxima within a narrow time shift range of −300 s to 300 s, even if the local maximum was not the global maximum of the cross-correlation coefficient function. Additionally, we only considered time lags associated with strong correlations, so any time lag associated with a correlation coefficient below 0.5 was set to zero seconds.
4. RESULTS AND DISCUSSION
4.1. Dominant Wave Period
In both 1400 Å and 2796 Å slit-jaw images, we find that the dominant wave periods increase with distance from the sunspot center. Figure 3(a) shows the dominant wave period distribution for the 1400 Å passband. We find wave periods as low as 150 s near the sunspot center and 250–300 s in the penumbra. We find a similar trend in the umbral section west of the light bridge. The 2796 Å passband in Figure 3(b) exhibits a similar period distribution to the 1400 Å passband.

Figure 3. Panels (a) and (b) are maps of dominant wave periods observed in intensity variations from the 1400 Å and 2796 Å passbands, respectively. Panel (c) is a map of the cosine of magnetic inclination angle from HMI full-vector magnetic field observations of the solar photosphere. The dashed white contours in panels (a) through (c) represent the umbra-penumbra boundary. Panel (d) consists of contours from panel (c) superimposed on panel (b). The innermost contour represents a cosine of 0.95 while the outermost represents a cosine of 0.7. Each successive contour represents a change in cosine of 0.05. The bottom two panels are (e) horizontal and (f) vertical profile cuts of the 2796 Å dominant wave period (solid blue line) and cosine of the magnetic inclination angle (solid red line). The vertical dotted lines in (e) and (f) denote crossings of the umbra-penumbra boundary. The solid light blue lines in panel (d) denote the location of the profile cuts plotted in (e) and (f).
Download figure:
Standard image High-resolution imageBoth the upward-propagating theory and the trans-sunspot theory can explain the outward period increase; however, the upward-propagating theory seems more consistent with the observations. According to the trans-sunspot theory, RWs in the penumbra are excited by UFs in the chromospheric umbra. This would suggest an approximately constant period throughout the sunspot. The larger periods found at larger distances are not consistent with this scenario; although, it is possible that the period is adjusted by the local plasma and magnetic field properties. On the other hand, the upward-propagating theory implies RWs are slow magnetoacoustic modes affected by the inclination angle of the emerging magnetic field. Bel & Leroy (1977) predicted and McIntosh & Jefferies (2006) later observed with a PFSS field extrapolation that these modes were limited by a lower-bound cutoff frequency proportional to the cosine of the magnetic field inclination angle with respect to the solar normal. Furthermore, Jess et al. (2013) used a PFSS model to show how the dominant wave period follows the acoustic cutoff frequency: as field lines become more inclined outward from the sunspot center, the acoustic cutoff frequency decreases, allowing longer period waves to propagate.
A sharp increase in the dominant period distribution occurs near the umbra-penumbra boundary in both passbands. This trend is evident upon close inspection of the dominant period maps for both passbands in Figures 3(a) and (b), and profile cuts of the 2796 Å distributions in Figures 3(e) and (f). Both profile cuts are characterized by a gradual, linear increase near the sunspot center which transforms into much sharper but mostly linear increase near the umbra-penumbra boundary. We take advantage of this characteristic structure to disambiguate the two theories. Figure 3(c) shows the spatial distribution of the cosine of the magnetic inclination angle from the full-vector photospheric magnetic fields observed by the Helioseismic and Magnetic Imager (HMI; Scherrer et al. 2012) onboard SDO. The distribution of the inclination cosine appears to take a similar shape to the dominant period distributions of both 1400 Å and 2796 Å. Figure 3(d) shows the dominant period distribution from 2796 Å superimposed by contours of the inclination cosine distribution. The agreement between the two distributions is exceptional: the overlaid contours closely mimick both the shape and outward change of the dominant period distribution. Figures 3(e) and (f) show selected cuts from both the 2796 Å period and inclination cosine distributions. The two distributions exhibit strong complementary behavior: sharp increases in the dominant period correspond to sharp decreases in the cosine of the magnetic field inclination and vice versa. This is demonstrated particularly well at the light bridge located near Solar X = 106 arcsec in Figure 3(e) and the area immediately north the southern tail-like structure located near Solar Y = 54 arcsec in Figure 3(f). These locations feature dramatic and sudden increases in magnetic field inclination accompanied by similar increases of the dominant wave period. We find complementary behavior between field inclination and dominant wave period even far into the penumbra as observed near Solar X = 57 arcsec in 3(e) and near Solar Y = 48 arcsec and 71 arcsec in 3(f). The correspondence between the two distributions is remarkable even though both were observed at different altitudes in the solar atmosphere, lending considerable support to the upward-propagating interpretation of RWs.
4.2. Apparent Velocity
The apparent trans-sunspot velocities of both RWs in 1400 Å and UFs in 2796 Å decrease from the sunspot center. Figure 4 shows space–time plots of horizontal cuts through the sunspot center from each passband. Both plots exhibit repeating C-shaped features of enhanced intensity similar to the "chevron" features observed in space–time plots of three-minute oscillation by Kobanov et al. (2006). The slope of these features represents the apparent velocity of the intensity enhancements created by RWs and UFs traveling along the horizontal cut.
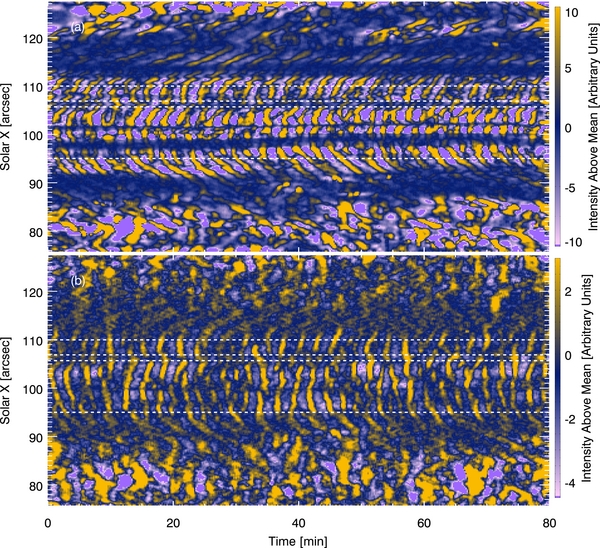
Figure 4. Space–time plots of intensity variations along horizontal cuts in (a) 1400 Å and (b) 2796 Å passbands. The horizontal cuts were taken across the sunspot center along Solar Y = 59 arcsec. The horizontal dashed lines in both panels denote crossings of the umbra-penumbra boundary. Alternating C-shaped structures are present in both plots indicating outward decreasing apparent velocities for both RWs and UFs.
Download figure:
Standard image High-resolution imageIn 1400 Å, we find that the C-shaped enhancements are roughly symmetric about the sunspot center located at Solar X = 100 arcsec. West of the sunspot center, the slope of the enhancements smoothly decreases from about 12 km s−1 in the umbra until it suddenly steepens near about Solar X = 106 arcsec. This point corresponds to the light bridge of the sunspot. The slope resumes its decrease west of the light bridge until the features experience a sudden shift in the time domain outside of the western umbra-penumbra boundary near Solar X = 112 arcsec. The displacement is clearly visible in the first 40 minutes of observation. The slope then decreases rapidly in the penumbra to about 4 km s−1. The umbral apparent velocity is largely consistent with previous observations of RWs (e.g., Tziotziou et al. 2006, 2007); however, the penumbral estimate is atypically low. It should also be noted that much higher apparent velocities reaching average values of 55 km s−1 in the umbra and 50 km s−1 in the penumbra have also been observed (Kobanov et al. 2008). East of the sunspot center, the slope smoothly decreases with the exception of an area of low signal-to-noise near Solar X = 98 arcsec where it is difficult to determine the shape of the enhancement.
The C-shaped features are also clearly present in the 2796 Å passband. The features are almost vertical throughout the umbra as a result of UFs in 2796 Å being much broader than RWs in 1400 Å. Because of this, it is difficult to accurately determine the umbral apparent velocity for 2796 Å. However, Figure 4(b) shows weak intensity enhancements due to UFs in the penumbra. Using these enhancements, we find a penumbral apparent velocity similar to that found in 1400 Å of approximately 4 km s−1. Also, a similar but less dramatic alteration of the slope is visible near the light bridge.
These results are largely consistent with the upward-propagating theory. Figure 5(a) depicts the geometric explanation for the apparent velocity distribution assuming the upward-propagating theory is true. P-mode oscillations at the photosphere trigger slow magnetoacoustic modes which travel upward along field lines of outward increasing inclination. Once a slow mode reaches the line formation altitude for 1400 Å or 2796 Å, it manifests as an RW or a UF, respectively. It takes longer for slow-mode waves traveling along more inclined field lines to reach the emission line formation altitude. Now, we consider successive appearances of RWs starting from the sunspot center outward. The time between evenly spaced successive appearances will become longer further from the sunspot center due to the increasing inclination. The result is a radially decreasing apparent horizontal velocity. Note that Figure 5(a) assumes a constant formation altitude instead of one that is more extended near the sunspot center (Nicolas et al. 1982; Tian et al. 2009). We do not expect an extended formation altitude to influence the apparent velocities as much as the magnetic field inclination.
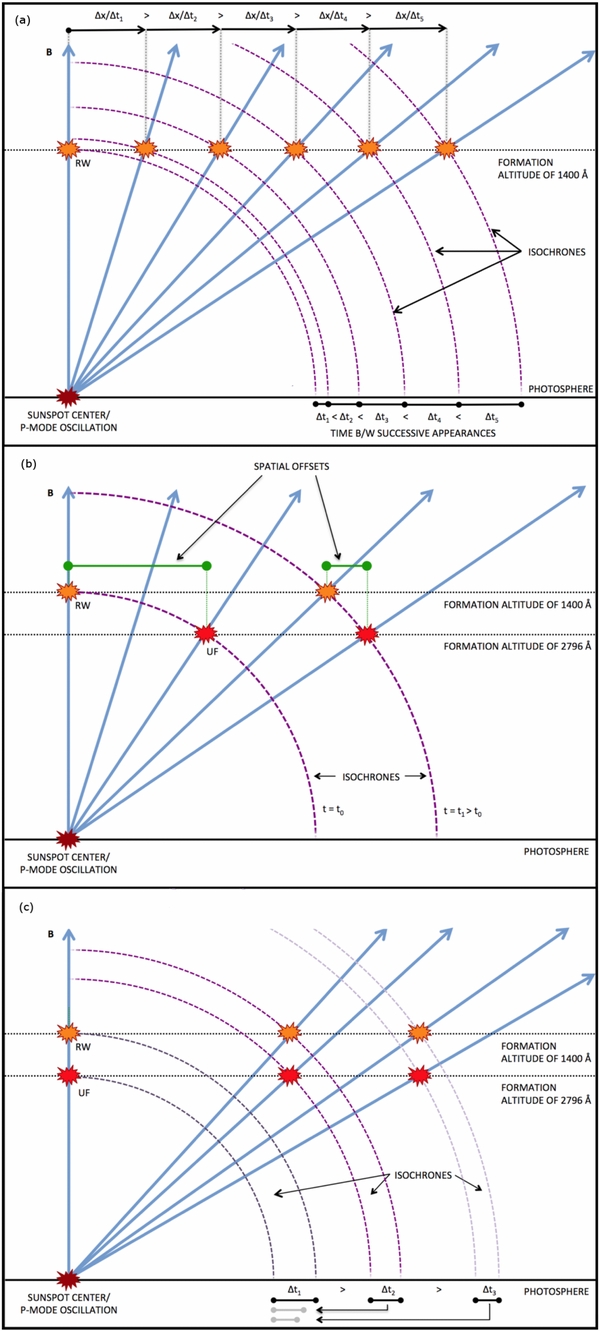
Figure 5. Diagrams of geometric configurations consistent with an upward-propagating scenario. The three panels depict the geometry responsible for (a) observed outward-decreasing apparent velocity, (b) observed spatial separation between UFs and RWs, and (c) expected outward decrease in time lag. The photosphere (solid black line) is shown at the bottom of each diagram where a p-mode oscillation at the sunspot center (dark red cloud) triggers waves that propagate along magnetic field lines (blue lines) of outward-increasing inclination. When these waves reach the formation altitudes (dashed lines) for 2796 Å and 1400 Å, they form UFs (light red clouds) and RWs (orange clouds). UFs and RWs that appear simultaneously in slit-jaw images fall on the same circular isochrone (purple dashed line). For simplicity, formation altitudes are assumed constant across the sunspot.
Download figure:
Standard image High-resolution imageIt would be difficult to explain the small apparent velocity in the context of the trans-sunspot theory. For fast magnetoacoustic modes, the apparent velocity across the sunspot would be comparable to the Alfvén velocity. In the upper chromosphere and transition region where Mg ii and Si iv form, respectively, typical Alfvén speeds are on the order of 100 km s−1 which is much larger than the velocities observed.
4.3. Spatial Separation
UFs appear to lead RWs spatially. Figure 6 shows six consecutive frames from a series of a mean-subtracted 1400 Å slit-jaw images superimposed by contours representing UFs in 2796 Å. Observing the frames in sequence shows that UFs first appear near the sunspot center and then propagate radially outward. The flashes rapidly gain intensity near the sunspot center and then gradually drop in intensity for the latter majority of their outward propagation. After about 30–40 s, an RW appears at the sunspot center to accompany the UF. The UF is the first to move outward with the RW wave front following behind for the duration of its propagation. Given how broad and short-lived UFs are, it is difficult to measure their physical separation from RWs. However, the consistency with which UFs spatially lead RWs is certainly significant.

Figure 6. Sequence of IRIS slit-jaw observations of RWs in 1400 Å (orange background) and a UF in 2796 Å (solid white contours). The 1400 Å slit-jaw images have been mean-subtracted and smoothed by a four-pixel-wide boxcar function to better accentuate intensity enhancements due to RWs. The UF appears and grows in intensity from (a) until (c) when an RW wave front appears at the same location. The UF moves ahead of the RW and maintains its spatial lead throughout its propagation in (c) through (e). The intensity enhancement associated with the UF diminishes as it nears the umbral-penumbral boundary, finally extinguishing in (f). The RWs are not as spatially limited in their propagation and continue to travel into the penumbra.
Download figure:
Standard image High-resolution imageThis apparent separation is more consistent with an upward-propagating theory of RWs. Figure 5(b) shows a similar geometric argument to the one used to justify the observed apparent velocities. We consider UFs and RWs that appear simultaneously in the slit-jaw images. The radially increasing magnetic field inclination demands that UFs appear further outward from the simultaneously observed RWs. Slow mode waves traveling along inclined field lines will take longer to reach a line formation altitude than those traveling along more vertical lines. So, for a simultaneously appearing UF/RW pair, the UF is always associated with the more inclined field line, appearing to the lead the RW because of the greater apparent horizontal distance traveled to reach the 2796 Å formation altitude. Furthermore, the apparent spatial separation should decrease with distance from the sunspot center; however, this effect is difficult to observe given the broad shape of the umbral flashes and the limited extent of their propagation.
It is difficult to reconcile the observed spatial separation with the trans-sunspot theory. If RWs were fast magnetoacoustic modes fixed at a single chromospheric altitude, then the likeliest source of RWs would be UFs themselves. Under those circumstances, we would expect UFs to follow behind RWs at least near the sunspot center where RWs appear to originate. However, the UFs lead RWs throughout their propagation, which is not consistent with this expectation.
4.4. Time Lag
The appearances of UFs also lead appearances of RWs in the time domain along the same line-of-sight. Figure 7 shows the spatial distribution of time lag between 2796 Å and 1400 Å. Strong correlation signals were predominately found in the southern half of the sunspot and west of the light bridge where there is high signal-to-noise in both passbands. The distribution shows a clear outward increase in time lag from ∼25 s near the sunspot center to ∼60 s in the penumbra. This result is unexpected if we assume the primary contributor to the time lag is the separation between the formation altitudes of 1400 Å and 2796 Å. Figure 5(c) demonstrates the expected radial dependence of the time lag assuming the upward-propagating theory is correct. Farther from the sunspot center, the difference in travel distance from the photospheric sunspot center to the 2796 Å and 1400 Å formation altitudes becomes smaller. If all waves traveling along the field lines have the same phase velocity, we expect the difference in arrival times between UFs and RWs to become smaller as well. By geometry alone, we expect the time lag to decrease outward.

Figure 7. Map of the observed time lag between the intensity signals in 1400 Å and 2796 Å. Strong cross-correlations were detected primarily in the southern and western areas of the sunspot. The red dashed contour represents the umbra-penumbra boundary. Oscillating intensity variations in 2796 Å are observed to lead those of 1400 Å throughout the umbra and penumbra. The observed time lag increases outward from the sunspot center, contradicting the expected outward decrease due to the difference in formation altitudes of 1400 Å and 2796 Å emissions and also the inclined magnetic field geometry consistent with an upward-propagating scenario.
Download figure:
Standard image High-resolution imageGeometry likely contributes little to the observed time lag, and the observed time lag distribution may not be inconsistent with the upward-propagating theory after all. Figure 8 shows a scatter plot of time lag versus dominant wave period. We calculated a Pearson product-moment correlation of r = 0.24 from the data set. With 3,265 data points, our Pearson correlation coefficient provides a t-value of t = 14, indicating that the probability of no linear correlation is less than 0.0001. This highly statistically significant linear correlation suggests that the time lag may vary with wave properties. The radially decreasing time lag may be explained by the opacity difference between the Si iv and Mg ii lines. Si iv lines are optically thin lines meaning their intensities depend almost entirely upon the local density. On the other hand, the Mg ii k line is an optically thick line, the intensity of which depends not only upon the local density but also upon the local temperature. As a result, the two lines do not achieve maximum intensity at the same oscillation phase. Paper I demonstrates that sunspot oscillations behave as shock waves where line intensities peak after a rapid compression signified by a sharp blueshift. Figures 4(D) and 4(F) of Paper I show the line intensity variations for Si iv and Mg ii, respectively, over the course of a single oscillation period. Mg ii clearly achieves maximum intensity before Si iv since it responds immediately to the rapid change of temperature while Si iv must wait for full compression by the shock before doing so. The time separation between the two maximum intensities is on the order of 30 s, comparable to the time lags observed in Figure 7. Assuming the maximum intensities of each line always occur at their respective phases, a correlation between the period and time lag should be expected. So the outward increase of the time lag is likely just a reflection of the outward increase in period.

Figure 8. Scatter plot of the time lags and the corresponding dominant wave periods observed in the umbra and penumbra. A negligible amount of Gaussian noise was added to the data to visually break up the discrete sampling of the two quantities. A highly statistically significant linear correlation exists between the two quantities. The solid black line is the linear least-squares fit of the data set.
Download figure:
Standard image High-resolution image
Here we point out that the time lags measured from the intensity and Doppler shift are different. The time lags measured from the Doppler shifts are likely less affected by the different opacities of the Si iv and Mg ii lines, and thus smaller (∼12 s) than those measured from the intensities. We point out an error in Paper I: the time lag values should be halved due to incorrect annotations on the x axes of Figures 3(e) and (f). This error will not change the main results and conclusions of either paper, but will result in changed time lags of ∼3 s and ∼12 s for the Doppler shifts of C ii/Si iv and Mg ii/Si iv, respectively.
5. CONCLUSIONS
By analyzing the sunspot waves observed with the 1400 Å and 2796 Å slit-jaw images of IRIS, we find the following results. (1) The dominant periods increase with distance from the sunspot center in both passbands. The spatial distribution of the dominant period, including a sharp change near the umbra-penumbra boundary and at the light bridge, correlates remarkably well with the inclination angle of the measured photospheric magnetic fields. (2) The apparent velocities of RWs decrease from ∼12 km s−1 near the sunspot center in the umbra to ∼4 km s−1 in the penumbra. (3) UFs in the 2796 Å passband spatially lead the running wave fronts in the 1400 Å passband. (4) The time lags between the oscillations in both passbands along the same line-of-sight increase with distance from the sunspot center; however, this is likely not a geometric effect but rather a radiative effect arising from the opacity difference between the Si iv and Mg ii lines.
These results strongly support the notion that both UFs and RWs are the signatures of slow magnetoacoustic modes propagating upward along magnetic field lines, representing the same phenomenon at different altitudes and temperatures in the solar atmosphere. The observed radial propagation of the waves is not real, but rather the successive appearance of wave fronts traveling upward along field lines that become more inclined with distance from the sunspot center. We find little evidence of fast magnetoacoustic modes in either 1400 Å or 2796 Å slit-jaw images, and we conclude that our results are inconsistent with the trans-sunspots propagation of RWs.
The authors thank Bernhard Fleck for helpful discussions. IRIS is a NASA small explorer mission developed and operated by Lockheed-Martin Solar and Astrophysics Laboratory (LMSAL) with mission operations executed at NASA Ames Research center and major contributions to downlink communications funded by the Norwegian Space Center (NSC, Norway) through an ESA PRODEX contract. This work is supported by contracts 8100002705 and SP02J1701R from LMSAL to Smithsonian Astrophysical Observatory (SAO).