


ABSTRACT
The magnetic cloud boundary layer (BL) is a dynamic region formed by the interaction of the magnetic cloud (MC) and the ambient solar wind. In the present study, we comparatively investigate the proton and electron mean flux variations in the BL, in the interplanetary reconnection exhaust (RE), and across the MC-driven shock by using the Wind data from 1995 to 2006. In general, the proton flux has higher increments at lower energy bands compared with the ambient solar wind. Inside the BL, the core electron flux increases quasi-isotropically and the increments decrease monotonously with energy from ∼30% (at 18 eV) to ∼10% (at 70 eV); the suprathermal electron flux usually increases in either parallel or antiparallel direction; the correlation coefficient of electron flux variations in parallel and antiparallel directions changes sharply from ∼0.8 below 70 eV to ∼0 above 70 eV. Similar results are also found for RE. However, different phenomena are found across the shock where the electron flux variations first increase and then decrease with a peak increment (>200%) near 100 eV. The correlation coefficient of electron flux variations in parallel and antiparallel directions is always around 0.8. The similar behavior of flux variations in BL and RE suggests that reconnection may commonly occur in BL. Our work also implies that the strong energy dependence and direction selectivity of electron flux variations, which were previously thought to have not enough relevance to magnetic reconnection, could be considered as an important signature of solar wind reconnection in the statistical point of view.
Export citation and abstract BibTeX RIS
1. INTRODUCTION
Magnetic clouds (MCs) are large-scale transient structures in the solar wind. In the past few decades, problems about their solar origin, magnetic field, and plasma structures have been widely investigated (Bothmer & Schwenn 1994; Burlaga et al. 1980, 1981; Farrugia et al. 1994; Lepping et al. 1997, 2006). In addition, as a subset of the interplanetary coronal mass ejections (ICMEs), the propagation of MCs in interplanetary space is also an important issue in heliospheric physics research. For example, an MC could be overtaken by a corotating stream that would compress the plasma and field and make its tail region turbulent (Lepping et al. 1997). There might also be magnetic holes, directional discontinuities, or reconnection layers in the front boundary of the MCs (Janoo et al. 1998). Therefore, the interaction between the MC body and the ambient solar wind seems to be a complex problem which not only aggravates the difficulty in understanding the evolution of ICME, but also increases the complexity in identifying the MC boundary (Wei et al. 2003b, 2006).
Up to now, there is still no consistency among the criteria identifying the MC boundary, such as temperature decrease, density decrease, directional discontinuity, magnetic hole, and bidirectional streaming of suprathermal electrons, as pointed out by many researchers (Burlaga et al. 1990; Fainberg et al. 1996; Farrugia et al. 2001; Osherovich et al. 1993; Wei et al. 2003a, 2003b, 2003c, 2006;). Wei et al. (2003b) statistically analyzed the boundary physical states of 80 MCs detected from 1969 to 2001 and suggested that the MC boundary is a complex boundary layer (BL) formed by the interactions between the MC and the background solar wind, rather than a simple discontinuity. The BL ahead of an MC is called the front BL, while the following one is the tail BL (Wei et al. 2003b). For each BL, its outer boundary (M) is usually identified by the magnetic field intensity drop, the abrupt change of field angle, and is accompanied with the "three high state" in the plasma beta value, temperature, and density, while the inner boundary (G), which separates the interaction region from the MC body, is usually associated with the "three low state" also in the plasma beta value, temperature, and density (Wei et al. 2003b). The MC detected by Wind on 1997 May 15 provides a typical sample to reveal the BL's properties (see Figure 1). The spacecraft at 1 AU observed, in sequence, the MC-driven shock (if there is), the front BL, and the MC body. As seen in the figure, the magnetic field, plasma temperature, and density behaviors inside the BL, which is separated by the obvious boundaries (labeled by Mf and Gf, the subscript ''f'' means front), are completely different from those in the nearby upstream solar wind, the following MC body, and the preceding shock (sheath) region. Previous analyses show that the BL is often a unique structure exhibiting a decreased magnetic field as well as heated and accelerated plasma. These features are preliminarily interpreted to be associated with the magnetic reconnection process, since they are important manifestations that could often be observed in a magnetic reconnection region (Wei et al. 2003c, 2006).
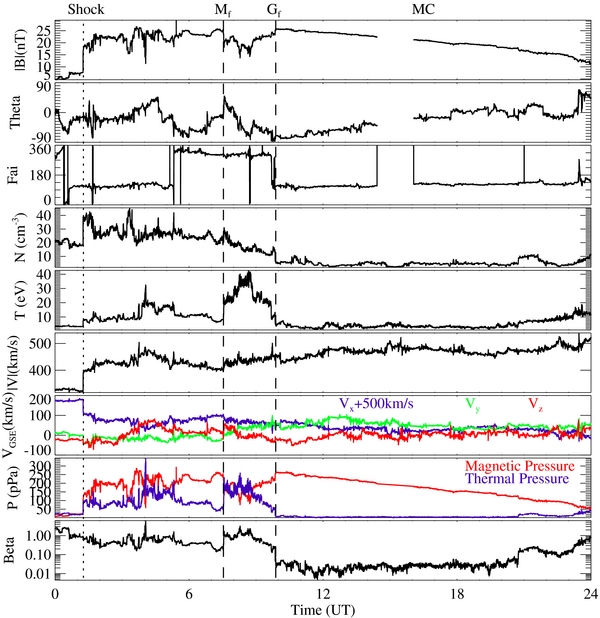
Figure 1. Wind measurements of the magnetic field strength, latitude angle, azimuth angle, proton density, temperature, velocity, pressure, and plasma beta value on 1997 May 15. The shock is indicated by the dotted lines; the dashed lines marked by Mf and Gf represent the BL region; the following MC body is also indicated.
Download figure:
Standard image High-resolution imageMagnetic reconnection is an important process that can convert magnetic energy into thermal and kinetic energy. Many researchers have intensively studied its dynamics in the geo-magnetosphere and solar corona, but the magnetic reconnection phenomena in the solar wind have drawn relatively less attention so far. Early studies suggested that interactions between a fast ICME and the ambient solar wind might cause reconnection at the compressed leading boundary region of the ICME (McComas et al. 1994). Recently, observations of reconnections at both leading and trailing boundaries of interplanetary small-scale magnetic flux ropes were also reported (Tian et al. 2010). Previous work seems to suggest that such a type of reconnection exhaust (RE) is more often observed in low-beta solar wind or in the interiors of ICMEs, but not particularly prevalent in the leading edge of an ICME since the roughly Alfvénic accelerated flows within field reversal regions, which are regarded as the ''direct evidence'' of magnetic reconnection, are hard to identify in the front region of the ICME (Gosling 2011; Gosling et al. 2005b). However, both numerical simulations and physical models have demonstrated that reconnections could occur in the front BL where MC interacts with the ambient solar wind (Dasso et al. 2006; Wang et al. 2010; Wei et al. 2003a, 2003b). Therefore, it is worthwhile to make clear what the dominant physical process is inside the BL, and whether the reconnection process plays an important role.
The magnetic field is highly related to the local plasma distribution for which the density and temperature are macroscopic manifestations of the plasma velocity distribution function (VDF). Hence, investigation of the VDF is an effective way to diagnose the magnetic field and plasma structure in the solar wind (Gosling et al. 1987, 2005c; Larson et al. 1997). Generally, the solar wind electron contains the thermal core electron and the suprathermal electron with a breakpoint near ∼70 eV. Electrons at lower energy bands play an important role in the calculation of electron density and temperature because they can be calculated from the zero- and second-order moments of VDF. The suprathermal electron usually contains two components, a nearly isotropic electron called halo and an electron beam coming directly outward from the Sun called Strahl. The suprathermal electron, especially the Strahl electron carrying the heat flux outward from the Sun, has been widely used to diagnose the magnetic field configuration in the solar wind (Gosling et al. 1987, 2005c; Larson et al. 1997). Electron heat flux dropout in the solar wind is speculated to be evidence for interplanetary magnetic reconnection (McComas et al. 1989). However, hardly any work has been done to demonstrate whether electron flux variations could be regarded as a sufficient signature for solar wind magnetic reconnection. The enhanced flux of energetic particles, especially the energetic electrons (>100 keV), might also indicate the existence of acceleration processes, such as magnetic reconnection (Lin & Hudson 1971; Oieroset et al. 2002; Wang et al. 2010) or shock (Potter 1981; Tsurutani & Lin 1985). In this paper, we use the Wind data to statistically analyze the proton and electron flux variations in the BL and compare them with those in the MC-driven shock and interplanetary RE and try to reveal the dynamic process inside the BL.
2. DATA SET DESCRIPTION AND EVENT SELECTION
The Wind three-dimensional plasma and energetic particle instrument (3DP) provides full three-dimensional distribution of electrons and protons covering a wide range of (time-varying) energy bands (Lin et al. 1995). The data provided by the electron electrostatic analyzers (EESA), the proton electrostatic analyzers (PESA), and the semiconductor telescopes (SST) will be analyzed. We only analyze the proton flux in the omni-direction since the directional proton flux data are not available online. For the electron flux data, we investigate the flux in parallel, perpendicular, and antiparallel directions. Since measurements of the electron density and the electron flux at lower energy bands are greatly affected by the instrumental restrictions, we assume that the electron density is equal to the proton density, and that the electron flux data below 18 eV are not used (see Section 5). Moreover, in order to facilitate the statistical work, we reconstruct the energy bands at fixed energy for all events; and to avoid the frequently occurring invalid data, we do not use the data provided by the EESA-H and PESA-L experiments. Finally, the electron flux from 18 eV to 500 keV (EESA-L: 18, 27, 42, 65, 103, 165, 265, 427, 689 eV; SST-F: 27, 40, 66, 108, 183, 307, 512 keV) and the proton flux from 4 keV to 4 MeV (PESA-H: 4, 6, 9, 11, 15, 21, 28 keV; SST-MO: 74, 128, 197, 333, 552, 1018, 2074, 4440 keV) will be analyzed.
The BL events are identified according to the BL concept and identification criteria (Wei et al. 2003b). The physical characteristics of the tail BL are quite different from the front BL (Wei et al. 2003b, 2003c; Zuo et al. 2007), and this paper only focuses on the flux variations in the front BL detected from 1995 to 2006 (41 events are listed in Table 1). The interplanetary RE events are chosen from the list provided by Huttunen et al. (2007). Since the time resolution of the EESA and PESA is ∼98 s, the RE events with too short durations (<98 s) are excluded (24 events are listed in Table 2). The MC-driven shock events are selected based on the work of Feng et al. (2010). We use the following criteria to select shock events as ''MC-driven'' events (23 events are listed in Table 3): (1) the angle θ between the axe of the MC, adopted by fitting the constant α force-free model to the magnetic fields (Feng et al. 2010), and its leading shock normal is in the range from 65° to 115°; and (2) the interval between the shock and the beginning of the MC is less than 14 hr.
Table 1. Typical Magnetic Cloud Boundary Layers Observed by Wind
| No.a | Dateb | Startc | Durd | ΔBte | |ΔVp|f | ΔNpg | ΔTeh | ΔTpi |
|---|---|---|---|---|---|---|---|---|
| 1 | 19950208 | 0252 | 31 | −8.09 | 6.58 | 17.31 | −4.57 | −4.28 |
| 2 | 19950403 | 0629 | 75 | −12.91 | 1.70 | 40.91 | 0.22 | 19.85 |
| 3 | 19950822 | 2036 | 61 | −3.76 | 1.53 | 10.24 | −2.40 | 5.61 |
| 4 | 19951018 | 1820 | 41 | −22.24 | 2.38 | 4.15 | −0.62 | 1.94 |
| 5 | 19960527 | 1210 | 152 | −21.89 | 2.09 | 93.15 | −3.45 | 7.16 |
| 6 | 19960701 | 1546 | 100 | −17.55 | 9.92 | 4.22 | −1.03 | −0.47 |
| 7 | 19970411 | 0524 | 30 | 8.21 | 0.36 | −8.47 | −2.69 | 21.94 |
| 8 | 19970421 | 1152 | 13 | −30.56 | 2.36 | 7.40 | −2.37 | 12.08 |
| 9 | 19970515 | 0732 | 139 | −16.73 | 32.64 | −22.53 | 18.07 | 154.98 |
| 10 | 19970715 | 0844 | 21 | −36.69 | 3.50 | 88.51 | 0.16 | 11.94 |
| 11 | 19970803 | 1005 | 226 | −4.81 | 12.72 | 133.46 | −16.20 | −1.53 |
| 12 | 19970918 | 0255 | 57 | −18.28 | 7.70 | 40.77 | 2.92 | 17.14 |
| 13 | 19971107 | 1438 | 59 | −1.20 | 0.45 | 21.52 | −7.61 | −0.97 |
| 14 | 19971122 | 1448 | 22 | −15.12 | 23.70 | 49.51 | 9.73 | 53.52 |
| 15 | 19980502 | 1233 | 21 | −4.18 | 5.43 | 30.12 | 1.24 | 3.71 |
| 16 | 19980624 | 1611 | 31 | −18.36 | 7.02 | 40.40 | −3.93 | −9.90 |
| 17 | 19980820 | 0450 | 263 | −34.37 | 35.43 | 104.60 | −6.23 | 21.38 |
| 18 | 19981108 | 2250 | 79 | −11.65 | 5.32 | 39.97 | 17.13 | 23.54 |
| 19 | 19990218 | 1149 | 33 | −23.58 | 23.58 | 41.22 | 26.70 | −2.38 |
| 20 | 19990809 | 0756 | 142 | −7.00 | 3.47 | 30.88 | 18.78 | −6.21 |
| 21 | 20000220 | 0155 | 193 | −39.13 | 4.08 | 55.08 | 17.96 | −27.99 |
| 22 | 20001003 | 1634 | 44 | −8.62 | 19.14 | 5.86 | 17.81 | 55.14 |
| 23 | 20010421 | 2347 | 25 | −13.83 | 1.40 | 30.07 | 10.91 | 11.76 |
| 24 | 20010710 | 1638 | 92 | −5.55 | 4.90 | −0.30 | 2.92 | 15.44 |
| 25 | 20020319 | 2127 | 131 | −18.96 | 5.86 | 2.80 | 4.54 | 42.80 |
| 26 | 20020324 | 0305 | 14 | −21.83 | 4.72 | 123.21 | 23.79 | 32.09 |
| 27 | 20020418 | 0419 | 20 | −19.89 | 17.98 | 17.93 | 4.49 | 61.71 |
| 28 | 20020519 | 0246 | 34 | −33.36 | 14.79 | 43.60 | 12.33 | 5.87 |
| 29 | 20020801 | 1119 | 26 | −22.67 | 9.31 | 48.73 | 25.64 | 23.08 |
| 30 | 20020802 | 0604 | 71 | −6.07 | 1.46 | 21.70 | 1.64 | 18.36 |
| 31 | 20020903 | 0250 | 71 | 4.21 | 9.44 | 33.34 | 18.89 | −7.48 |
| 32 | 20040404 | 0205 | 18 | −18.46 | 33.65 | 191.12 | 1.19 | 62.40 |
| 33 | 20040722 | 1258 | 56 | −28.26 | 27.65 | 36.16 | 15.41 | −14.50 |
| 34 | 20040724 | 1129 | 27 | −9.27 | 12.78 | −10.59 | −5.54 | 10.99 |
| 35 | 20040829 | 1830 | 28 | −18.18 | 33.78 | 0.17 | −1.02 | 0.54 |
| 36 | 20041109 | 1937 | 53 | −41.59 | 5.98 | 68.43 | 20.51 | 13.83 |
| 37 | 20050520 | 0604 | 42 | −17.01 | 2.46 | 29.97 | −7.81 | 14.32 |
| 38 | 20050612 | 1441 | 21 | −44.36 | 81.13 | 54.60 | −2.16 | 10.77 |
| 39 | 20051231 | 1233 | 76 | −37.93 | 6.83 | 187.31 | 16.98 | 7.20 |
| 40 | 20060205 | 1759 | 63 | 3.36 | 0.57 | 5.47 | −10.34 | −13.15 |
| 41 | 20060413 | 2023 | 41 | −3.65 | 8.08 | 46.47 | 5.87 | 29.96 |
| Average | 67 | −16.39 | 12.05 | 42.89 | 5.31 | 16.64 |
Notes. The obtained changes of local plasma and magnetic parameters are similar to the flux variations described in Section 2. They have the same time ranges as flux variations for each event. (Changes of BL: BL to upstream solar wind; changes of RE: RE to upstream solar wind; changes of shock: downstream to upstream solar wind). aEvent number. bThe date of event, formatted as YearMonthDay. cThe beginning time of the event, formatted as HourMinute (UT). dEvent duration (minute). eThe change of total magnetic field (%). fThe absolute difference of proton velocity (km s−1). gThe change proton of density (%). hThe change of electron temperature (%). iThe change of proton temperature (%).
Download table as: ASCIITypeset image
Table 2. Selected Solar Wind Reconnection Exhausts Observed by Wind
| No.a | Dateb | Startc | Durd | ΔBte | |ΔVp|f | ΔNpg | ΔTeh | ΔTpi |
|---|---|---|---|---|---|---|---|---|
| 1 | 19971116 | 164250 | 220 | −38.96 | 11.13 | 157.35 | 30.76 | 96.31 |
| 2 | 19980416 | 005434 | 198 | 2.27 | 17.01 | −26.45 | 2.55 | 96.76 |
| 3 | 19980821 | 202036 | 240 | −22.31 | 9.24 | 37.94 | 16.54 | 82.14 |
| 4 | 19980917 | 033315 | 109 | −14.52 | 16.27 | 28.77 | −0.15 | 29.06 |
| 5 | 19990218 | 102624 | 218 | −23.31 | 56.20 | 213.91 | 63.95 | 7.90 |
| 6 | 19990615 | 143235 | 108 | −13.32 | 16.82 | 42.82 | 13.23 | 91.98 |
| 7 | 19990626 | 054600 | 550 | −25.24 | 7.95 | 29.85 | 20.53 | 2.85 |
| 8 | 19990728 | 043559 | 189 | −24.44 | 6.29 | 39.33 | 1.72 | 49.62 |
| 9 | 19990810 | 183820 | 356 | −43.70 | 2.26 | 29.98 | 15.48 | 16.78 |
| 10 | 19990919 | 091004 | 266 | −30.09 | 20.71 | 24.34 | 1.90 | 5.43 |
| 11 | 20000419 | 035916 | 194 | −39.35 | 18.40 | 15.77 | 10.10 | 13.30 |
| 12 | 20010617 | 163023 | 157 | −19.27 | 38.24 | 48.55 | 16.36 | 1.74 |
| 13 | 20020202 | 035725 | 260 | −32.48 | 49.74 | 65.86 | 28.72 | 54.89 |
| 14 | 20020419 | 004130 | 300 | −9.55 | 36.29 | −14.35 | −3.54 | 10.59 |
| 15 | 20020628 | 152632 | 333 | −9.36 | 14.23 | 22.16 | 5.92 | −11.21 |
| 16 | 20030302 | 210955 | 107 | −32.84 | 11.52 | 6.96 | 4.90 | 27.66 |
| 17 | 20040724 | 115110 | 235 | 7.41 | 62.34 | 5.42 | 0.87 | 45.34 |
| 18 | 20040826 | 092250 | 175 | −12.69 | 11.46 | −1.11 | −3.96 | 32.22 |
| 19 | 20040914 | 212651 | 121 | −20.80 | 60.91 | 36.30 | 12.67 | −15.88 |
| 20 | 20040919 | 064100 | 670 | −4.55 | 12.89 | 76.63 | 9.34 | 5.24 |
| 21 | 20041008 | 070545 | 130 | −3.13 | 13.19 | 13.88 | −1.56 | 6.86 |
| 22 | 20041011 | 152342 | 134 | −18.82 | 16.04 | −3.39 | 4.06 | −2.68 |
| 23 | 20041029 | 024531 | 119 | −38.80 | 9.63 | 0.77 | 0.98 | 1.80 |
| 24 | 20041206 | 022056 | 115 | −14.50 | 0.16 | 2.70 | 1.95 | 2.33 |
| Average | 229 | −20.09 | 21.65 | 35.58 | 10.56 | 27.13 |
Notes. The obtained changes of local plasma and magnetic parameters are similar to the flux variations described in Section 2. They have the same time ranges as flux variations for each event. (Changes of BL: BL to upstream solar wind; changes of RE: RE to upstream solar wind; changes of shock: downstream to upstream solar wind). aEvent number. bThe date of event, formatted as YearMonthDay. cThe beginning time of the event, formatted as HourMinuteSecond (UT). dEvent duration (second). eThe change of total magnetic field (%). fThe absolute difference of proton velocity (km s−1). gThe change proton of density (%). hThe change of electron temperature (%). iThe change of proton temperature (%).
Download table as: ASCIITypeset image
Table 3. Selected Leading Shocks Ahead of Magnetic Cloud Observed by Wind
| No.a | Dateb | Startc | ΔBtd | |ΔVp|e | ΔNpf | ΔTeg | ΔTph |
|---|---|---|---|---|---|---|---|
| 1 | 19950822 | 1256 | 85.45 | 42.38 | 197.09 | 14.06 | 99.64 |
| 2 | 19970109 | 0052 | 208.79 | 28.07 | 118.19 | 2.41 | 139.35 |
| 3 | 19970515 | 0115 | 150.20 | 74.66 | 89.82 | 53.27 | 103.76 |
| 4 | 19970715 | 0215 | 19.50 | 9.90 | 63.46 | 10.77 | 22.35 |
| 5 | 19971010 | 1557 | 64.41 | 24.90 | 62.48 | 4.70 | 27.70 |
| 6 | 19971122 | 0912 | 198.94 | 98.79 | 144.61 | 75.63 | 168.50 |
| 7 | 19980304 | 1102 | 84.05 | 41.99 | 70.94 | 41.41 | 40.19 |
| 8 | 19981018 | 1929 | 128.17 | 30.16 | 89.00 | 19.93 | 57.42 |
| 9 | 20000811 | 1849 | 106.38 | 113.98 | 90.60 | 56.96 | 154.63 |
| 10 | 20010319 | 1133 | 107.18 | 47.99 | 67.30 | 70.81 | 60.64 |
| 11 | 20010404 | 1441 | 59.08 | 211.11 | 146.90 | 123.27 | 327.35 |
| 12 | 20010421 | 1529 | 80.23 | 27.70 | 115.75 | 60.64 | 60.14 |
| 13 | 20011031 | 1347 | 64.20 | 68.53 | 210.07 | 54.84 | 301.31 |
| 14 | 20011124 | 0454 | 86.78 | 75.84 | 33.69 | 29.39 | 46.66 |
| 15 | 20020518 | 1946 | 158.76 | 160.83 | 202.78 | 240.26 | 259.96 |
| 16 | 20020801 | 0519 | 57.15 | 100.17 | 129.64 | 34.11 | 296.22 |
| 17 | 20040724 | 0531 | 140.13 | 68.46 | 168.05 | 192.04 | 267.61 |
| 18 | 20041107 | 1759 | 123.46 | 160.31 | 142.38 | 90.91 | 89.20 |
| 19 | 20050515 | 0210 | 484.94 | 298.62 | 358.26 | 469.96 | 803.67 |
| 20 | 20050612 | 0648 | 379.41 | 37.37 | 30.07 | 59.08 | 48.23 |
| 21 | 20050614 | 1756 | 253.53 | 82.10 | 78.87 | 107.21 | 213.60 |
| 22 | 20060413 | 1121 | 113.57 | 35.12 | 57.57 | 45.34 | 79.13 |
| 23 | 20071119 | 1722 | 82.14 | 34.85 | 142.13 | 49.76 | 42.87 |
| Average | 140.72 | 81.47 | 122.16 | 82.90 | 161.31 |
Notes. The obtained changes of local plasma and magnetic parameters are similar to the flux variations described in Section 2. They have the same time ranges as flux variations for each event. (Changes of BL: BL to upstream solar wind; changes of RE: RE to upstream solar wind; changes of shock: downstream to upstream solar wind). aEvent number. bThe date of event, formatted as YearMonthDay. cThe beginning time of the event, formatted as HourMinute (UT). dThe change of total magnetic field (%). eThe absolute difference of proton velocity (km s−1). fThe change proton of density (%). gThe change of electron temperature (%). hThe change of proton temperature (%).
Download table as: ASCIITypeset image
During the statistical work, we quantify the flux variations in the form of ΔF = (F2 − F1)/F1 at each energy band and direction for each event. In the case of the BL events, F2 is the mean flux inside the BL and F1 is the mean flux of the nearby upstream solar wind with a 30 minute duration. For RE, F2 is the mean flux inside the RE and F1 is mean flux of the nearby upstream solar wind with the same duration of the RE. For the shock, F1 and F2 are the mean flux of upstream and downstream solar wind, respectively, with 12 minute and 3 minute durations away from the shock discontinuity. The possible influences of our selection criteria and sample method on the final results of flux variations will be discussed in the last section.
3. STATISTICAL RESULTS
The local magnetic field and plasma parameters of the three types of events (BLs, REs, and shocks) are listed in Tables 1, 2, and 3. It is found that the magnetic field decreases (ΔBt ∼ −16.4%) in most of the BL events and plasma is usually compressed (ΔNp ∼ 42.9%) and heated (ΔTe ∼ 5.3%, ΔTp ∼ 16.6%). These phenomena resemble those in previous work (Wei et al. 2003b, 2006) on BL events, and they are quite similar to the RE events despite the somewhat larger temperature increment (ΔBt, ΔNp, ΔTe, and ΔTp ∼ −20.1%, 35.8%, 10.6%, and 27.1%, respectively). The average duration of the BLs (Δt ∼ 67 minutes) is ∼18 times longer than that of the REs (Δt ∼ 229 s), and the absolute difference of proton velocity in the REs (ΔVp ∼ 21.7 km s−1) is larger than that in the BLs (ΔVp ∼ 12.1 km s−1). The MC-driven shocks are usually fast forward shocks across which the magnetic field, proton and electron temperature, and plasma speed always highly increase (the average changes of ΔBt, ΔNp, ΔTe, ΔTp, and ΔVp are ∼140.7%, 122.2%, 82.9%, 161.3%, and 81.5 km s−1, respectively). We also note that there are few strong MC-driven shocks. The obtained density compression ratio of the shock is in the range of 1.3–4.6, with a mean value of only 2.2.
Figure 2 presents the electron flux variation ΔF averaged over all of the events in the parallel, anti-parallel, perpendicular directions as well as the omni proton flux variation, also averaged over all events. The flux variations (flux decrease or increase) depend both on the direction and the energy. Inside the BL, the core electron flux in the parallel, anti-parallel, and perpendicular directions increases consistently and the increment amplitude decreases with energy monotonously from ∼30% (at 18 eV) to ∼10% (at 70 eV); the increments of suprathermal electron (100–700 eV) in the parallel and antiparallel directions are very small (<4%), but it is noted that their standard errors are obviously large; the energetic electron (>100 keV) also has slight increments in the perpendicular direction; the increments of the proton omni flux fall at higher energy bands but they have a prominence around 70 keV. In the RE, although the energetic electron in the parallel direction has a higher increment with a larger standard error, the flux variations have similar behaviors compared with the BL as a whole. By contrast, across the shock, flux behaviors are quite different. The electron flux variations have peak increments (>200%) around ∼100 eV and decline on both sides; we also note that they have higher increments in the perpendicular direction and the corresponding energy of the peak increment is also higher in the perpendicular direction (∼165 eV) than in the field-aligned direction (∼65 eV); the omni proton flux increments decrease monotonously from ∼280% (at 4keV) to ∼10% (at 4 MeV).

Figure 2. Normalized mean flux variations with error bars at each energy band. First row: BL; second row: RE; third row: MC-driven shock; first column: electron flux in the parallel direction; second column: electron flux in the perpendicular direction; third column: electron flux in the antiparallel direction; fourth column: proton flux in the omni-direction.
Download figure:
Standard image High-resolution imageDuring the statistical work, it is also found that the correlations of the electron flux variations in parallel and antiparallel directions have a sharp change around 70 eV where solar wind magnetic reconnection occurs. Figure 3 provides the correlation coefficients of electron flux variations in the parallel and antiparallel directions. In all events, the core electron has (strong) positive correlations (BL and RE: r > 0.8; shock: r > 0.6), while the suprathermal electron in the BL and RE has very low or negative correlations (BL: r ∼ 0; RE: r ∼ −0.2); in addition, the correlations are even lower across (downstream to upstream) the RE (r ∼ −0.4), however, no obvious changes are found across the shock, which always has high correlation around 0.8.
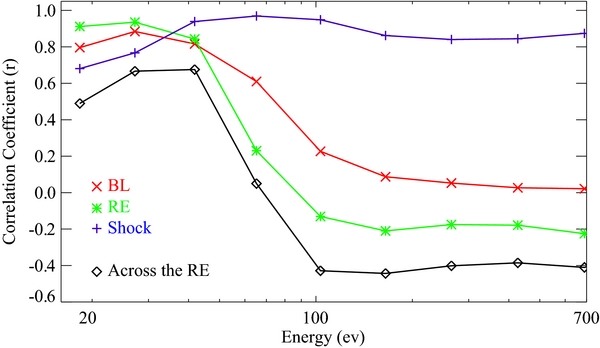
Figure 3. Correlation coefficients of electron increments in the parallel and anti-parallel directions. In the BL: red; in the RE: green; across the MC-driven shock: blue; and across the RE: black.
Download figure:
Standard image High-resolution image4. EXPLANATIONS FOR FLUX VARIATIONS
Since the compressing and heating effects are quite common inside the BL and RE, and across the shock, these effects could account for the presented core electron flux variations. The zero-order moment of the VDF is equal to the mass density. Accordingly, if the VDF has a Maxwellian distribution, the density will behave essentially the same as the flux. In particular, the lower the flux energy is, the more similar behaviors the density and flux will have. As seen in Figure 4, the isotropic increments of electron flux at 15–41 eV vary consistently with the density changes in the BL. The final increments of the electron flux at 18eV are also roughly consistent with the average density increments (listed in Table 1) and previous statistical results (Wei et al. 2006). Therefore, the enhancement of the core electron flux with high correlation in all three directions could be related to the density increase in the compressed BLs. The core electron flux variation in the REs is similar to the BLs, however, it behaves totally different across the MC-driven shocks. The electron flux increments ascend first and then descend with peak values near ∼65 eV and ∼165 eV in the field-aligned and perpendicular directions, respectively. Such flux behaviors could not merely be caused by the density increase, and the increments are also inconsistent with the average density increments. We note that the increase of electron temperature across the shock is much higher than that in the BL and RE. Since the ''moment temperature'' (Burlaga 1995) is calculated from the second-order moment of the VDF, we speculate that the increments of electron flux with hill-like shape are mainly dominated by the heating effect of the shock. This result is consistent with previous observations that show that the inflated electron VDF caused by heating in both the parallel and perpendicular directions is always found downstream of the shock (Fitzenreiter et al. 2003). In addition, according to early research, for weaker shocks, the electron heating was primarily perpendicular to the magnetic field due to the conservation of magnetic moment (Feldman et al. 1983). The present statistical results with higher flux increments in the perpendicular directions could also be supported by such explanations, since many of our selected MC-driven shocks have relatively small density compression ratios.
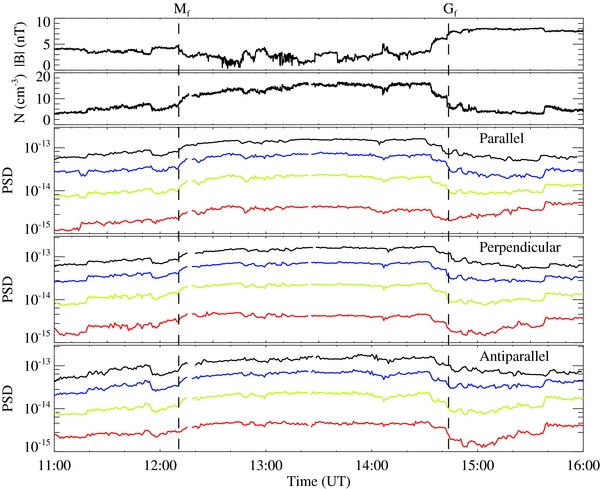
Figure 4. Plasma and magnetic field conditions near a BL on 1996 May 27 (marked by Mf and Gf, dashed lines). From top to bottom: the magnitude of magnetic field, electron density, electron flux in parallel, perpendicular, and antiparallel directions. The color lines represent different energy bands at 15 eV (black), 21 eV (blue), 29 eV (yellow), and 41 eV (red), respectively.
Download figure:
Standard image High-resolution imageAs described in Section 1 and references therein, the presence of bidirectional and unidirectional electrons, and the absence of Strahl electrons, could reflect the configurations of closed, open, and disconnected magnetic field lines from the Sun, respectively (Gosling et al. 1987, 2005c; Larson et al. 1997). Although previous works have speculated upon their dependences and analyzed their behaviors in reconnection (Gosling et al. 2005c; McComas et al. 1989), there is not a sufficiently direct relevance established between the electron flux variations and the solar wind magnetic reconnection. In our statistical work, we find that the suprathermal electron (100–700 eV) flux displays low or even negative correlation between the parallel and antiparallel directions when a spacecraft crosses the RE. Here we would like to explain why these features are related to the solar wind reconnection in some detail. As sketched in Figure 5, taking the Strahl electron as an ideal case, for instance, the intensity of flux is simply normalized by only two arbitrary quantities: 100 (obvious Strahl electron) and 10 (no obvious Strahl electron). The flux status is described by [F0, F180], where F0 and F180 stand for the flux of Strahl electrons in the parallel and antiparallel directions, respectively. Accordingly, the status of bidirectional Strahl electrons, unidirectional Strahl electrons in the parallel and antiparallel directions, and no obvious Strahl electrons could be described by [100, 100], [100, 10], [10, 100], and [10, 10] respectively. In case I, the spacecraft would detect decreased and unchanged Strahl electrons in the parallel and antiparallel directions, respectively, inside the RE, and the increments are [−90, 0] ([10, 10] − [100, 10]). Similarly, the increments in cases II, III, and IV are [0, 90], [0, −90], and [90, 0] respectively. Therefore, in statistical analyses, the correlations of the Strahl electron flux variations in parallel and antiparallel directions should be low if the spacecraft encounters the four above cases randomly. Mathematically speaking, both the correlation coefficient and the averaged increments should approach zero. Moreover, across the RE, the increments become [−90, 90] in cases I and II, and [90, −90] in cases III and IV. We could see that they always reveal anti-correlated relations in the parallel and antiparallel directions. Accordingly, the theoretically computed correlation coefficient is even lower (should be −1) in the statistical work. Certainly, our assumptions are relatively simple; for example, the real flux intensity could not be only two quantities (100 and 10), and thus the finally obtained correlation coefficients and mean flux increments might not be as ideal as in the analyses. However, the flux variations of suprathermal electrons still reveal the properties that the mean increments approach 0 with large standard errors and the correlation coefficients are low (∼−0.2) and lower (∼−0.4) in and across the REs. Other effects, such as particle scattering, could also modify the flux of electrons. If so, it should be explained why the correlation of core electrons is always higher than the suprathermal electrons, and why the correlation coefficients change sharply around ∼70 eV. Perhaps the correlation coefficients should change more smoothly if the scattering process plays a dominant role. In addition, since these RE events are not magnetically connected to Earth's bow shock (Huttunen et al. 2007), the obtained results would not be greatly affected by particle reflection either. Moreover, the correlation coefficients across the MC-driven shock, in which there is no obvious break or reverse of magnetic field lines, are always high (∼0.7–0.9). For these reasons, we tend to regard the solar wind magnetic reconnection as the best candidate process that could account for the statistically obtained low or negative correlations of suprathermal electron increments in the parallel and anti-parallel directions.

Figure 5. Schematic plot of magnetic field disconnection (possible reconnection) of four cases and the possibly following MC.
Download figure:
Standard image High-resolution image
The energetic electron might come from the Sun directly, just as the suprathermal electron, but it should be noted that its flux variations (mean value and standard error) are somewhat different compared with the suprathermal electron. Shocks could also accelerate electrons to high energy, but early work (Potter 1981; Tsurutani & Lin 1985) shows that the shock associated accelerations of energetic electrons are weak near 1 AU. We also find that the energetic electron sometimes shows a pike or step-like increase across the shock with short durations, thus the increments are smoothed by the sample method (3 minutes away and 12 minutes average). These reasons might be responsible for the relatively slight flux increments of energetic electrons across MC-driven shock in our statistical work. Previous work (Gosling et al. 2005a) suggests the absence of energetic electrons inside the RE. However, observations (Lin & Hudson 1971; Oieroset et al. 2002) show that energetic electrons produced by magnetic reconnection do exist, and the energetic electrons could also be found inside the BL (Wang et al. 2010). As pointed out by Wang et al. (2010), the MC driving reconnection would prefer to generate complex structures (e.g., diverse magnetic islands) rather than form a single X line in the reconnection region under real solar wind conditions. These seemingly irregular structures could probably play an important role in the generation of energetic electrons (Ambrosiano et al. 1988; Drake et al. 2006; Goldstein et al. 1986; Matthaeus et al. 1984; Wang et al. 2010). Actually, for 6 out of 24 RE events and 6 out of 41 BL events, the omni flux increments of ∼512 keV electrons exceed 30%. Therefore, the energetic electrons might be shock associated or come from the Sun directly, and they could also be generated by reconnection. However, as analyzed above, the energetic electrons accelerated by reconnection seems to be a more reasonable cause for the flux increments inside the REs and BLs.
5. DISCUSSION AND SUMMARY
The data provided by the PESA-L and PESA-H detectors have many gaps and the energy bands are time varying. Due to the lack of reliable and detailed data, it is hard to explain proton flux variations comprehensively or draw a conclusion definitely by only using the omni-directional data above 4 keV. We still note that the final statistical result of protons in the BL is similar to the previous single-event observation (Wang et al. 2010) in which a flux peak around 70 keV was also found. Since the proton flux increment (∼280%) across the MC-driven shock at 4 keV is higher than both the density and temperature increments (∼122% and 161%, respectively), it is speculated that the proton VDF around 4 keV might also be as inflated as that of the electron near ∼70 eV across the shock.
The electron flux data at low energy bands should be calibrated before use. However, the technical calibrations such as assuming a Gaussian fitted VDF and estimating the spacecraft potential are troublesome. The accuracy is not well guaranteed either. So we do not process the electron flux data below 18 eV. Actually, the electron flux data at these low energy bands seem not to affect the main conclusions of the paper and neither does the electron flux data provided by EESA-H (1–20 keV). Besides, the electron density in the solar wind could also be calibrated by searching for a bright ''plasma line'' in the frequency spectrogram of the wave. It is found that the difference between the proton density and the calibrated electron density in our statistical work is very small, so the proton density is used to replace the electron density.
As mentioned above, the presented sample method, by choosing the mean flux in the specified time range, might have some smoothing effect on the flux variations. Actually, we also adopted other sample methods, such as applying the maximum flux in the same time range to all the events. Although we got more unsmooth results, the main features also resemble the results presented here. We also try to change the criteria of the ''MC-driving'' shocks, and we find that the main conclusions of the paper are not changed either, despite that the angle between the axe of the MC and the shock normal and the interval between the shock and the beginning of the MC would affect the final increments to some extent.
Magnetic field decrease, and density and temperature increase, are similar in the RE and BL, and similar flux variation behaviors are found between these two structures. Hence, we suggest that the flux variations in the BL are mainly related to the magnetic reconnection process. However, as preliminarily discussed in Section 1, some researchers pointed out that the roughly Alfvénic accelerated plasma flows—the ''direct evidence'' (Gosling 2011; Gosling et al. 2005b)—are rarely identified inside the front BL (except two events: 20001003 and 20040724). At first, it should be recognized that no roughly Alfvénic accelerated plasma flows does not mean no magnetic reconnection, since the reconnection jets might not be measured or the generated jets might not meet the referred criteria. Previous simulations (Wang et al. 2010; Wei et al. 2003a, 2006) imply that the BL has a strong turbulent property under high magnetic Reynolds number conditions (Rm ∼ 104), while, as also suggested by Matthaeus et al. (2003), turbulence should commonly drive reconnection in the solar wind. Inside the BL, the compression of the MC behaves like driving flows which would reduce the characteristic thickness of the local current sheet from ∼108 km (in the corona) to ∼103 km (in the solar wind). Accordingly, the magnetic Reynolds number could decrease from ∼1010 to ∼104. Besides, the magnetic field inside the BL always shows abrupt deflections in the field direction. If the frozen field theorem is locally broken, then these conditions are all favored by the potential magnetic reconnection (Wei et al. 2006). Actually, in many cases, the BL is a complex layer with turbulent and irregular structures; besides, the trajectory of the spacecraft relative to the orientation of RE is not always suitable for the observation. So roughly Alfvénic accelerated plasma flows that completely meet the reconnection criteria as those reported events might be hard to identify (Gosling et al. 2005b; Huttunen et al. 2007; Phan et al. 2006; Tian et al. 2010; Wang et al. 2010; Xu et al. 2011). In addition, the referred criteria, especially the jets (Gosling 2011; Gosling et al. 2005b; Paschmann et al. 1986; Sonnerup & Cahill 1967), are described as ''a useful guide'' (Sonnerup et al. 1981) for the identification of reconnection, and have made wonderful achievements in the realm of magnetic reconnection, yet we should still be cautious to use such criteria because they are obtained under the MHD descriptions with the assumption of the ideal reconnection model. Remarkably, it is pointed out (Sonnerup et al. 1981) that such criteria have never been demonstrated to be ''incontrovertible.'' Recent simulations also show that the outflowing reconnection jets could even turn back and link with the inflows to form closed-circulation patterns in turbulent reconnection (Lapenta 2008). Accordingly, reconnection generated plasma flows might not strictly meet the referred criteria in real three-dimensional space. Therefore, it is quite possible that many reconnections inside the BL do occur and that the reconnection jets are indeed measured. However, they are excluded by the criteria so that many researchers think there is no reconnection. We do not want to discuss the reconnection criteria further since it is beyond the scope of this paper. Other factors should also be taken into consideration carefully, such as the lifespan and the evolution of the reconnection itself. As studied previously (Wei et al. 2003a, 2003b), the magnetic reconnection might not be an ongoing process all of the time. After the reconnection occurs, the reconnection conditions would be weakened and the frozen-in condition would be gradually recovered until the local condition is ready for the next potential magnetic reconnection. Since this process might continue to repeat itself, a single spacecraft crossing the BL might observe the ''remains'' or the ''preorder'' of magnetic reconnection. For these reasons, the signatures of reconnection, such as the Alfvénic accelerated flows (Gosling et al. 2005b; Huttunen et al. 2007; Phan et al. 2006; Tian et al. 2010; Wang et al. 2010; Xu et al. 2011), might not be prominent enough to be identified sometimes. However, we have reason to believe that the electron flux variations would not be affected and could reflect the field topological structure of the magnetic reconnection event to a certain extent.
In summary, we carry out a statistical study analyzing the proton and electron flux variations inside BL events on reliable energy bands and compare them with those in the RE and across the MC-driven shocks. The results show that the BL is a unique complicated transition layer that displays some reconnection characteristics. The core electron flux behaviors inside the BL and RE are related to the density increase. The hill-like electron flux increments across the shock are mainly dominated by the temperature increase. It is also found that the correlations of the electron flux variations in parallel and antiparallel directions have a sharp change around ∼70 eV where solar wind magnetic reconnection occurs. The correlation coefficients of the suprathermal electron in the parallel and antiparallel directions are found to be low. Further analyses imply that strong energy dependence and direction selectivity of flux variations could be regarded as an important signature of solar wind reconnection in the statistical point of view.
This work is jointly supported by the National Natural Science Foundation of China (40890162, 40904049, 40921063, and 41031066), 973 program 2012CB825601 and the Specialized Research Fund for State Key Laboratories. We thank NASA CDAWEB and the Space Sciences Laboratory at UC Berkeley for providing the Wind 3DP and MFI data. Y. Wang thanks T. R. Sun, H. Tian, and H. Q. Feng for their helpful discussions.