


ABSTRACT
We investigated the optical light curve of T Pyx during its 2011 outburst by compiling a database of Solar Mass Ejection Imager (SMEI) and AAVSO observations. The SMEI light curve, providing unprecedented detail covering t = 1.5–49 days post-discovery, was divided into four phases based on the idealized nova optical light curve: the initial rise (1.5–3.3 days), the pre-maximum halt (3.3–13.3 days), the final rise (14.7–27.9 days), and the early decline (27.9+ days). The SMEI light curve contains a strongly detected period of 1.44 ± 0.05 days during the pre-maximum halt phase. These oscillations resemble those found in recent thermonuclear runaway models arising from instabilities in the expanding envelope. No spectral variations that mirror the light curve periodicity were found, however. The marked dip at t ∼ 22–24 days just before the light curve maximum at t = 27.9 days may represent the same (shorter duration) phenomenon seen in other novae observed by SMEI and present in some model light curves. The spectra from the 2 m Liverpool Telescope and SMARTS 1.5 m telescope were obtained from t = 0.8–80.7 and 155.1–249.9 days, covering the major phases of development. The nova was observed very early in its rise where a distinct high-velocity ejection phase was evident with initially derived Vej ∼ 4000 km s−1. A marked drop occurred at t = 5.7 days, and then a gradual increase in derived Vej to stabilize at ∼1500 km s−1 at the pre-maximum halt. Here, we propose two different stages of mass loss, a short-lived phase occurring immediately after outburst and lasting ∼6 days, followed by a more steadily evolving and higher mass loss phase. The overall spectral development follows that typical of a classical nova and comparison with the photometric behavior reveals consistencies with the simple evolving pseudo-photosphere model of the nova outburst. Comparing optical spectra to X-ray and radio light curves, weak [Fe x] 6375 Å emission was marginally detected before the X-ray rise and was clearly present during the brightest phase of X-ray emission. If the onset of the X-ray phase and the start of the final decline in the optical are related to the cessation of significant mass loss, then this occurred at t ∼ 90–110 days.
Export citation and abstract BibTeX RIS
1. INTRODUCTION
Classical novae (CNe) are interacting binary systems whose outbursts are powered by a thermonuclear runaway (TNR) in accreted material on the surface of a white dwarf (WD). The secondary stars in such systems fill their Roche lobe and material is transferred onto the WD primary star via an accretion disk (Starrfield et al. 2008). Recurrent novae (RNe) are, by definition, CNe with multiple recorded outbursts and most contain evolved secondaries (Darnley et al. 2012). There are 10 known Galactic RNe: T Pyx, IM Nor, CI Aql, V2487 Oph, U Sco, V394 CrA, T CrB, RS Oph, V745 Sco, and V3890 Sgr, given here in order of increasing orbital period (Schaefer 2010; although the period of V2487 Oph is only approximately known). T Pyx (α = 9h4m41 50, δ = −32°22'47
 5) has the shortest known orbital period (∼0
 076 or 1
 824) of any RN (see Anupama 2008, for a review) and the only RN that is below the cataclysmic variable (CV) period gap (Schaefer et al. 1992; Patterson et al. 1998; Uthas et al. 2010).
T Pyx has had previous observed outbursts in 1890, 1902, 1920, 1944, 1966/1967, and now 2011, with an extensive shell of ejected gas associated with each. The photometric and spectroscopic characteristics of the first outbursts were briefly presented in Payne-Gaposchkin (1957), while the 1966 event was discussed post-outburst by Catchpole (1969) and Landolt (1970). All the outbursts have exhibited brightness fluctuations near the optical peak and the subsequent declines have been slow. The ejection velocity observed previously was ∼2000 km s−1 in 1967 (Catchpole 1969; Williams 1982) with t3 = 63 days (Schaefer 2010). The distance has been revised most recently by Shore et al. (2011) to be ⩾4.5 kpc, with a strict lower limit of 3.5 kpc which was the previously accepted value. Taking Mbol = −7.0 given by Schaefer (2010) gives Lbol ∼ 2 × 1038 erg s−1 at maximum light (∼Ledd for a 1 M☉ WD).
T Pyx is unique for having an outburst light curve plateau in the decline stage, which is different from the five other RNe (IM Nor, CI Aql, V2487 Oph, U Sco, and RS Oph) with observed (so-called "true") plateaus in their light curves. While the latter true plateaus are believed to be the result of the combination of the irradiation of the disk (by the supersoft emission from nuclear burning near the WD after the wind associated with the ejecta has stopped) and the steady light decline from the shell which leads to a flattening of the light curve until the nuclear burning turns off; the plateau in T Pyx is thought to arise from a different mechanism including the emission lines increasing in brightness (Hachisu et al. 2000). Unlike true plateaus that have the flat portion starting during an apparently final decline, T Pyx's plateau starts immediately after a sharp drop (∼2.0 mag in 20 days after peak) and starts again in the final decline (∼105 days after peak). This feature, of a plateau starting after a sharp drop, is also present in RS Oph; however, the presence of a Super Soft X-ray Source (SSS) and the lack of color changes during the plateau phase in RS Oph indicates a true plateau (Hachisu et al. 2008). On the other hand, the shape of T Pyx's plateau in B- and V-band light curves is significantly different (Schaefer 2010).
In CNe, the mass of the WD (MWD) is typically around 1 M☉ (Uthas et al. 2010). For an RN, in order for the TNR to occur on a short timescale, the WD has to be more massive (i.e., MWD ≳ 1 M☉) and luminous with high  (Starrfield 2008), implying that the secondary star has to be evolved. As a result of the unusually high
  , T Pyx is more luminous than CNe at quiescence, when the Roche lobe filling main-sequence donor star is transferring mass onto a high-mass WD. Unfortunately, MWD is not accurately known for this system.
Based on optical spectroscopy obtained at the Very Large Telescope and the Magellan Telescope, Uthas et al. (2010) estimated a mass ratio q = 0.2 ± 0.03. Thus, with the mass of the secondary star M2 = 0.14 ± 0.03 M☉ derived from the main-sequence mass–radius relation of a 5 Gyr isochrone given by Baraffe et al. (1998), the mass of the primary WD is MWD = 0.7 ± 0.2 M☉. This estimate of MWD is lower than that expected from previous theoretical studies, which range from 1.30–1.37 M☉ (Kato 1990), 1.25–1.30 M☉ (Schaefer et al. 2010), and 1.25–1.4 M☉ (Selvelli et al. 2010). Therefore, Uthas et al. (2010) turned the problem around by mentioning that if MWD > 1 M☉, then M2 > 0.2 M☉ for their estimated q = 0.2 mass ratio.
The orbital period at quiescence, P = 0076, is well established (Patterson et al. 1998; Schaefer et al. 1992; Uthas et al. 2010) with an increasing period  (Patterson et al. 1998). The light curve had a highly significant modulation in the 1966 eruption with a period of 0.099096 days found by Schaefer (1990). Other transient periodicities at 0.1098 days and 1.24 days were found by Patterson et al. (1998) in quiescence. Patterson et al. (1998) suggested that the 1.24 day period might arise from precession in the accretion disk, as it is roughly in the range of that in CVs while there is no explanation for the 0.1098 day period.
The orbital inclination, i, is thought to be low from the spectral profiles and low radial velocity amplitude (Uthas et al. 2010). It has been estimated to be ∼6° (Shahbaz et al. 1997), 10°–20° (Patterson et al. 1998), 20°–30° (Selvelli et al. 2010), i = 10° ± 2° (Uthas et al. 2010), and recently i = 15° (Chesneau et al. 2011). Such a fairly low inclination is suggested to be the cause of the long dip, which lasts for half of the orbit in the flat top light curve, due to the heating effect on the companion star (Patterson et al. 1998).
T Pyx is the only RN that presents a persistent nova shell. It has a radius of ∼5'', which was discovered by Duerbeck & Seitter (1979). A fainter outer halo around the shell discovered by Shara et al. (1997) expands to a radius of ∼10''. The shell has been found to be slowly expanding with thousands of discrete knots (Duerbeck & Seitter 1979; Williams 1982; Shara et al. 1997) and is suggested to be a result of the shocks from the new eruption ejecta that interact with the ejecta from the previous eruption (Contini & Prialnik 1997).
The outburst of T Pyx in 2011 was discovered by AAVSO observer M. Linnolt at a visual magnitude of 13.0 on 2011 April 14.29 UT (JD 2455665.7931, hereafter t = 0 day) and published in Schaefer et al. (2013). Figure 1 presents the AAVSO optical light curves of T Pyx in its 2011 outburst from before the eruption to 2012 March 31 (JD 2456018, t = 353 days).
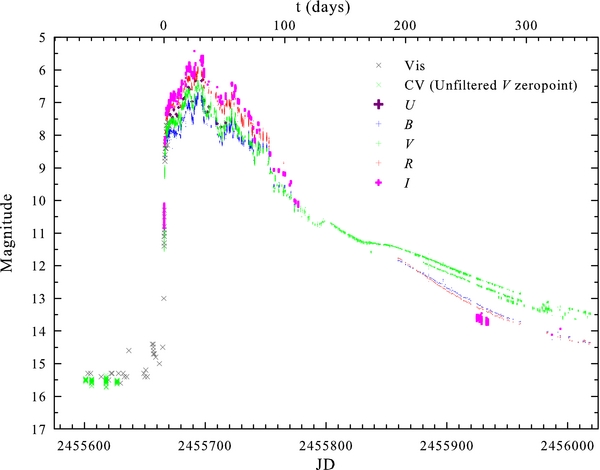
Figure 1. AAVSO optical light curves of T Pyx in its 2011 outburst.
Download figure:
Standard image High-resolution imageSchaefer et al. (2013) reported that from 2008 to 2011 March 31 (JD 2455652, t = −13.8 days) T Pyx's brightness was steady at V = 15.5 with the usual periodic variation of <0.2 mag, and it was never brighter than V = 15.0. On 2011 April 5.51 UT, it was observed with variations from V = 14.4–14.7 and continued to fade slowly until 2011 April 10.54 UT (JD 2455662.0417, t = −3.7 days). There was a short brightness increase, a so-called "pre-eruption rise" (peak around V = 14.4 mag), that occurred about 13 days prior to the initial rise (Schaefer et al. 2013). After the sharp initial rise on day t = 0, a small fading occurred roughly 2 days after that (Schaefer et al. 2013).
Patterson et al. (2013) studied the post-outburst light curve in 2011 and found that an orbital period signal appeared by t = 170 days (V = 11.2) with a period increase of 0.0054 (7)% implied to be the result of mass ejection from the WD. They derived an ejected mass of at least 3 × 10⁻⁵ M☉, similar to that in CNe.
Spectroscopic observations of the 2011 outburst are discussed in Shore et al. (2011, 2013) and in Imamura & Tanabe (2012). Shore et al. (2011) report high-resolution observations at seven epochs from t = 1.6–46.6 days and Shore et al. (2013) describe observations at a further four epochs much later in the outburst (t = 179, 180, 349, and 360 days). Imamura & Tanabe (2012) meanwhile report 11 epochs of low-resolution spectroscopy at early times (t = 2.7–30.8 days). A comparison with results of more extensive and intensive spectroscopic coverage is given below, together with high-cadence photometry.
In Section 2, we describe our extensive photometric and spectroscopic data sets. In Section 3, we use those results to explore the various phases of development of the nova, both in comparison to those found in other novae and also with models of the outburst. Periodicities in the SMEI light curve are also investigated. A comparison with extensive observations at X-ray and radio wavelengths is detailed in Section 4, and in Section 5 we present our conclusions.
2. OBSERVATIONS
2.1. Photometric Observations from SMEI
Photometric observations of T Pyx were obtained with the Solar Mass Ejection Imager (SMEI). SMEI is an all-sky white-light CCD-based camera system for observing the inner heliosphere from Earth orbit, on board the U.S. Air Force Coriolis Mission spacecraft that was launched into an 840 km Sun-synchronous terminator orbit on 2003 January 6 (Jackson et al. 2004). SMEI consists of three baffled CCD cameras each with a roughly 60° × 3° field of view. It continuously takes 4 s exposures, sweeps over nearly all of the sky every 102 minutes, and therefore provides about 1500 frames from each camera per Earth orbit (Hick et al. 2005).
SMEI is operated as a high-precision differential photometer (Buffngton et al. 2006) and can reliably detect brightness changes in point sources down to mSMEI ∼ 8 with the instrument's peak quantum efficiency at ∼700 nm and FWHM ∼ 300 nm (Hounsell et al. 2010). The SMEI real-time data pipeline produces calibrated all-sky maps in which brightness contributions from zodiacal dust and unresolved sidereal background have been subtracted. Approximately 5600 point sources brighter than mSMEI = 6 are removed individually from the composite sky maps in order to avoid compromising the photometric specification for SMEI (Hick et al. 2005). Therefore, with its high-cadence all-sky observations, SMEI can investigate bright nova explosions (mSMEI < 8) whose outbursts occurred within the time period of operation (i.e., during 2003–2011) and produce extremely detailed light curves. These caught, for example, the pre-maximum halts during the outbursts of several novae, as presented in Hounsell et al. (2010).
In this work, T Pyx was included in a supplementary star catalog, which was added to the UCSD SMEI database of Hounsell et al. (2010). The photometry was produced via the fitting of a modeled PSF (Hick et al. 2007) to the composite sky maps produced by the SMEI data pipeline. The white-light observations of T Pyx by SMEI were made from 2011 April 15.84 UT (JD 2455667.3422, t = 1.5 days) to 2011 June 2.32 UT (JD 2455714.8165, t = 49.0 days).
2.2. Spectroscopic Observations
Spectroscopic observations were obtained with the 1.5 m telescope of the Small and Moderate Aperture Research Telescope System (SMARTS) and the 2 m Liverpool Telescope (LT). A log of the observations is given in Table 1.
Table 1. Log of Optical Spectral Observations
| Observation Dates | JD | t | λ Range | Telescope | | | Observation Dates | JD | t | λ Range | Telescope |
|---|---|---|---|---|---|---|---|---|---|---|
| (days) | (Å)* | | | (days) | (Å)* | ||||||
| 2011 Apr 14 | 2455666.55056 | 0.8 | 5630–6950 | SMARTS | | | 2011 Jun 23 | 2455736.45998 | 70.7 | 3870–4544 | SMARTS |
| 2011 Apr 15 | 2455667.49308 | 1.7 | 3250–9520 | SMARTS | | | 2011 Jun 25 | 2455738.44247 | 72.6 | 3250–9520 | SMARTS |
| 2011 Apr 16 | 2455668.44853 | 2.7 | 3655–5424 | SMARTS | | | 2011 Jun 26 | 2455739.45381 | 73.7 | 3870–4544 | SMARTS |
| 2011 Apr 17 | 2455669.43890 | 3.6 | 5630–6950 | SMARTS | | | 2011 Jun 28 | 2455741.40939 | 75.6 | 3870–4544 | SMARTS |
| 2011 Apr 18 | 2455670.51676 | 4.7 | 3870–4544 | SMARTS | | | 2011 Jun 30 | 2455743.44596 | 77.7 | 3655–5424 | SMARTS |
| 2011 Apr 19 | 2455671.47293 | 5.7 | 5630–6950 | SMARTS | | | 2011 Jul 1 | 2455744.47839 | 78.7 | 3250–9520 | SMARTS |
| 2011 Apr 22 | 2455674.38198 | 8.6 | 3900–5700, 5800–9400 | LT | | | 2011 Jul 2 | 2455745.46245 | 79.7 | 3870–4544 | SMARTS |
| 2011 Apr 22* | 2455674.61188 | 8.8 | 5630–6950 | SMARTS | | | 2011 Jul 3 | 2455746.49198 | 80.7 | 5630–6950 | SMARTS |
| 2011 Apr 23 | 2455675.38192 | 9.6 | 3900–5700, 5800–9400 | LT | | | 2011 Sep 15 | 2455820.92030 | 155.1 | 3655–5424 | SMARTS |
| 2011 Apr 23 | 2455675.46047 | 9.7 | 3655–5424 | SMARTS | | | 2011 Sep 19 | 2455824.89457 | 159.1 | 3655–5424 | SMARTS |
| 2011 Apr 24 | 2455676.38186 | 10.6 | 3900–5700, 5800–9400 | LT | | | 2011 Sep 21 | 2455826.89632 | 161.1 | 5630–6950 | SMARTS |
| 2011 Apr 24 | 2455676.50600 | 10.7 | 5630–6950 | SMARTS | | | 2011 Sep 21a | 2455826.92193 | 161.1 | 4060–4735 | SMARTS |
| 2011 Apr 25 | 2455677.38180 | 11.6 | 3900–5700, 5800–9400 | LT | | | 2011 Sep 23 | 2455828.91213 | 163.1 | 3250–9520 | SMARTS |
| 2011 Apr 25 | 2455677.44188 | 11.6 | 3655–5424 | SMARTS | | | 2011 Sep 25 | 2455830.87711 | 165.1 | 3655–5424 | SMARTS |
| 2011 Apr 27 | 2455679.45705 | 13.7 | 3655–5424 | SMARTS | | | 2011 Sep 27 | 2455832.89575 | 167.1 | 5630–6950 | SMARTS |
| 2011 Apr 28 | 2455680.55124 | 14.8 | 5630–6950 | SMARTS | | | 2011 Sep 29 | 2455834.86413 | 169.1 | 3870–4544 | SMARTS |
| 2011 Apr 29 | 2455681.38713 | 15.6 | 5630–6950 | SMARTS | | | 2011 Oct 3 | 2455838.86920 | 173.1 | 3870–4544 | SMARTS |
| 2011 May 1 | 2455683.51565 | 17.7 | 3250–9520 | SMARTS | | | 2011 Oct 3a | 2455838.89211 | 173.1 | 5630–6950 | SMARTS |
| 2011 May 2 | 2455684.46054 | 18.7 | 3655–5424 | SMARTS | | | 2011 Oct 5 | 2455840.83755 | 175.0 | 3870–4544 | SMARTS |
| 2011 May 3 | 2455685.29780 | 19.5 | 3870–4544 | SMARTS | | | 2011 Oct 5a | 2455840.87123 | 175.1 | 5630–6950 | SMARTS |
| 2011 May 4 | 2455686.44255 | 20.6 | 3870–4544 | SMARTS | | | 2011 Oct 7 | 2455842.85832 | 177.1 | 3250–9520 | SMARTS |
| 2011 May 5 | 2455687.45694 | 21.7 | 3655–5424 | SMARTS | | | 2011 Oct 9 | 2455844.85722 | 179.1 | 5630–6950 | SMARTS |
| 2011 May 7 | 2455689.46274 | 23.7 | 3655–5424 | SMARTS | | | 2011 Oct 15 | 2455850.84231 | 185.0 | 5630–6950 | SMARTS |
| 2011 May 8 | 2455690.45846 | 24.7 | 6230–7550 | SMARTS | | | 2011 Oct 16 | 2455851.86406 | 186.1 | 3250–9520 | SMARTS |
| 2011 May 9 | 2455691.47495 | 25.7 | 3655–5424 | SMARTS | | | 2011 Oct 17 | 2455852.86060 | 187.1 | 5630–6950 | SMARTS |
| 2011 May 10 | 2455692.45741 | 26.7 | 5630–6950 | SMARTS | | | 2011 Oct 19 | 2455854.83327 | 189.0 | 3655–5424 | SMARTS |
| 2011 May 11 | 2455693.46645 | 27.7 | 3655–5424 | SMARTS | | | 2011 Oct 23 | 2455858.83362 | 193.0 | 5630–6950 | SMARTS |
| 2011 May 13 | 2455695.45393 | 29.7 | 3655–5424 | SMARTS | | | 2011 Oct 29 | 2455864.78561 | 199.0 | 3655–5424 | SMARTS |
| 2011 May 14 | 2455696.55773 | 30.8 | 3870–4544 | SMARTS | | | 2011 Nov 1 | 2455867.83583 | 202.0 | 3250–9520 | SMARTS |
| 2011 May 15 | 2455697.45702 | 31.7 | 3250–9520 | SMARTS | | | 2011 Nov 3 | 2455869.82510 | 204.0 | 5630–6950 | SMARTS |
| 2011 May 16 | 2455698.43956 | 32.6 | 5630–6950 | SMARTS | | | 2011 Nov 5 | 2455871.82328 | 206.0 | 3655–5424 | SMARTS |
| 2011 May 17 | 2455699.46366 | 33.7 | 5985–9480 | SMARTS | | | 2011 Nov 15 | 2455881.78178 | 216.0 | 3870–4544 | SMARTS |
| 2011 May 18 | 2455700.40413 | 34.6 | 3655–5424 | SMARTS | | | 2011 Nov 15a | 2455881.80037 | 216.0 | 5630–6950 | SMARTS |
| 2011 May 20 | 2455702.45740 | 36.7 | 5630–6950 | SMARTS | | | 2011 Nov 16 | 2455882.77670 | 217.0 | 3250–9520 | SMARTS |
| 2011 May 24 | 2455706.43767 | 40.6 | 3655–5424 | SMARTS | | | 2011 Nov 19 | 2455885.78113 | 220.0 | 3655–5424 | SMARTS |
| 2011 May 25 | 2455707.45922 | 41.7 | 3655–5424 | SMARTS | | | 2011 Nov 21 | 2455887.74116 | 221.9 | 3870–4544 | SMARTS |
| 2011 May 26 | 2455708.54164 | 42.7 | 3870–4544 | SMARTS | | | 2011 Nov 21a | 2455887.84304 | 222.0 | 5630–6950 | SMARTS |
| 2011 May 29 | 2455711.37204 | 45.6 | 3655–5424 | SMARTS | | | 2011 Nov 23 | 2455889.74104 | 223.9 | 3250–9520 | SMARTS |
| 2011 May 30 | 2455712.45091 | 46.7 | 5630–6950 | SMARTS | | | 2011 Nov 25 | 2455891.80641 | 226.0 | 5630–6950 | SMARTS |
| 2011 May 31 | 2455713.45613 | 47.7 | 5630–6950 | SMARTS | | | 2011 Nov 29 | 2455895.69458 | 229.9 | 3655–5424 | SMARTS |
| 2011 Jun 1 | 2455714.43748 | 48.6 | 3250–9520 | SMARTS | | | 2011 Dec 8 | 2455904.67796 | 238.9 | 3655–5424 | SMARTS |
| 2011 Jun 2 | 2455715.50471 | 49.7 | 5630–6950 | SMARTS | | | 2011 Dec 9 | 2455905.69137 | 239.9 | 3870–4544 | SMARTS |
| 2011 Jun 3 | 2455715.51736 | 49.7 | 3655–5424 | SMARTS | | | 2011 Dec 12 | 2455908.67536 | 242.9 | 3655–5424 | SMARTS |
| 2011 Jun 8 | 2455721.51827 | 55.7 | 3655–5424 | SMARTS | | | 2011 Dec 13 | 2455909.81406 | 244.0 | 5630–6950 | SMARTS |
| 2011 Jun 9 | 2455722.45866 | 56.7 | 3870–4544 | SMARTS | | | 2011 Dec 14 | 2455910.66410 | 244.9 | 3870–4544 | SMARTS |
| 2011 Jun 10 | 2455723.47018 | 57.7 | 3250–9520 | SMARTS | | | 2011 Dec 14a | 2455910.77023 | 245.0 | 5630–6950 | SMARTS |
| 2011 Jun 11 | 2455724.45218 | 58.7 | 3655–5424 | SMARTS | | | 2011 Dec 15 | 2455911.76083 | 246.0 | 3655–5424 | SMARTS |
| 2011 Jun 12 | 2455725.44831 | 59.7 | 5630–8860 | SMARTS | | | 2011 Dec 16 | 2455912.74787 | 247.0 | 3250–9520 | SMARTS |
| 2011 Jun 14 | 2455727.47669 | 61.7 | 5630–6950 | SMARTS | | | 2011 Dec 17 | 2455913.74309 | 247.9 | 5630–6950 | SMARTS |
| 2011 Jun 16 | 2455729.46994 | 63.7 | 5630–6950 | SMARTS | | | 2011 Dec 18 | 2455914.73296 | 248.9 | 3870–4544 | SMARTS |
| 2011 Jun 22 | 2455735.45566 | 69.7 | 3655–5424 | SMARTS | | | 2011 Dec 19 | 2455915.72555 | 249.9 | 5630–6950 | SMARTS |
Notes. The time in the third column is counted from the discovery on 2011 April 14.29 UT (JD 2455665.7931, t = 0 days). *Spectra with λ range 3250–9518Å are taken with low resolution. aTwo different observations were made on the same observation date.
Download table as: ASCIITypeset image
2.2.1. SMARTS
The 1.5 m telescope of the SMARTS II Consortium located at CTIO Chile is equipped with a long-slit Ritchey-Chrétien spectrograph. An ultraviolet transmitting grating is used at the f/7.5 focus with a plate scale 18.1 arcsec mm−1 and a 1200 × 800 CCD. We obtained 99 low- to moderate-resolution (300 < R < 3400) optical spectra of T Pyx. These spectra include 49 moderate-resolution spectra in the blue region (3655–5424 Å and 3870–4544 Å), 37 moderate-resolution spectra in the red region (5630–6950 Å), and 13 low-resolution spectra in a wide wavelength region (3250–9520 Å). We obtained 56 spectra of particular interest to us from 2011 April 14 (JD 2455666.55056, t = 0.757 days, given hereafter 0.8 days), which was the earliest epoch T Pyx was observed spectroscopically, to 2011 July 3 (JD 2455746.49198, t = 80 days). Another 43 spectra were obtained from 2011 September 15 (JD 2455820.92030, t = 155.127) to 2011 December 19 (JD 2455915.72555, t = 249.9 days). All data are available through the SMARTS atlas; see Walter et al. (2012).4
2.2.2. The LT
The 2 m robotic LT (see Steele et al. 2004) is at the Observatorio del Roque de Los Muchachos on the Canary Island of La Palma, Spain. T Pyx's spectra on the nights of 2011 April 22–25 were secured using the Fibre-fed RObotic Dual-beam Optical Spectrograph (see Barnsley et al. 2012) on the LT over 3900–5700 Å in the blue (R ∼ 2200) and 5800–9400 Å in the red arm (R ∼ 2600), with exposures of 60 s. Data reduction was performed through a pipeline that initially performs bias, dark frame, and flat-field subtraction. A spectroscopic standard star HD289002 (α = 06h45m13371, δ = +02°08'1470) was observed at a similar airmass and used to remove instrumental and atmospheric response. We used the onedspec package in IRAF5 to analyze all LT spectra.
3. RESULTS AND DISCUSSION
3.1. SMEI Light Curves
The SMEI light curve is compiled from 533 observations6 and provides unprecedented detail with high-cadence data, which are compared to AAVSO light curves in Figures 2 and 3.
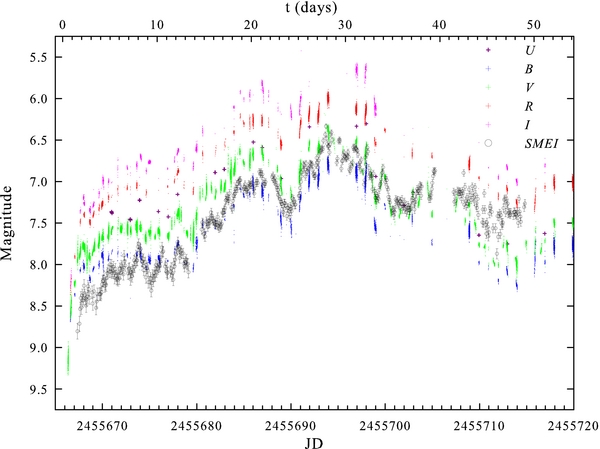
Figure 2. SMEI light curve of T Pyx during its 2011 outburst (open black circles with error bars) compared to UBVRI light curves observed by AAVSO (plus signs).(A color version and FITS images of this figure are available in the online journal.)
Download figure:
Standard image High-resolution image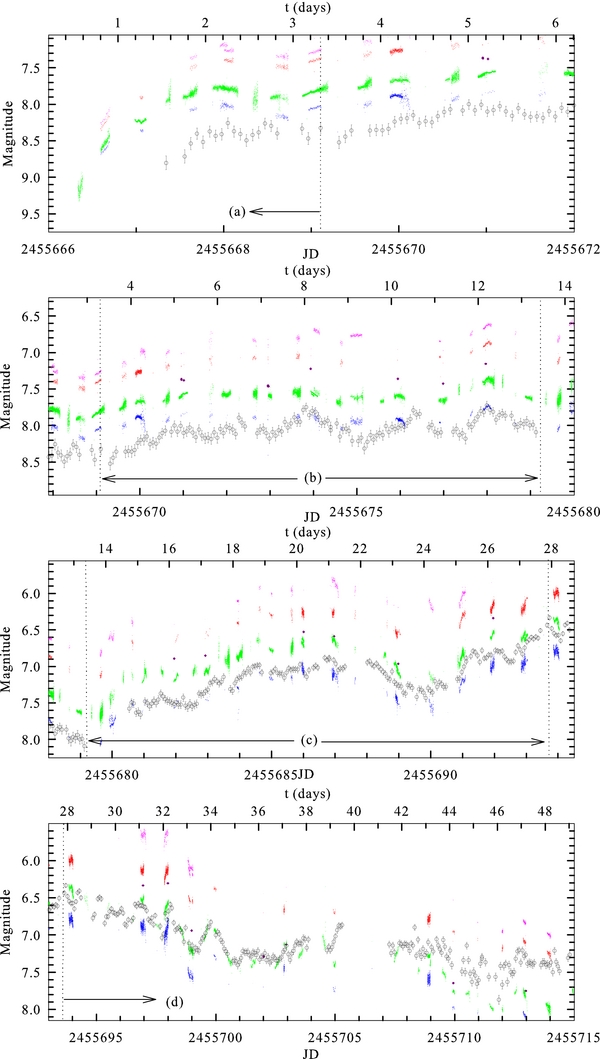
Figure 3. Four idealized phases of the SMEI light curves, including the initial rise (a), the pre-maximum halt (b), the final rise (c), and the early decline (d). Vertical dotted lines separate each phase of the light curve.
Download figure:
Standard image High-resolution image3.1.1. Phases of the Outburst from the SMEI Light Curve
We divide the SMEI light curve into four parts based on the idealized nova optical light curve given in Warner (2008); see Figure 3.
- 1.The initial rise (2011 April 15–16, t = 1.5–3.3 days). The first reliable detection of the nova outburst by SMEI occurred at the end of the rapid rise seen in AAVSO data, at mSMEI = 8.80 ± 0.09 on 2011 April 15.84 UT (JD 2455667.3422, t = 1.5 days). After that time, SMEI observed T Pyx approximately every 102 minutes. The light curve rose to mSMEI = 8.26 on JD 2455668.0476 (t = 2.2 days) and began quasi-periodic variations (Hounsell et al. 2011) as shown in the top left panel of Figure 3. This phase ended at t ∼ 3.3 days when the light curve began to flatten.
- 2.Pre-maximum halt (2011 April 16–27, t = 3.3–13.3 days). Following the initial rise, the SMEI light curve rose very slowly (noted as "almost plateau" by Hounsell et al. 2011) with clear quasi-periodic variations as shown in Figure 3(b). The peak-to-peak times of the variations vary between 1.1–2.8 days. The magnitudes ranged between 7.7–8.5 mag. The first peak and dip of this variation was also noted by Schaefer et al. (2013). However, the AAVSO light curve did not clearly show the quasi-periodic variations detectable in the SMEI light curve. This phase may coincide with the pre-maximum halt defined as a pause at about 2 mag below maximum for a few days for slow novae (Warner 2008; Hounsell et al. 2010). There was then a gap in the SMEI data (due to instrumental problems) lasting 1.4 days (t = 13.3–14.7 days).
- 3.Final rise (2011 April 28 to May 11, t = 14.7–27.9 days). After the pre-maximum halt phase, the light curve was seen to rise more steeply to mSMEI = 6.88 ± 0.04 at t = 20.9 days. Meanwhile, the apparent quasi-periodic variations still persisted with approximately half the amplitude of those seen in the previous phase.The light curve then suddenly dropped at t = 22.1 days to mSMEI ∼ 7.4 for about two days. This event appeared as a major dip in the light curve before it reached maximum light. After this dip, the light curve rose again to mSMEI = 6.79 ± 0.04 at t = 25.5 days and stayed there for roughly two days before it reached visual maximum at mSMEI = 6.33 ± 0.03 on 2011 May 12.22 (JD 2455693.7251, t = 27.9 days) as seen in the bottom left panel of Figure 3.
- 4.Early decline (2011 May 11 to [∼October 3], t = 27.9 days to [∼90 days]). After optical maximum, the nova declined with variations (amplitude ranges roughly between 0.1–0.3 mag) to mSMEI ∼ 7.2–7.4 from 2011 May 19.42–20.76 UT (JD 2455700.9203–2455702.2605, t = 35.1–36.5 days). The light curve experienced a dip again at around t ∼ 36 days and followed this with a broad hump lasting from t ∼ 44–47 days as seen in Figure 3(d). The last reliable detection of T Pyx by SMEI was at mSMEI = 7.26 ± 0.05 on 2011 June 2.37 UT (JD 2455714.8165, t = 49.02 days).Further light curve observations provided by the AAVSO in Figure 1 show that the early decline phase ends at around t ∼ 90 days with the brightness having declined by approximately 2.5–3.5 magnitudes from maximum. The final decline (∼6 magnitudes from maximum) began around t ∼ 260 days.
We may compare the early stages of the outburst captured by SMEI to the light curves presented by Hillman et al. (2014) from TNR modeling with a range of parameters. There is certainly some resemblance to some of these model light curves in terms of the pre-maximum halt and subsequent smaller reversal just before optical peak. The former is attributed to a temporary drop in energy flux as convection in the expanding, thinning envelope ceases to be efficient near the surface of the envelope. The later dip resembles the shorter timescale feature noticed in, e.g., RS Oph and KT Eri by Hounsell et al. (2010) just before maximum light.
When directly comparing the SMEI to the AAVSO light curves, we see that the nova seems to be bluer and similar to the magnitude in the B filter at the pre-maximum halt phase, then exhibits the same brightness in the B and V filters at visual maximum where it is expected to behave like an early type star, usually in the range from B5–F5 (Warner 2008). After visual maximum, it tends to be redder, approaching the magnitude in the R filter as shown in Figure 2.
When comparing the SMEI data to the previous five outbursts in B and V and their resulting eruption templates provided in Schaefer (2010), we find that the shape and the magnitude of the visual peak in 2011 are compatible with previous outbursts. However, the pre-maximum halt phase in 2011 seems to be fainter, while during the decline, after the visual maximum, the nova is brighter in 2011 than shown in the templates (Figure 4). All the maxima, including the 2011 maximum, have exhibited brightness fluctuations near the optical peak and the declines have been slow. This is consistent with observations noted in Catchpole (1969) and Williams (1982) for the 1966 outburst.
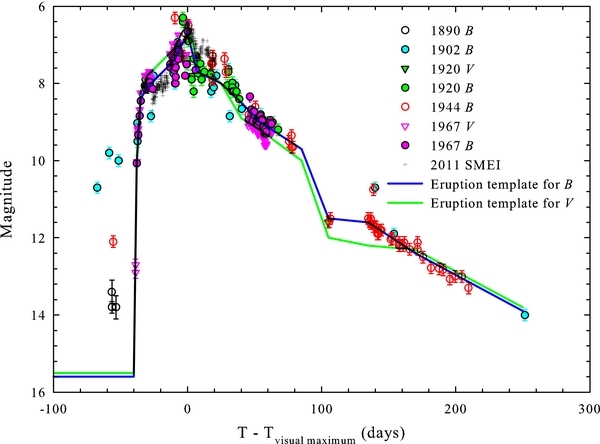
Figure 4. Outburst in 2011 from SMEI (plus signs) compared to previous outbursts. The B (circles) and V (triangles) observations are highlighted in different colors to represent each year of outburst (1890: open black, 1902: blue, 1920: green, 1944: open red, and 1967: pink). Data for the previous outbursts are taken from Schaefer (2010).
Download figure:
Standard image High-resolution image3.1.2. Investigation of Periodicities
The SMEI light curve was searched for any periodic modulations. The analysis was undertaken using all the available SMEI data, but we separated it into four cases: (a) from the first observation to the last observation, (b) from the first observation to visual maximum, (c) from visual maximum to the last observation, and (d) from the first observation to the end of the pre-maximum halt phase. The analysis used the PERIOD047 PC code from Lenz & Breger (2004, 2005). PERIOD04 is especially useful for analysis of astronomical time series containing gaps. The program extracts the individual frequencies from the multi-periodic content and provides the frequencies, semi-amplitude, and phase of the harmonic signals of the light curve using a combination of least-squares fitting and the discrete Fourier transform algorithm. The uncertainty of the estimated periods was derived from Monte Carlo simulations.
The resulting periodograms for all five cases are displayed in Figures 5–9. The top panels show how closely the calculations agree with the observations, and the most prominent peaks are presented in Table 2. A prominent period of 1.8 days is apparent after the pre-maximum halt. However, by far the most strongly detected period, P = 1.44 ± 0.05 days, with the highest signal ratio ∼106 as shown in Figure 6, is found up to this time. This period is close to the weak signal of 1.24 days found by Patterson et al. (1998) who suggested it might originate from precession in an accretion disk. However, it is doubtful whether the disk would re-form so soon after the outburst, and at this early time, the central system is expected to lie well within the pseudo-photosphere (see below) and therefore not be directly observed.

Figure 5. Period found by analyzing the SMEI light curve from the beginning of SMEI observations to the last observation. The observation points were fitted (top) and yielded the spectral window (below), the observational data (middle), and the ratio of the spectral window to the amplitude that gives us the possible periods (bottom).
Download figure:
Standard image High-resolution image
Figure 6. As in Figure 5, but from the beginning of SMEI observations to the end of the pre-maximum halt phase.
Download figure:
Standard image High-resolution image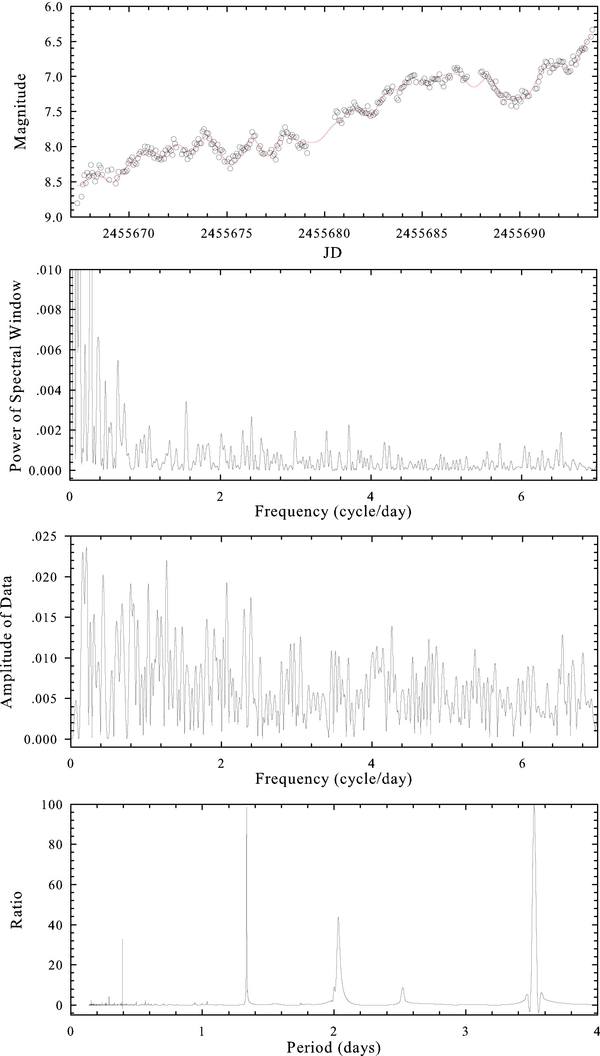
Figure 7. As in Figure 5, but from the beginning of SMEI observations to visual maximum.
Download figure:
Standard image High-resolution image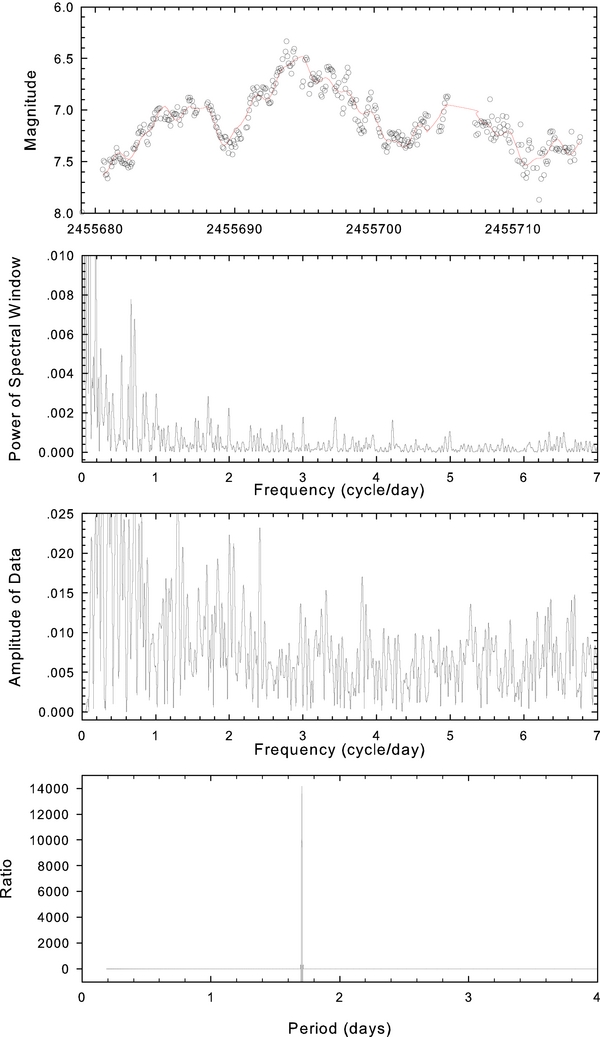
Figure 8. As in Figure 5, but from the end of the pre-maximum halt phase to the last SMEI observation.
Download figure:
Standard image High-resolution image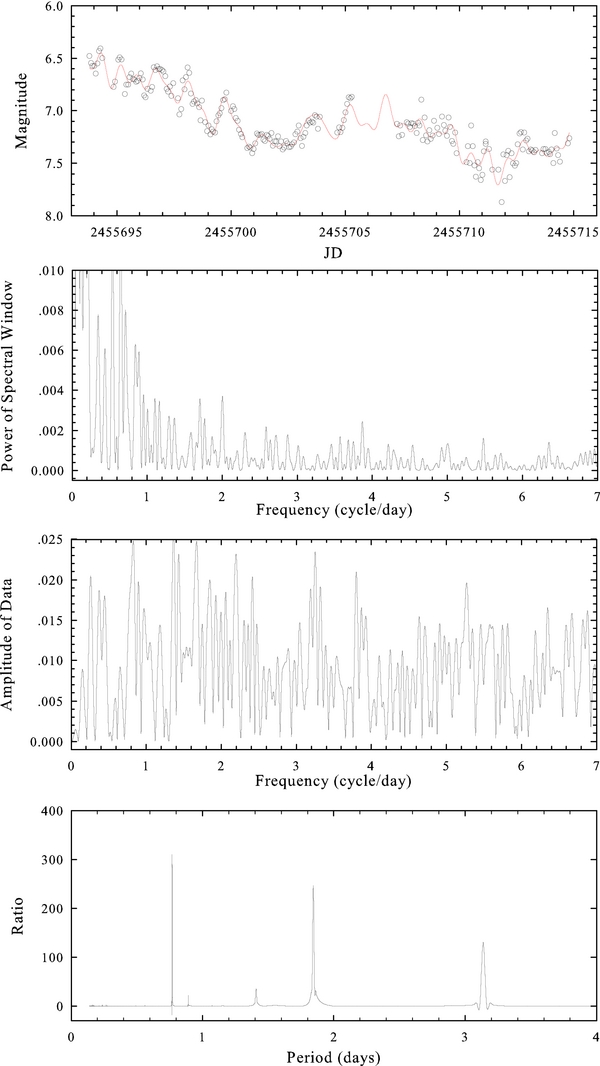
Figure 9. As in Figure 5, but from the visual maximum to the last SMEI observation.
Download figure:
Standard image High-resolution imageTable 2. Results from PERIOD04
| Cases | Parts of Light Curve | t | Most Prominent Period |
|---|---|---|---|
| (days) | (days) | ||
| (a) | First observation–last observation | 1.5–49.0 | 1.8 ± 0.1, 3.6 ± 0.5 |
| (b) | First observation–end of pre-maximum halt | 1.5–13.4 | 1.44 ± 0.05 |
| (c) | First observation–visual maximum | 1.5–27.9 | 3.5 ± 0.08, 1.34 ± 0.03 |
| (d) | End of pre-maximum halt–last observation | 13.4–49.0 | 1.7 ± 0.1 |
| (e) | Visual maximum–last observation | 27.9–49.0 | 0.77 ± 0.02, 1.84 ± 0.05 |
Download table as: ASCIITypeset image
Some of the TNR models by Hillman et al. (2014) produced marked oscillations prior to or during extensive mass loss, caused by the restructuring and rebalancing of the envelope as it expands. However, we found no significant changes in the Hα line shape with the 1.44 day period when we compared the four red spectra (t = 5.7, 8.6, 9.6, and 11.6 days) taken during the optical pre-maximum halt. Similarly, we found no significant differences in the overall ionization during a cycle from consideration of the appearance of lines across the full spectral range. These two aspects are also found to be the same in the blue spectra, where the Hγ line was of course investigated rather than Hα.
3.2. Spectra from SMARTS and LT
The spectra of T Pyx are also used here to try to understand what causes the gross changes in the light curve—e.g., changes in mass loss rate from the WD surface as the TNR proceeds—and to derive other parameters of the outburst. In order to compare the spectra to the light curve at the exactly the same date, we interpolate the mSMEI of the date (at the start time of the observations) for which the spectra are available, as shown in the top panel of Figure 10.
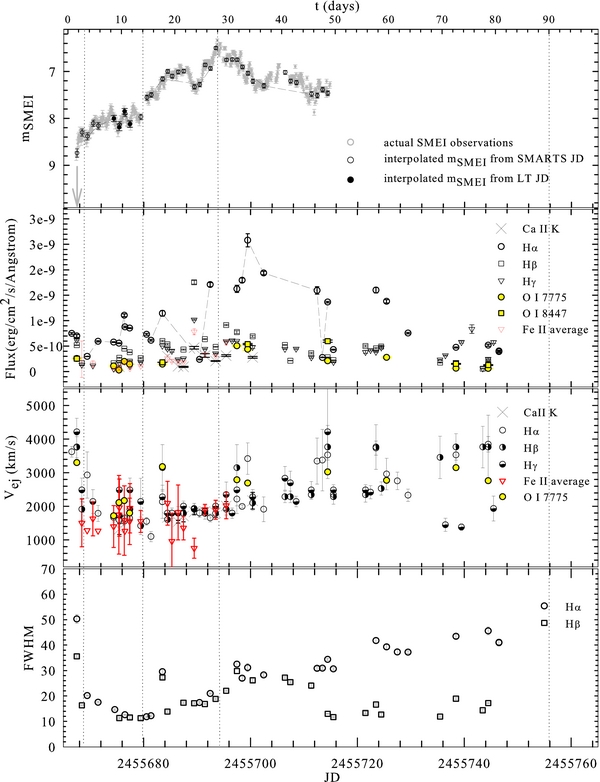
Figure 10. SMEI light curve of T Pyx compared to flux and ejection velocities from Balmer, average Fe ii (5169, 5018, 4233, 4178, and 4173 Å), O i, and Ca ii K lines. Dashed lines in the top two panels connect observations of Hα flux. The evolution of the FWHM of Balmer lines is also shown (bottom panel). Vertical dotted lines represent phases in the light curve referred to in the text.
Download figure:
Standard image High-resolution imageThe light curve was compared to the flux and ejection velocities measured from Hα, Hβ, and Hγ lines as shown in this figure. The variation in flux of the Balmer lines is similar to that found in the light curves before visual maximum. For example, the variation in Hα flux around 2011 May 17 (t = 33.7 days) is obviously responsible for the sharp and high-amplitude peak light curve at this time.
3.2.1. Velocities Derived
The ejection velocities (Vej) were measured from the P Cygni profiles. The measured lines include Hα, Hβ, and Hγ, which have measurable P Cygni profiles from 2011 April 16 to June 1 (t = 2.7–48.6 days); Fe ii recombination lines at 5169, 5018, 4233, 4178, and 4173 Å; O i 7775 Å; and the Ca ii K line at 3934 Å. Figure 11 shows the P Cygni profiles of Hα lines from the initial rise to the end of the pre-maximum halt phase.
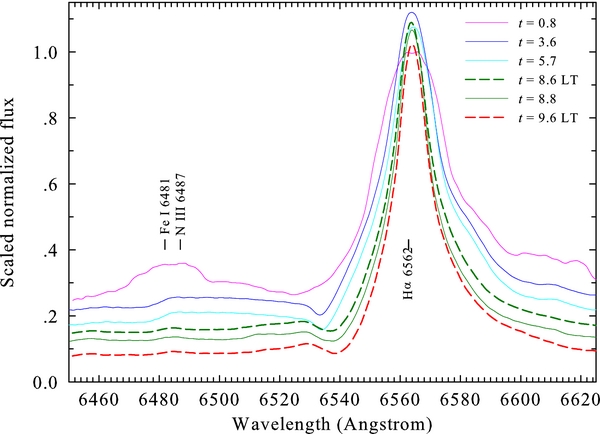
Figure 11. P Cygni profiles of Hα lines from the initial rise to the end of the pre-maximum halt phase.
Download figure:
Standard image High-resolution image3.2.2. Spectral Evolution
Figure 12 shows all low-resolution spectra taken from t = 1.7–247 days, which cover the initial rise phase through the transition phase of the light curve. We discuss the spectral evolution based on the idealized nova optical light curve given in Warner (2008) together with a recognition of a common pattern of line development described by McLaughlin (1942, 1944). We also note the physical interpretation of various stages. For example, from the earliest moment, the nuclear explosion on the surface of the WD leads to the ejection of a hot, luminous, and massive shell that expands radially with time. Ney & Hatfield (1978) called this stage the "pseudo-photospheric expansion" for the spectral energy distribution (SED) and spectroscopic features are characteristic of the photosphere of a star with spectral type A to F (Payne-Gaposchkin 1957). Gehrz (1988) called this stage the "fireball" because it has been used to describe the early development of man-made atomic explosions and therefore he used it to describe the expanding pseudo-photosphere of the nova.
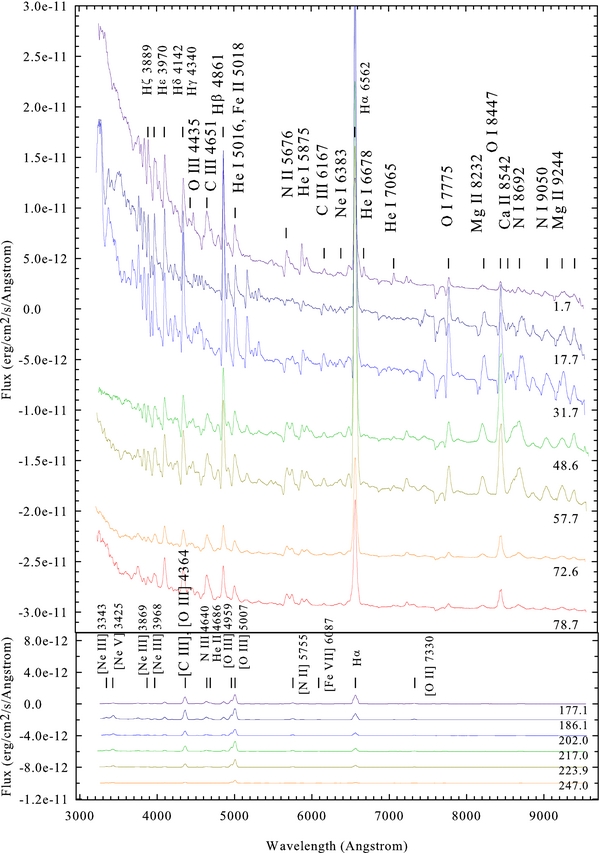
Figure 12. Low-resolution spectra of T Pyx taken from t = 1.7–247 days. Spectra before the seasonal gap (top) are offset in flux for clarity, as indicated, with the spectrum at 1.7 days representing the observed flux and those from 17.7–78.7 days being offset in steps of 5 × 10⁻¹¹ erg cm−2 Å−1. Spectra after the seasonal gap (bottom) are offset in flux with the spectrum at 177.1 days representing the observed flux and those from 186.1–247.0 days being offset in steps of 2 × 10⁻¹¹ erg cm−2 Å−1.
Download figure:
Standard image High-resolution imageThe fireball's envelope is initially small and dense with the radiation peak at X-ray wavelengths. Then, the envelope cools adiabatically as it increases in size. As a result, the opacity increases, the ejecta become optically thick after the outburst, and the radiation peak shifts toward longer wavelengths (Shore et al. 1994). Therefore, this cooling of the ejecta envelope together with the rapid expansion of the photosphere (Ennis et al. 1977; Gehrz et al. 1980) provide the rapid initial rise in the optical light curve.
Following optical maximum, the effective temperature (Teff) of a nova, which is radiating at constant bolometric luminosity, rises as the pseudo-photosphere shrinks back onto the WD and as the mass loss rate from the WD decreases (Bath & Harkness 1989). As a result, the peak emission now shifts toward shorter wavelengths. The effective temperature of the pseudo-photosphere changes as the visual flux declines according to

where ΔV is the decline in magnitude from visual maximum, and T0 is the photospheric temperature at optical peak (Bath & Harkness 1989). We take T0 = 8000 K (Evans et al. 2005) and use the equation above to estimate Teff. According to Bath & Harkness (1989), the physical state of the photosphere (i.e., temperature, radius, density, and pressure) is approximately the same at equal magnitudes below the optical maximum in all novae. Consequently, one might anticipate that the spectral appearance of a nova should be the same at the same magnitude below peak in all novae if this simple model is correct. It can then be applied before and after peak if the mass loss rate from the WD is the governing factor.
- 1.The initial rise (2011 April 14–16, t = 0.8–3.3 days). Accordingly, the spectral evolution is divided into the following four stages. The first red spectra were obtained on 2011 April 15.05 UT (JD 2455666.55056, t = 0.8 days), about 27 days before the visual maximum. At this time, the AAVSO visual magnitude was V ∼ 8.7 (about 6.8 mag brighter than quiescence at V ∼ 15.5 and about 2.4 mag below visual maximum; see Figure 1). The top panel of Figure 13 reveals that the lines were broad and diffuse. Hα and Hβ emissions were strong while the P Cygni profiles were not yet seen clearly when compared to other later spectra, shown in Figure 11. Moreover, the spectrum at t = 1.7 days in Figure 12 shows that the brightness of the nova comes almost entirely from the continuum at this early stage of the outburst. This is consistent with the characteristics of the pre-maximum spectrum stage given by Payne-Gaposchkin (1957). This is expected as the expanding pseudo-photosphere is of similar extent to the maximum radius initially reached by the ejecta.The pre-maximum spectrum is defined as the earliest spectrum at which any given nova has been observed on the rise until at least one or two days after maximum light (McLaughlin 1942). It usually contains lines that are broad and diffuse with negative velocity displacement (Payne-Gaposchkin 1957).Our spectra showed P Cygni profiles in the Balmer, Fe ii, and O i lines quite early in the first spectra, during this fireball phase. This aspect is similar to that observed at this time in DQ Her and LMC 91 as mentioned in Schwarz et al. (2001). The absorption components of P Cygni profiles became broader and shallower from t = 0.8 to 2.7 days.The initial rise ended just after 2011 April 16.95 UT (JD 2455668.44853, t = 2.7 days), where the first medium-resolution blue spectra were obtained. At t = 0.8 days, the H i Balmer lines were present in emission and becoming stronger with blueshifted absorptions and the presence of He i. By t = 2.7 days, the rise of ionized iron emission lines was evident. There were emissions of high-excitation lines (see Table 4), i.e., C iii, N iii, Ne ii, O ii, N ii, He i, and Ne i, present during this phase (see Figure 13) which disappeared later around 2011 April 22–23 (t = 8.6–9.7 days). These O ii and N ii lines are also expected to be the ionized elements that should be found at ∼1.5 mag below peak (Bath & Harkness 1989); see Table 3. Another expected emission line at 2.9 mag below peak is O iii at 4435 Å, which is also seen at t = 1.7–2.7 days.A marked drop in the derived expansion velocity (Vej) during this phase is also noted (see Figure 10). We note that Imamura & Tanabe (2012) and Shore et al. (2011) also report a decline in derived expansion velocities at early times. The first observations show a derived expansion velocity of ∼4000 km s−1 at t = 0.8 days, which then drops to ∼2000 km s−1 at t = 2.7 days for Balmer lines. This should not be interpreted as a deceleration. This aspect of the pre-maximum spectrum with the dramatic decrease in Vej during the initial rise is also found in the slow nova DQ Her (McLaughlin 1937) for Balmer lines. Meanwhile, the fast nova V603 Aql (Wyse 1940) also showed a decrease in Vej for Balmer and metal lines from a few observations during the final rise.If the initial ejection is a Hubble flow, then one will a see high Vej initially, which declines as one sees into deeper layers. We also note, as an aside, a comparison to the high-velocity features found in all Type Ia SNe and believed to be the result of the interaction of initial highest velocity ejecta with a circumstellar envelope (Benetti et al. 2005). The subsequent change in behavior of the derived Vej during the pre-maximum halt phase suggests two different stages of mass loss: a short-lived phase first occurring immediately after outburst, followed by a more steadily evolving and higher mass loss phase.
- 2.The pre-maximum halt (2011 April 17–27, t = 3.6–13.7 days). The SMEI light curve at this phase has mSMEI ∼ 8 mag (with 0.1–0.3 mag variations), which is about 2 mag below maximum (6.33 mag). This phase lasts for about 10 days. As Warner (2008) notes, the pre-maximum phase is generally much longer lasting in slow novae than in fast novae.All of the C iii lines disappeared by t = 3.6 days, while other lower ionization lines such as N iii, Ne ii, N ii, and Ne i lasted a little longer until disappearing approximately around t = 5.7–10.7 days as shown in Table 4, consistent with behavior reported in Shore et al. (2011). The spectra at t = 3.6–5.7 days show broad and strong emission lines present between λ ∼ 6480–6530 Å and then these fade away. Lines that were present all the time during this phase are O i, O ii, He i, and Fe i, which are again consistent with the behavior proposed by Bath & Harkness (1989) at this magnitude below peak. We note that He i 5875 Å and 6678 Å were present from t = 0.8 days then became weaker and totally disappear by t = 14.8 days. They appeared again at t = 80.7 days.The end of the fireball stage occurs around t = 8.6 days which is also the beginning of the next optically thick phase called the "iron curtain." The iron curtain (Hauschildt et al. 1992; Schwarz et al. 2001) occurs when the pseudo-photosphere reaches its minimum temperature (∼104 K). The iron-peak elements recombine at this temperature. The overlapping of absorptions of Fe ii lines in the near UV region results in line blanketing in the UV which dominates the UV SED and redistributes most of the emitted light into the optical and IR.At this stage, we found three characteristics of the iron curtain, which are mentioned in Schwarz et al. (2001). First is the increase in the width of the emission lines, which is clearly occurring in the final rise (see Figure 10); second is the increase in the derived expansion velocity which Schwarz et al. (2001) suggested could be due to the gradually accelerating optically thick wind that is proposed to begin after the initial outburst (Kovetz 1998); third is the increase in the intensity of Fe ii multiplets and O i 7775 Å and 8447 Å. Figure 14 shows that the low-excitation lines such as Fe–peak transitions, particularly Fe ii recombination lines at 5169, 5018, 4233, 4178, and 4173 Å, begin to rise from t = 8.6 days.There is also a tendency for the absorption components, especially those of the Fe ii lines, to become sharper and stronger as maximum is approached. We note that during this phase (for particular ions) the spectrum tends to develop such that the shorter wavelength lines are evident first, followed by the next lines toward the longer wavelength. For example, Fe i 7443 Å develops first, followed by Fe i 7446 Å. This also happens with Fe i 7469–7473 Å, O ii 7895–7898 Å, and Fe i 8468–8471 Å.The variation of the light curve during the pre-maximum halt phase seems to be consistent with variations in the strength of the Hα, Hβ, Hγ, and Fe ii lines during this halt as shown in Figure 10. There is an obvious sharp variation in the light curve during t = 8.6–11.6 days where spectra show that some Fe i lines were present at t = 9.6–10.6 days but not before or after that (bottom panel of Figure 15). For example, the Fe i 7854 Å line was not detected at t = 8.6 days but was present on days 9.6 and 10.6 before disappearing again at t = 11.6 days. Meanwhile, Fe i 8838 Å was present only at t = 10.6 days.Imamura & Tanabe (2012) and Ederoclite (2013) suggested that T Pyx evolved from a He/N to an Fe ii type nova (Williams 1992) by the time it reached visual maximum. Here, we can point out that the exact time that this process began was during this pre-maximum halt phase and it was completed by the final rise. We note, however, that this spectral classification is normally applied to novae from maximum light onward. The evolution of T Pyx from a He/N nova to an Fe ii type nova suggests that there was sufficient mass loss for the optical thickness in the outer layers to increase during the rise to maximum so that we were seeing less deep into the expanding layers. This type of evolution could be typical for many novae in outburst but has not been seen before because of insufficient observations early in the outburst.The maximum Vej of approximately 2200 km s−1 during this phase derived from the Balmer lines agrees very well with that obtained by Imamura & Tanabe (2012). Although we do not have information from the P Cyg profiles in Fe ii lines until t = 3.6 days to verify the very high Vej at the same initial rise phase as the Balmer lines, the Fe ii lines seem to show a similar trend subsequently to that of the Balmer lines in that Vej stabilizes at ∼1500 km s−1 during the pre-maximum halt and tends to increase afterward.
- 3.Final rise (2011 April 28 to May 11, t = 14.7–27.9 days). Here, the light curve rises more steeply toward the maximum. As noted above, the iron curtain stage is expected to peak around this time. However, Figures 16 and 17 shows the Fe ii flux rose to a sharp peak just before t ∼ 23 days when there is a major dip in the SMEI light curve with a minimum at t = 23.7 days. The visual maximum then occurred four days later at t = 27.9 days.The "principal spectrum," which dominates CNe spectra at visual maximum (Payne-Gaposchkin 1957; Warner 2008), displays strong lines of O i (i.e., the "O i flash"). In T Pyx, these became apparent around t ∼ 17 days and grew in intensity at about the same rate as the Fe ii lines, as shown in Figure 18. At the O i flash, the V magnitude was ∼1.5 mag below peak, which agrees with that expected by Bath & Harkness (1989) from the ΔB at this time. Strong bright lines of Fe ii and Ca ii are always present. The emission of [N ii] 5755 Å begins to grow stronger at t = 26.7 days, about ten days after the O i flash, since N lines, i.e., [N ii] 5755 Å, together with emission lines of N iii, N iv, and N v in the UV, are expected to be seen in the principal spectrum phase of novae (Jaschek & Jaschek 2009).8Again the Balmer lines and other lines show a similar trend of Vej, i.e., gradually increasing (after the initial decrease at early times). This may imply that here the innermost layers of material now move faster than the outer layers (i.e., the relative radius of the pseudo-photosphere to that of the ejecta is shrinking significantly and therefore revealing higher velocity material again). As noted above, this was proposed by Schwarz et al. (2001) in terms of a gradually accelerating wind in nova LMC 1991 and has been used to model early hard X-ray emission in some CNe (e.g., O'Brien et al. 1994). The visual maximum at t = 27.9 days seems to exhibit the lowest ionization lines, again as predicted in the simple Bath & Harkness (1989) models.The three characteristics of the iron curtain, which are first mentioned in the pre-maximum halt phase, persist in this final rise phase. Returning to the major dip in the light curve at t = 23.7 days, we find that the normalized flux of the blue spectra with respect to the Hα line on the day before, at, and after the dip (at t = 21.7, 23.7, and 25.7 days, respectively) all looked exactly the same in shape, and the only difference was in the Hα flux, which dropped very significantly at the dip. Thus, the mechanism that causes the very marked drop in the emission line strength of Hα, and other lines at longer wavelengths, must be responsible for the major dip in the total flux in the final rise. Meanwhile, there are almost no other emission lines apart from Hα in the red spectra at t = 24.7 days.
- 4.Early decline (2011 May 11 to October 3, t = 27.9–90 days).The early decline phase of the CN light curve is defined as the beginning of the decrease in brightness to ∼3.5 magnitudes below peak (Warner 2008). The SMEI light curve declines in brightness from mSMEI = 6.5 (t = 27.9 days) to mSMEI = 7.26 at the last SMEI detection (t = 49.7 days). The multi-color light curves from AAVSO subsequently show sharp drops in all colors at t ∼ 90 days, where ΔV ∼ 2.5–3.5 mag from maximum.Hα reached its maximum observed flux at t = 31.7 days, which is after the visual maximum was reached at t = 27.9 days. The strong emission of Fe ii and Ca II, which is always present in the conventional principal spectrum (Payne-Gaposchkin 1957), persists until sometime before t ∼ 48 days. About five days after the optical maximum, the nebular lines of [O i] 6300 and 6363 Å appeared. The O ii lines, which are expected to became apparent at ΔB ∼ 1.5 mag below peak (Bath & Harkness 1989), are always present from t = 33.7–61.7 days.The Balmer lines began to show a double-peaked structure from the spectrum taken at t = 42.7 days. About twenty days after the maximum (t = 45.6 days), the forbidden line of [O iii] 5007 Å appeared. The flux of Balmer lines began to fade around t = 70 days. The "4640 emission" (Payne-Gaposchkin 1957), produced by a blend of N iii and N ii lines and known as a characteristic of the "Orion spectrum," becomes apparent at t ∼ 70–80 days as shown in Figure 19. The emission line of N v at 4603 Å, which is expected to appear during the Orion spectrum phase of a typical nova (Jaschek & Jaschek 2009), also begins to emerge at t = 73.7 days. The emergence of these lines is designated as "nitrogen flaring." Thus, we find that the Orion spectrum stage (Payne-Gaposchkin 1957; Warner 2008) started around t = 70 days. We note that the N iii and N v lines appeared earlier than would have been expected from the simple Bath & Harkness model.This evolution is in line with the progression toward the "nebular spectrum" stage of CN (Warner 2008). Meanwhile, the pseudo-photosphere is continuing to shrink in radius and the effective temperature is increasing.The He i 5876 Å line and the [Fe x] 6375 Å coronal line were marginally detected at t = 80.7 days (see Figure 20), which was the last spectrum observed before the seasonal gap. When spectroscopic observations started again at t = 155.1 days, the nova displayed the expected nebular spectrum.
- 5.Transition to the nebular phase (2011 October 3 to December 19, t = 90–250 days). After the seasonal gap, T Pyx had declined to about 5 mag below maximum. By this time, as indicated in the previous phase, the [O iii] 5007 Å nebular and [Fe x] 6375 Å coronal lines had clearly developed. It is then of interest to note that the Swift satellite detected the rise in the X-ray light curve at t = 111 days (see below).The first blue spectrum (t = 155.1 days) already showed [Ne iii] 3869 Å, [C iii] 4364 Å, and N iii 4640 Å, which were increasing in intensity, especially the [C iii] line as shown in Figure 21. The appearance of N iii at t ∼ 90 days is consistent with the expectations of Bath & Harkness (1989) for ΔB = 2.9 mag. H
 , Hδ, and Hγ have already faded. Moreover, the coronal lines [Fe x] 6375 Å and [Fe vii] 6087 Å were clearly present in the first red spectrum at t = 161.1 days as shown in Figure 22. The Balmer lines are still stronger than [O iii] 5007 Å, however, and they present a multi-peak structure. [O iii] 5007 was the strongest rival to the Balmer lines at t = 165.1 days. The emission of [O iii] and N iii was strongest again at t = 221.9 days. The last spectroscopic observation was made at t = 249.9 days where the nova was clearly in the nebular spectrum stage and still exhibited [N ii], He i, [Fe vii], and [Fe x] lines.

Figure 13. Detection of high-ionization lines (e.g., O iii and N iii) present in red spectra (top) and in blue spectra (bottom) during the initial rise (t = 0.8–2.7 days). Spectra show the observed flux in each case.
Download figure:
Standard image High-resolution image
Figure 14. Blue spectra during the pre-maximum halt phase. Spectra are offset in flux for clarity with the spectrum at 4.7 days representing the observed flux and the later spectra being offset in steps of 1 × 10⁻¹¹ erg cm−2 Å−1.
Download figure:
Standard image High-resolution image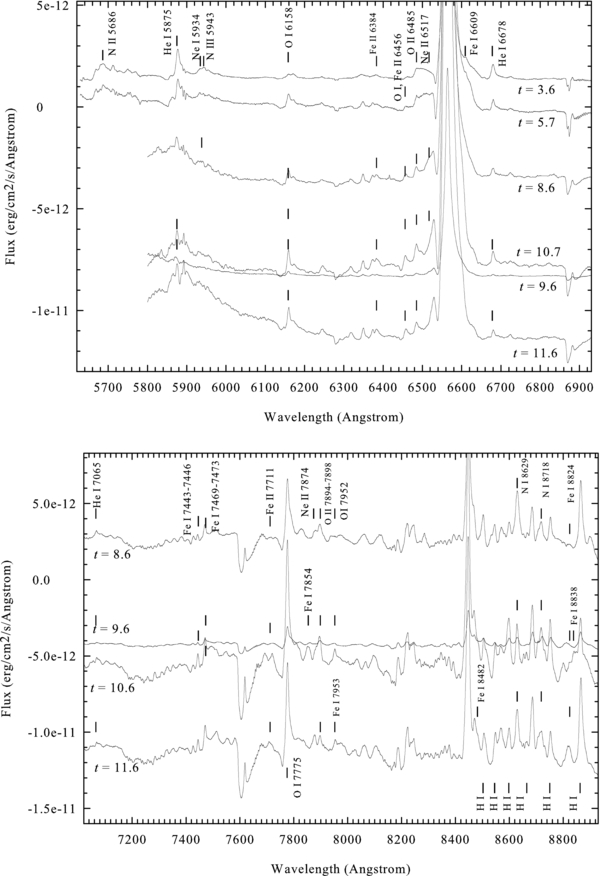
Figure 15. Red spectra during the pre-maximum halt phase. Spectra are offset for clarity in flux with the spectrum at 3.6 days (top panel) and 8.6 days (bottom panel) representing the observed flux and the later spectra being offset in steps of 3 × 10⁻¹² and 5 × 10⁻¹² erg cm−2 Å−1 in each figure, respectively.
Download figure:
Standard image High-resolution image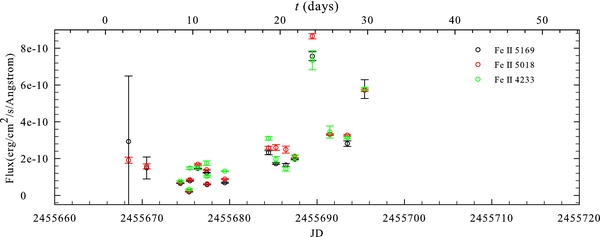
Figure 16. Evolution of the flux of Fe ii lines at 5169, 5018, and 4233 Å.
Download figure:
Standard image High-resolution image
Figure 17. Blue spectra during the final rise phase. Spectra are offset in flux for clarity with the spectrum at 13.7 days representing the observed flux and the later spectra being offset in steps of 1 × 10⁻¹¹ erg cm−2 Å−1.
Download figure:
Standard image High-resolution image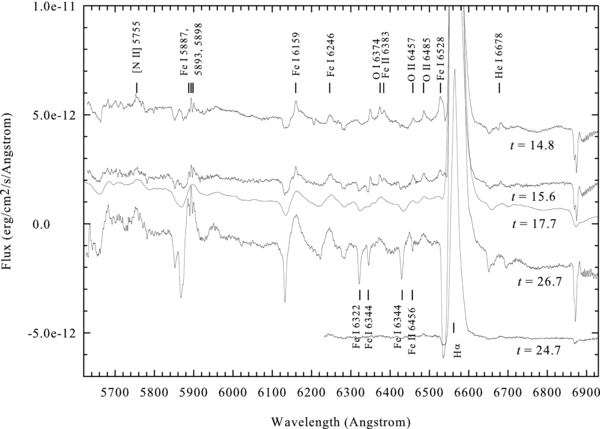
Figure 18. Red spectra during the final rise phase. Spectra are offset in flux for clarity with the spectrum at 14.8 days representing the observed flux and the later spectra being offset in steps of 2 × 10⁻¹² erg cm−2 Å−1.
Download figure:
Standard image High-resolution image
Figure 19. Blue spectra during the early decline phase. Spectra are offset in flux for clarity with the spectrum at 27.7 days representing the observed flux and the later spectra being offset in steps of 1 × 10⁻¹¹ erg cm−2 Å−1.
Download figure:
Standard image High-resolution image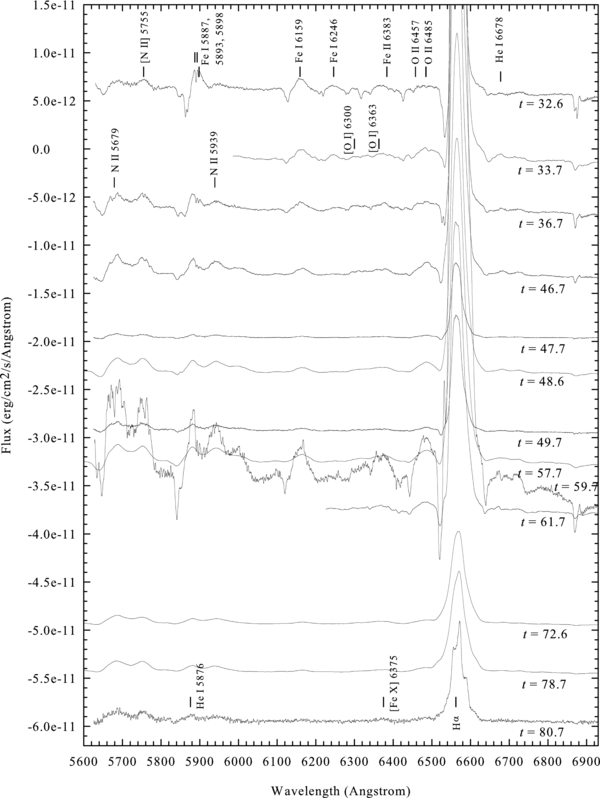
Figure 20. Red spectra during the early decline phase. Spectra are offset in flux for clarity with the spectrum at 32.6 days representing the observed flux and the later spectra being offset in steps of 1 × 10⁻¹¹ erg cm−2 Å−1.
Download figure:
Standard image High-resolution image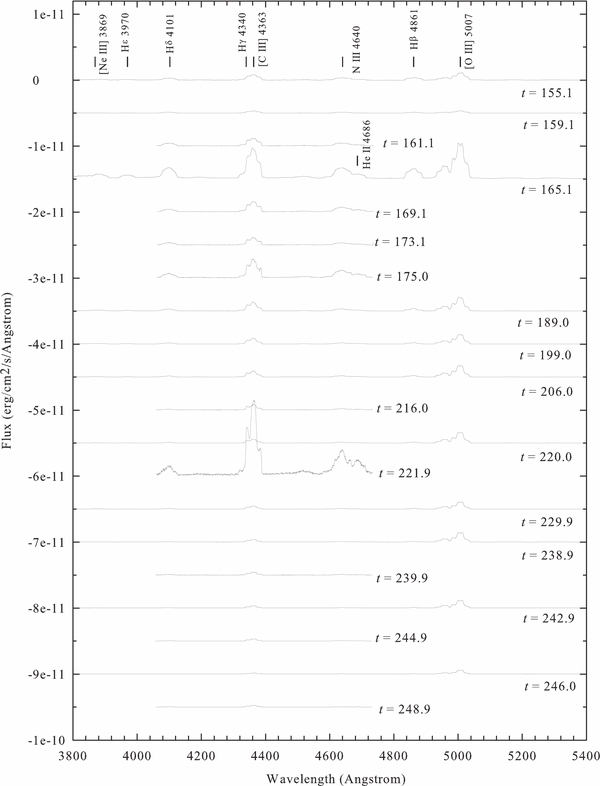
Figure 21. Blue spectra during the transition phase. Spectra are offset in flux for clarity with the spectrum at 155.1 days representing the observed flux and the later spectra being offset in steps of 5 × 10⁻¹² erg cm−2 Å−1.
Download figure:
Standard image High-resolution image
Figure 22. Red spectra during the transition phase. Spectra are offset in flux for clarity with the spectrum at 161.1 days representing the observed flux and the later spectra being offset in steps of 2 × 10⁻¹³ erg cm−2 Å−1 for the left panel and steps of 1 × 10⁻¹² erg cm−2 Å−1 for the right panel.
Download figure:
Standard image High-resolution imageTable 3. Ionization Levels at Various Decline Stages According to Bath & Harkness (1989; Only Species with Strong Optical Lines are Noted)
| ΔB | B | Element Ionization Level | t | Teff |
|---|---|---|---|---|
| (days) | (K) | |||
| 1.45 | 7.78 | O ii | 2.7, 3.6–13.6, 33.7–61.7 | 30,000 |
| 1.55 | 7.88 | N ii | 2.7, 3.6–10.7, 36.7–80.8 | 33,000 |
| 2.85 | 9.18 | N iii | 0.8–2.7, 5.7, 8.6, 73.7, 155.1–221.9 | 110,000 |
| 3.15 | 9.48 | O iii | 0.8–1.7, [45.6]a–246 | 145,000 |
| 4.85 | 11.18 | N v | 73.7 (N v 4603 Å) | 700,000 |
Note. aMarginally detected at this time.
Download table as: ASCIITypeset image
Table 4. High-ionization Lines and Some Lower Ionization Lines Present in the Spectra of T Pyx 2011 in Its Initial Rise and Pre-maximum Halt Phases
| High-excitation Lines | Ionization Potential | λ | Days Since Discovery | |
|---|---|---|---|---|
| (eV) | (Å) | First Detected | Last Detected | |
| O iii | 54.90 | 4435.0 | 1.7 | 2.7 |
| C iii | 47.90 | 4651.4 | 1.7 | 3.6 |
| 6167.5 | 0.8 | 3.6 | ||
| 6727.0 | 0.8 | 3.6 | ||
| N iii | 47.24 | 5943.0a | 0.8 | 5.7 |
| 6487.0b | 0.8 | 8.6 | ||
| Ne ii | 41.00 | 4713.4 | 1.7 | 2.7 |
| 5178.5c | 1.7 | 2.7 | ||
| O ii | 35.10 | 4676.2 | 2.7 | 9.7 |
| N ii | 29.60 | 5045.0 | 1.7 | 2.7 |
| 5686.2 | 3.6 | 10.7 | ||
| 5938.0 | 3.6 | 11.6 | ||
| He i | 24.60 | 4120.8 | 2.7 | 8.6 |
| 5875.6 | 0.8 | 14.8 | ||
| 6678.1 | 0.8 | 14.8 or 26.7? | ||
| 7065.2 | 1.7 | 17.7 | ||
| Ne i | 21.60 | 4663.5 | 2.7 | 9.7 |
| 5156.6 | 2.7 | 8.6 | ||
| 5684.6 | 0.8 | 3.6 | ||
| 5934.4 | 0.8 | 8.6 | ||
| 6213.8 | 0.8 | 0.8 | ||
Notes. aN iii 5943 Å + Ne i 5934 Å could account for N ii 5938 Å. bCould also be N ii 6487 Å. cCould also be Mg i 5178 Å.
Download table as: ASCIITypeset image
4. COMPARISON TO THE X-RAY AND RADIO LIGHT CURVES
Figure 23 shows the optical light curves from AAVSO and SMEI, together with the expected appearance of various spectral lines from Bath & Harkness (1989), the X-ray light curve from Swift, and the radio light curves from the Very Large Telescope as presented in Nelson et al. (2014). During the pre-maximum halt phase in the SMEI light curve, the rise of the high-frequency (33 GHz) radio emission was detected at t = 7–15 days but X-rays were not yet detected. During the final rise through the early decline (until t ∼ 45 days), radio emission at all frequencies tended to be stable with a small trend of increase during the optical decline. At t ∼ 45 days, [O iii] 5007 Å appeared, and while the radio emission subsequently rose steeply, the X-rays were still not detected.

Figure 23. Comparison between optical, radio, and X-ray light curves with the top panel also indicating the expected appearance of various ionized species from the models of Bath & Harkness (1989). Shaded areas represent the epochs where we do not have spectroscopic coverage. The early evolution of the radio flux is shown in the inset in the bottom panel with a logarithmic flux scale for clarity.
Download figure:
Standard image High-resolution image
The Swift satellite detected the rise of X-ray emission (0.3–10 keV) at t = 111 days, at ΔV ∼ 4 mag below peak. From Equation (1), Teff would be ∼320,000 K. This is typical for an SSS (see Kahabka 2006). Taking Lbol ∼ 2 × 1038 erg s−1, calculated from Mbol = −7.0 given by Schaefer (2010), the approximate radius of the pseudo-photosphere at this time would be 5.1 × 109 cm. As expected, this is smaller than the binary separation calculated from the binary parameters given in Uthas et al. (2010) as 6.1 × 1010 cm, but larger than the radius of ∼4.9 × 108 cm of a 1 M☉ WD (Starrfield et al. 2012). We note that although the Chandra grating spectra at this phase showed that emission lines were very strong in the X-ray spectrum (Orio 2012), the SSS continuum was detected in the grating spectra at t = 210 days by Tofflemire et al. (2013), consistent with emission from a WD using a model atmosphere temperature ∼420,000 K. The X-ray emission at this time appears to be a mix of an SSS and shocked circumstellar gas (probably from intra-ejecta shocks; Tofflemire et al. 2013).
The X-ray emission then rose to a peak at t ∼ 144 days (Kuulkers et al. 2011). This is consistent with the appearance of lines from highly ionized species, such as [Ne iii] 3869 Å, [C iii] 4364 Å, and N iii 4640 Å, that we found in the first blue spectrum (t = 155.1 days) right after the seasonal gap. The presence of the N iii line was expected sometime between 85 and 90 days in the seasonal gap according to ΔB (Bath & Harkness 1989), although N iii+ N ii 4640 Å was detected slightly earlier at 73.7 days. By the time of the rise in X-rays, H, Hδ, and Hγ had already faded.
The clear presence of the coronal lines [Fe vii] 6087 Å and [Fe x] 6375 Å at t = 161.1 days coincides with the middle of the X-ray plateau phase and also the peak of the radio emission (see below). The X-ray emission observed by Swift again became undetectable at t ∼ 222 days, but Chandra observations still detected the composite line and continuum X-ray spectrum on t = 235 days, though they were at least 50% lower in flux than on t = 210 days (Tofflemire et al. 2013). The blue optical spectrum at t = 221.9 days shows the strongest emission to be [C iii] 4364 Å and N iii 4640 Å.
The radio light curve kept increasing throughout the X-ray rise and peaked at around t ∼ 155 days for the highest frequency (37 GHz) corresponding to the middle of the plateau in the X-ray light curve. In contrast, the lowest frequency (1.25 GHz) seemed to reach its peak at t = 290–330 days. Nelson et al. (2014) suggested that it was the material ejected during the 2011 outburst that gave rise to the radio emission, not the ionization of a pre-existing circumbinary medium. They note that although the resolved pre-outburst Hα+[N ii] emitting nebula surrounding T Pyx could be conceived to cause the rise (t ∼ 62–149 days) and fade of the radio light curve, the observed Hα luminosities during the outburst are much too low to be consistent with this. In addition, they concluded that dense material in the immediate vicinity of the central binary should have similar characteristics to a stellar wind and, therefore, exhibit a partially optically thin radio spectrum while the observed spectrum during the rise appears to be completely optically thick (Nelson et al. 2014).
5. CONCLUSIONS
We investigated the optical light curve of T Pyx in its 2011 outburst by compiling a database of SMEI and AAVSO observations.
- 1.The SMEI light curve, providing unprecedented detail with high-cadence data, was divided into four phases based on the idealized nova optical light curve: the initial rise, the pre-maximum halt, the final rise, and the early decline.
- 2.A period of 1.44 ± 0.05 days was the most strongly detected and was found in the interval from the first observation to the end of the pre-maximum halt phase, before the visual maximum. We compared this result to oscillations found in CVs and ascribed to accretion disk precession (Hirose & Osaki 1990). Our observed Porb/Pprecession is then 5.3%, corresponding to q = 0.125–0.15, compared to q = 0.2 ± 0.03 derived by Uthas et al. (2010). Although the period is in line with that expected from studies of disk precession in CVs, we question whether the disk would be present so early in the outburst. Such oscillations are present in some of the light curves derived by Hillman et al. (2014) from TNR models and may be related to restructuring and rebalancing the ejected envelope as it expands. However, we find no spectral variations related to the light curve periodicity.
- 3.The pre-maximum halt and subsequent dip in the SMEI light curve at t ∼ 22–24 days again resemble features in the light curves produced by Hillman et al., with the latter possibly mirroring the shorter duration feature seen in other novae observed by SMEI (Hounsell et al. 2010). We note that this is coincident with a sharp transitory decline in Hα flux and an equally sharp increase in that from Fe ii.
The spectra from the LT and SMARTS were investigated through each of the four phases of the optical light curve, in order to study the spectral evolution and investigate the physical causes of the variations of the light curve. We conclude, taking each phase in turn.
- 1.Initial rise (t = 0.8–3.3 days). The spectra show lines of high-ionization species consistent with the presence of a high effective temperature pseudo-photosphere. The emission comes almost entirely from the continuum in the "fireball" stage. The marked drop in the derived expansion velocity (4000 km s−1 at t = 0.8 days to ∼2000 km s−1 at t = 2.7 days) is consistent with the initial ejection in the form of a Hubble flow, but also resembles that noted in Type Ia SNe and ascribed to interaction with pre-outburst material.
- 2.Pre-maximum halt (t = 3.6–13.7 days). The subsequent change in behavior of the derived Vej during the pre-maximum halt phase may suggest two different stages of mass loss: a short-lived phase occurring immediately after outburst, followed by a more steadily evolving and higher mass loss phase. The fireball spectrum is maintained until t = 8.6 days, which is also the beginning of the typical iron curtain stage. Overall, the ionization/excitation and effective temperature of the underlying pseudo-photosphere appear to be decreasing through this phase, in line with basic models.
- 3.Final rise (t = 14.7–27.9 days). The typical principal spectrum of CNe seems to be apparent and displays the O i flash beginning at t ∼ 17 days with the characteristics of the iron curtain phase still persisting. The gradual increase in Vej, starting to appear in the final rise (t = 14.8 days) and later, may be related to increasing ejection velocities from the central system, as proposed for other novae. The visual maximum at t = 27.9 days seems to exhibit the lowest ionization lines, as expected.
- 4.Early decline (t = 27.9–90 days). The Balmer lines began to have a double-peaked structure at t = 42.7 days, shortly followed by the emergence of forbidden lines. The typical Orion spectrum is suggested to start at t ∼ 70 days. The emission line of N v at 4603 Å begins to emerge at t = 73.7 days. The strong enhancement of N lines is associated with "nitrogen flaring" in the typical Orion spectrum stage.
- 5.Transition to the nebular phase (t = 90–280 days). By this time, the [O iii] 5007 Å nebular and [Fe x] 6375 Å coronal lines have developed, the latter having been marginally detected at t = 80 days, while the rise in the X-ray light curve was detected at t = 111 days. The last spectroscopic observation reported here at t = 249.9 days in the nebular stage still exhibited [N ii], He i, [Fe vii], and [Fe x] lines.
The overall spectral development of T Pyx is similar to that of CNe whose ejected mass is higher and velocity of ejection is lower than in typical RNe, such as U Sco and RS Oph. We also found that in general the detected ionized elements are in line with those expected from the simple pseudo-photosphere models of Bath & Harkness (1989) at the same ΔB as shown in Table 3 and Figure 23. An exception to this occurred near the end of the early decline phase, where emission lines, e.g., the N iii and N v emission lines, emerged earlier than would have been predicted.
In terms of the relationship of the optical development described here to that at other wavelengths, we found the following.
- 1.The rise of the high-frequency (33 GHz) radio emission was detected at t = 7–15 days during the pre-maximum halt phase in the SMEI light curve, while X-rays were not yet detected.
- 2.At t ∼ 45 days, where the [O iii] 5007 Å was first present, the radio emission rose steeply while the X-rays were still undetectable.
- 3.The rise in the X-ray emission, which began at t = 111 days and rose to peak at t ∼ 144 days (Kuulkers et al. 2011), is consistent with the appearance of lines from highly ionized species such as [Ne iii] 3869 Å, [C iii] 4364 Å, and N iii 4640 Å, found in the first blue spectrum (t = 155.1 days) right after the seasonal gap.
- 4.If the onset of the X-ray phase and the start of the final decline in the optical are related to the cessation of significant mass loss, this occurred at t ∼ 90–110 days.
- 5.During the rise in X-rays, the radio flux kept increasing and peaked at around t ∼ 155 days for the highest frequency (37 GHz) corresponding to the middle of the plateau in the X-ray light curve where we clearly detected the coronal lines [Fe x] 6375 Å and [Fe vii] 6087 Å in our spectra (t = 161.1 days).
- 6.Although the appearance of the X-ray emission is in line with predictions of the emergence of the SSS from the simple Bath & Harkness (1989) model, we note that X-ray emission may be a mix of SSS and shocked circumstellar gas.
We thank Kim Page for supplying the X-Ray Telescope light curve, which was created from observations obtained by the Swift nova-CV group (http://www.swift.-ac.uk/nova-cv/); Laura Chomiuk for supplying the EVLA radio data; and Bernard Jackson, Paul Hick, Andrew Buffington, and John M. Clover of the SMEI group at University California San Diego (UCSD) for assistance with work on the SMEI database. We also thank Sumner Starrfield and an anonymous referee for valuable comments on an earlier version of the manuscript.
Footnotes
- 4
Available online at http://www.astro.sunysb.edu/fwalter/SMARTS/NovaAtlas/tpyx/tpyx.html.
- 5
IRAF is distributed by the National Optical Astronomy Observatory, which is operated by the Association of Universities for Research in Astronomy, Inc., under cooperative agreement with the National Science Foundation.
- 6
Online data of the SMEI sky map are available at http://smei.ucsd.edu/sky/index.html.
- 7
Available online at http://www.univie.ac.at/tops/Period04/.
- 8
The section (about emission lines of N ii in novae) published in the book is available at http://ned.ipac.caltech.edu/level5/Glossary/Jaschek/N.html.