


ABSTRACT
We present the results of a new VLA H i Imaging survey of Virgo galaxies, the VLA Imaging survey of Virgo galaxies in Atomic gas (VIVA). The survey includes high-resolution H i data of 53 carefully selected late type galaxies (48 spirals and five irregular systems). The goal is to study environmental effects on H i gas properties of cluster galaxies to understand which physical mechanisms affect galaxy evolution in different density regions, and to establish how far out the impact of the cluster reaches. As a dynamically young cluster, Virgo contains examples of galaxies experiencing a variety of environmental effects. Its nearness allows us to study each galaxy in great detail. We have selected Virgo galaxies with a range of star formation properties in low to high density regions (at projected distances from M87, d87 = 0.3–3.3 Mpc). Contrary to previous studies, more than half of the galaxies in the sample (∼60%) are fainter than 12 mag in BT. Overall, the selected galaxies represent the late type Virgo galaxies (S0/a to Sd/Irr) down to mp ≲ 14.6 fairly well in morphological type, systemic velocity, subcluster membership, H i mass, and deficiency. The H i observations were done in C short (CS) configuration of the VLA radio telescope, with a typical spatial resolution of 15'' and a column density sensitivity of ≈3–5 × 1019 cm−2 in 3σ per 10 km s−1 channel. The survey was supplemented with data of comparable quality from the NRAO archive, taken in CS or C configuration. In this paper, we present H i channel maps, total intensity maps, velocity fields, velocity dispersions, global/radial profiles, position–velocity diagrams and overlays of H i/1.4 GHz continuum maps on the optical images. We also present H i properties such as total flux (SH i), H i mass (MH i), linewidths (W20 and W50), velocity (VH i), deficiency (defH i), and size (DeffH i and DisoH i), and describe the H i morphology and kinematics of individual galaxies in detail. The survey has revealed details of H i features that were never seen before. In this paper, we briefly discuss differences in typical H i morphology for galaxies in regions of different galaxy densities. We confirm that galaxies near the cluster core (d87 ≲ 0.5 Mpc) have H i disks that are smaller compared to their stellar disks (DH i/D25 < 0.5). Most of these galaxies in the core also show gas displaced from the disk, which is either currently being stripped or falling back after a stripping event. At intermediate distances (d87 ∼ 1 Mpc) from the center, we find a remarkable number of galaxies with long one-sided H i tails pointing away from M87. In a previous letter, we argue that these galaxies are recent arrivals, falling into the Virgo core for the first time. In the outskirts, we find many gas-rich galaxies, with gas disks extending far beyond their optical disks. Interestingly, we also find some galaxies with H i disks that are smaller compared to their stellar disks at large clustercentric distances.
Export citation and abstract BibTeX RIS
1. INTRODUCTION
It has long been known that cluster galaxies appear to be different from field galaxies in their morphological type and color (e.g., Hubble & Humason 1931). In the local universe, ∼90% of the population in the core regions of rich clusters consists of ellipticals and S0's, while spirals dominate in the field (Dressler 1980). This could mean either that galaxies form differently in dense environments or that galaxies are affected by their surroundings. Many mechanisms could drive environmental evolution. For example, ram pressure stripping (Gunn & Gott 1972), turbulent/viscous stripping (Nulsen 1982), thermal evaporation (Cowie & Songaila 1977), starvation (Larson et al. 1980), interaction with the cluster potential (Bekki 1999), harassment, the cumulative effect of many fast interactions (Moore et al. 1996), slow interactions between individual galaxies (Mihos 2004), and mergers.
Single dish 21 cm observations, such as those conducted by Davies & Lewis (1973), Chamaraux et al. (1980), and Giovanelli & Haynes (1985), have found that spirals near the cluster core regions are very deficient in neutral atomic hydrogen gas, H i, compared to galaxies of the same morphological type and size in the field. Giovanelli & Haynes (1985) first showed that not only the gas content but also the size of the gas disks is affected. Subsequent H i imaging studies of nearby clusters, such as Virgo and Coma (Warmels 1988a; Cayatte et al. 1990; Bravo-Alfaro et al. 2000), showed that the H i disks of the highly H i deficient galaxies are severely truncated to within the stellar disk. These images of unperturbed stellar disks with highly truncated gas disks strongly suggest that galaxies lose their interstellar gas (ISM) through an interaction with the hot intracluster medium (ICM).
However, there are still remaining questions. Dressler (1980) already pointed out that ram pressure stripping by the hot ICM alone cannot be responsible for the transformation of spirals into S0's. The morphology–density relation changes very smoothly, a significant fraction of S0's reside in low-density environment, and the bulge to disk ratios of S0's are systematically larger in all density regimes. This cannot be caused by simple ISM stripping. More recently, in a study of 18 nearby clusters, Solanes et al. (2001) show that the H i deficiency decreases gradually with an increasing projected distance from the cluster center out to ∼2 Abell radii (≈3 h−1 Mpc). A similar trend is found in star formation rate, which begins to decrease at a clustercentric radius of 3–4 virial radii or 1.5 Abell radii (e.g., Lewis et al. 2002; Gómez et al. 2003). These results suggest that galaxies are already modified in much lower density environments, where ram pressure is expected to be unimportant. Now the question has become: how exactly are galaxies affected in different density regions? That is, how far out do galaxies feel the impact of the cluster, which mechanisms are at work in lower density environments, and what are the dominant environmental effects onto disks that galaxies experience as they come closer to the cluster center?
In order to answer these questions, we have probed the cluster environment using high-resolution H i data on a sample of carefully selected Virgo galaxies. H i gas is often a good tracer of different physical processes as it gets affected by both the ICM and gravitational interactions. Also, the outer gas disk is mostly in atomic form, where it is more vulnerable to its surroundings. In addition, it provides useful diagnostics for galaxy evolution as it is the fuel for star formation. The H i data were taken using the VLA.6 The VLA has had significant improvements since the previous Virgo survey. The L-band (20 cm) receivers have been replaced, and the C array has been replaced by the C short (CS) configuration. Our high resolution, high sensitivity VLA H i data allow us to investigate not only the evolutionary history of individual galaxies but also the overall impact of Virgo on its members.
Several results of the survey and a preceding pilot for the survey have already been published. Kenney et al. (2004) and Vollmer et al. (2004b) present an analysis of the data on NGC 4522, a galaxy far away from M87, yet stripped to well within its optical disk and showing abundant evidence of ongoing stripping. They suggest that NGC 4522 possibly shows evidence of enhanced ram pressure due to bulk motions or the substructure of the ICM. Crowl et al. (2005) present H i, radio continuum, and high quality optical images of the edge-on galaxy NGC 4402, which shows evidence for dense cloud ablation. One of the striking results of the survey is a number of one-sided long H i tails pointing away from the cluster center and at intermediate distances from M87. Chung et al. (2007) argue that these are probably galaxies that have recently arrived near the cluster and are falling into the cluster for the first time. Some of our data have already been used to constrain simulations of individual systems, for example, on NGC 4522 (Vollmer et al. 2006) and NGC 4501 (Vollmer et al. 2008).
In this work, we present the complete H i atlas and describe the H i properties of individual galaxies in detail. In a second paper, we will present a statistical analysis of our results and discuss the impact of the different environmental effects.
This paper is organized as follows. In Section 2, we describe our selection criteria and present the general properties of the sample. In Section 3, we present the observations and data reduction. In Section 4, we describe the H i atlas, which is appended at the end. In Section 5, we measure H i quantities such as mass, linewidth, velocity, deficiency, and size, and we compare our H i fluxes with values found in the literature. We then present our main findings on H i morphology in Section 6, followed by a summary of the main results in Section 7. In the appendix, we present the full H i atlas and comments on individual galaxies. Throughout this paper, we assume that the distance to Virgo is 16 Mpc (Yasuda et al. 1997).
2. SAMPLE
2.1. The Virgo Cluster
Virgo is the nearest rich galaxy cluster. Binggeli et al. (1985) have cataloged 2096 galaxies (Virgo Cluster Catalog (VCC)) in ∼140 deg2 area centered on α, δ1950 = 12h25m, 13° (∼1 degree northwest of M87). About 1300 galaxies have been identified as true members based on the morphological appearance and the measured radial velocities. The X-ray emission from the hot cluster gas (Böhringer et al. 1994) shows plenty of substructures, indicating that Virgo is far from being virialized, but instead is still growing as several subclusters (the M86 and M49 group) merge into the main cluster around M87. The velocities and the surface brightness fluctuation (SBF) distances of M87, M86, and M49, which are noted in black in Figure 1, are 1307, −244, and 997 km s−1 (Smith et al. 2000), and 16.1, 18.4 (West & Blakeslee 2000), and 16.3 Mpc (Ferrarese et al. 2003), respectively. The M86 group is falling in from the back, and M49 is likely to be merging with the M87 group, falling in from the south plane of the sky (Tully & Shaya 1984; Schindler et al. 1999). For more detailed discussions of the three-dimensional structure of the Virgo cluster, see, for example, Gavazzi et al. (1999) and Mei et al. (2007).

Figure 1. VIVA galaxies are shown at their proper positions with NGC (N), IC (I), or VCC (V) names. Each galaxy is indicated by an ellipse which represents D25 × 10 and is drawn using the P.A. and the inclination measured in the optical B band. Galaxies are color coded based on the star formation properties classified in the Hα study by Koopmann & Kenney (2004b), except for light gray, which indicates the ones not included in the sample of Koopmann & Kenney (2004a, 2004b). Six big ellipticals are shown in large black dots (M85, M86, M84, M87, M60, and M49, in order of decreasing declination).
Download figure:
Standard image High-resolution imageSince Virgo is nearby, it is an ideal target for H i imaging studies, and two major imaging surveys were done in the past. Warmels (1988a) and Cayatte et al. (1990) have mapped 15 and 25 bright Virgo spirals with the Westerbork Synthesis Radio Telescope (WSRT) and the VLA, respectively. Those studies have shown that the H i disks of the central galaxies are truncated to well within the optical disks, making it likely that ICM–ISM interactions are at least partly responsible for driving the evolution of galaxies in the inner region of the cluster. Here, we present the results of a new survey that includes twice as many galaxies, covers a much wider range in galaxy mass, and probes the lower density outer regions as well as the high-density core.
2.2. VIVA Sample
Koopmann & Kenney (2004a) studied the Hα morphology of 84 Virgo galaxies, including fainter spirals which had not been extensively studied. Using R-band and Hα surface brightness profiles, Koopmann & Kenney (2004b) classified the star formation properties of these 52 Virgo galaxies into several categories: normal, anemic, enhanced, and truncated. They argue that these categories are likely to reflect different evolutionary phases and different types of interactions with the cluster environment. Since we wanted to sample galaxies undergoing different environmental effects, we have selected 46 Virgo galaxies showing a range of star formation properties based on Koopmann & Kenney (2004b)'s classification.
The survey also probes both the high and the low density regions, covering angular distances of ∼1°–12° from M87. At a distance of 16 Mpc, this corresponds to 0.3–3.3 Mpc. Thus we probe galaxies out to a distance of ∼1.6 Abell radii (rA ∼ 1.5 h−1 Mpc and H0 = 71 km s−1 Mpc−1; Spergel et al. 2003) or four virial radii (rvir ∼ 0.8 Mpc for Virgo; Tully & Shaya 1984).
In addition, we selected two galaxies that are not in the Koopmann & Kenney (2004a, 2004b) sample. These two galaxies, NGC 4330 and IC 3418, show morphological peculiarities in the UV (the GALEX nearby galaxy survey). NGC 4330 is a highly inclined disk galaxy and has a warped UV tail extending beyond the optical disk on one side. IC 3418 is optically a low surface brightness system, which shows in UV a displacement from the optical disk with an extended broad UV tail on one side.
Lastly, we have included five galaxies that were found in the H i data cubes of our targets, i.e., they are spatially and in velocity close to the target galaxies, bringing the total number of galaxies in the VIVA sample to 53.
In Figure 1, we show the locations of 53 selected galaxies. The different colors represent different star formation properties. In Figure 2, the optical and the UV images of the two galaxies that were not studied by Koopmann & Kenney (2004a, 2004b) are shown. The general properties of the 53 galaxies are summarized in Table 1. Note that more than half of the VIVA sample is fainter than 12 mag in BT. Fainter galaxies appear to be more disturbed in Hα and may be more vulnerable to environmental effects than more massive systems.

Figure 2. Two galaxies, NGC 4330 and IC 3418, have been selected based on the peculiarities in the UV. The Digitized Sky Survey (DSS) image is shown on the left and the GALEX image at far-ultra-violet wavelength (λcenter = 1530 Å) is shown on the right. Note that NGC 4330 has the UV tail to the southwest where we do not find an optical counterpart. The UV emission of IC 3418 is displaced from the optical center and also shows a long UV stream (>2') to the southeast.
Download figure:
Standard image High-resolution imageThe VIVA sample probes the full range of the Virgo late-type galaxy population. In Figure 3, we compare the general properties of the VIVA sample to those of a sample of 165 late-type (Sa-Im-BCD) Virgo galaxies that is complete to mp ⩽ 14.6. The comparison sample is selected from a larger sample of 355 late-type Virgo galaxies, which is complete to mp ⩽ 18.0 (Gavazzi et al. 2005). We have observed 32% of the galaxies in the complete sample of late-type galaxies brighter than mp = 14.6 (Gavazzi et al. 2005, ARECIBO-05 hereafter), including 75% of the galaxies with mp ⩽ 12, 40% of the galaxies with mp = 12–13, and eight galaxies that are fainter than mp > 13. We have good coverage over all velocity bins and all morphological types S0/a-Sd. Based on the subcluster membership classification by Gavazzi et al. (1999), all but three of the selected galaxies belong to the A, E, S, and N subclusters, and are likely to be true members of the cluster. Based on an Hα rotation curve and the H-band Tully–Fisher relation, Gavazzi et al. (1999) found that NGC 4380 might belong to the B cloud, which is located at 23 Mpc. The distances to NGC 4424 and NGC 4189 are highly uncertain, but note that Cortés et al. (2008), using a stellar kinematics-based Tully–Fisher distance, found that NGC 4424 does belong to the Virgo Cluster. It remains true that distances to some of the individual galaxies in Virgo are controversial (Yasuda et al. 1997; Solanes et al. 2002). The VIVA sample also covers a wide range of H i mass and deficiency.

Figure 3. Statistics of the global properties of the VIVA sample compared to the ARECIBO-05 sample (Gavazzi et al. 2005). The VIVA sample of 53 galaxies is fairly representative for the late-type Virgo galaxies down to mp ≈ 14.6 in morphological type, velocity distribution, and H i properties. Almost all of the selected galaxies are likely to be true members of the cluster.
Download figure:
Standard image High-resolution imageTable 1. VIVA Sample and General Properties
| Galaxy | VCC | α2000 | δ2000 | Type | D25 | BT | P.A. | i | V | dM87 | SF |
|---|---|---|---|---|---|---|---|---|---|---|---|
| (hhmmss.s) | (ddmmss) | (') | (mag) | (deg) | (deg) | (km s−1) | (deg) | ||||
| (1) | (2) | (3) | (4) | (5) | (6) | (7) | (8) | (9) | (10) | (11) | (12) |
| NGC 4064 | ... | 12 04 10.8 | +18 26 34 | SB(s)a: pec | 4.37 | 12.22 | 150 | 69 | 1000 | 9.0 | T/C |
| NGC 4189 | 89 | 12 13 46.8 | +13 25 36 | SAB(rs)cd | 2.40 | 12.51 | 66c | 45 | 1995 | 4.4 | N |
| NGC 4192 | 92 | 12 13 48.2 | +14 53 43 | SAB(s)ab | 9.77 | 10.95 | 155 | 78 | −126 | 4.9 | N |
| NGC 4216 | 167 | 12 15 53.1 | +13 08 58 | SAB(s)b | 8.13 | 10.99 | 19 | 85 | 30 | 3.8 | ... |
| NGC 4222* | 187 | 12 16 22.7 | +13 18 31 | Sd | 3.31 | 13.86 | 56 | 90 | 225 | 3.7 | ... |
| NGC 4254 | 307 | 12 18 49.4 | +14 25 07 | SA(s)c | 5.37 | 10.44 | 68c | 30 | 2453 | 3.6 | N |
| NGC 4293 | 460 | 12 21 13.0 | +18 22 58 | (R)SB(s)0 | 5.62 | 11.26 | 72 | 65 | 717 | 6.5 | T/A |
| NGC 4294 | 465 | 12 21 17.4 | +11 30 40 | SB(s)cd | 3.24 | 12.53 | 155 | 70 | 421 | 2.5 | N |
| NGC 4298 | 483 | 12 21 32.7 | +14 36 25 | SA(rs)c | 3.24 | 12.04 | 140 | 57 | 1122 | 3.2 | T/N |
| NGC 4299 | 491 | 12 21 40.6 | +11 30 15 | SAB(s)dm | 1.74 | 12.88 | 42c | 22 | 209 | 2.5 | T/E |
| NGC 4302 | 497 | 12 21 42.5 | +14 36 05 | Sc | 5.50 | 12.50 | 178 | 90 | 1111 | 3.2 | ... |
| NGC 4321 | 596 | 12 22 55.2 | +15 49 23 | SAB(s)bc | 7.41 | 10.05 | 30 | 33 | 1579 | 4.0 | T/N |
| NGC 4330 | 630 | 12 23 16.5 | +11 22 06 | Scd? | 4.47 | 13.09 | 59 | 90 | 1567 | 2.1 | * |
| NGC 4351 | 692 | 12 24 01.8 | +12 12 24 | SB(rs)ab: pec | 1.20 | 13.03 | 61c | 49 | 2388 | 1.7 | T/N |
| NGC 4380 | 792 | 12 25 22.2 | +10 00 57 | SA(rs)b | 3.47 | 12.66 | 153 | 58 | 935 | 2.7 | T/A |
| NGC 4383 | 801 | 12 25 25.6 | +16 28 12 | Sa: pec | 1.95 | 12.67 | 13c | 60 | 1663 | 4.3 | E |
| NGC 4388 | 836 | 12 25 47.0 | +12 39 42 | SA(s)b | 5.62 | 11.76 | 92 | 83 | 2538 | 1.3 | ... |
| NGC 4394 | 857 | 12 25 56.1 | +18 12 54 | (RS)B(r)b | 3.63 | 11.73 | 113c | 28 | 772 | 5.9 | A |
| NGC 4396 | 865 | 12 25 59.3 | +15 40 19 | SAd | 3.31 | 13.06 | 125 | 77 | −133 | 3.5 | ... |
| NGC 4405 | 874 | 12 26 07.5 | +16 10 50 | SA(rs)0 | 1.78 | 13.03 | 20 | 51 | 1751 | 4.0 | T/N |
| NGC 4402 | 873 | 12 26 07.9 | +13 06 46 | Sb | 3.89 | 12.55 | 90 | 78 | 190 | 1.4 | ... |
| IC 3355* | 945 | 12 26 50.0 | +13 10 36 | Im | 1.12 | 15.18 | 172 | 68 | 127 | 1.3 | ... |
| NGC 4419 | 958 | 12 26 56.9 | +15 02 52 | SB(s)a | 3.31 | 12.08 | 133 | 74 | −224 | 2.8 | T/A |
| NGC 4424 | 979 | 12 27 11.5 | +09 25 15 | SB(s)a | 3.63 | 12.34 | 95 | 62 | 447 | 3.1 | T/C |
| NGC 4450 | 1110 | 12 28 29.4 | +17 05 05 | SA(s)ab | 5.25 | 10.90 | 175 | 43 | 2048 | 4.7 | T/A |
| IC 3392 | 1126 | 12 28 43.7 | +15 00 05 | SAb | 2.29 | 12.99 | 40 | 67 | 1678 | 2.7 | T/N |
| NGC 4457 | 1145 | 12 28 59.3 | +03 34 16 | (R)SAB(s)0 | 2.69 | 11.76 | 82c | 33 | 738 | 8.8 | T/N |
| IC 3418 | 1217 | 12 29 43.5 | +11 24 08 | IBm | 1.48 | 14.00 | ... | 50 | 38 | 1.0 | * |
| NGC 4501 | 1401 | 12 31 59.6 | +14 25 17 | SA(rs)b | 6.92 | 10.36 | 140 | 59 | 2120 | 2.1 | T/N |
| NGC 4522 | 1516 | 12 33 40.0 | +09 10 30 | SB(s)cd | 3.72 | 12.99 | 33 | 79 | 2332 | 3.3 | T/N |
| NGC 4532 | 1554 | 12 34 19.4 | +06 28 12 | IBm | 2.82 | 12.30 | 160 | 70 | 2154 | 6.0 | E |
| NGC 4535 | 1555 | 12 34 20.3 | +08 11 53 | SAB(s)c | 7.08 | 10.59 | 0 | 46 | 1973 | 4.3 | N |
| NGC 4533* | 1557 | 12 34 22.2 | +02 19 31 | SAd | 2.09 | 14.20 | 161 | 88 | 1753 | 10.1 | ... |
| NGC 4536 | 1562 | 12 34 26.9 | +02 11 19 | SAB(rs)bc | 7.59 | 11.16 | 130 | 67 | 1894 | 10.2 | N |
| HolmbergVII*a | 1581 | 12 34 44.8 | +06 18 10 | Im | 1.29 | 14.62 | 82c | 22 | 2039 | 6.2 | ... |
| NGC 4548 | 1615 | 12 35 26.3 | +14 29 49 | SB(rs)b | 5.37 | 10.96 | 150 | 38 | 498 | 2.4 | A |
| NGC 4561 | ... | 12 36 08.6 | +19 19 26 | SB(rs)dm | 1.51 | 12.90 | 30 | 33 | 1441 | 7.1 | N |
| NGC 4567 | 1673 | 12 36 32.8 | +11 15 31 | SA(rs)bc | 2.95 | 12.06 | 85 | 49 | 2213 | 1.8 | T/N |
| NGC 4568 | 1676 | 12 36 34.7 | +11 14 15 | SA(rs)bc | 4.57 | 11.68 | 23 | 66 | 2260 | 1.8 | T/N |
| NGC 4569 | 1690 | 12 36 50.1 | +13 09 48 | SAB(rs)ab | 9.55 | 10.26 | 23 | 65 | −311 | 1.7 | T/N |
| NGC 4579 | 1727 | 12 37 44.2 | +11 49 11 | SAB(rs)b | 5.89 | 10.48 | 95 | 38 | 1627 | 1.8 | T/N |
| NGC 4580 | 1730 | 12 37 48.4 | +05 22 09 | SAB(rs)a: pec | 2.09 | 11.83 | 165 | 40 | 1227 | 7.2 | T/N |
| NGC 4606 | 1859 | 12 40 57.8 | +11 54 41 | SB(s)a | 3.24 | 12.67 | 33 | 62 | 1653 | 2.6 | T/C |
| NGC 4607 | 1868 | 12 41 12.2 | +11 53 09 | SBb | 2.88 | 13.75 | 2 | 83 | 2284 | 2.6 | ... |
| NGC 4651 | ... | 12 43 42.6 | +16 23 40 | SA(rs)c | 3.98 | 11.39 | 80 | 50 | 788 | 5.1 | N |
| NGC 4654 | 1987 | 12 43 56.6 | +13 07 33 | SAB(rs)cd | 4.90 | 11.10 | 128 | 56 | 1035 | 3.4 | N |
| NGC 4689 | 2058 | 12 47 45.8 | +13 45 51 | SA(rs)bc | 4.27 | 11.60 | 161c | 37 | 1522 | 4.5 | T/N |
| VCC 2062*b | 2062 | 12 47 59.9 | +10 58 33 | dE | 0.69 | 19.00 | 42c | 7 | 1170 | 4.5 | ... |
| NGC 4694 | 2066 | 12 48 15.1 | +10 59 07 | SB0: pec | 3.16 | 12.06 | 140 | 63 | 1211 | 4.6 | T/N |
| NGC 4698 | 2070 | 12 48 23.5 | +08 29 16 | SA(s)ab | 3.98 | 11.46 | 170 | 53 | 1032 | 5.9 | A |
| NGC 4713 | ... | 12 49 58.1 | +05 18 39 | SAB(rs)d | 2.69 | 12.19 | 100 | 52 | 631 | 8.5 | N |
| NGC 4772 | ... | 12 53 29.1 | +02 10 11 | SA(s)a | 3.39 | 11.96 | 147 | 62 | 1042 | 11.7 | T/N |
| NGC 4808 | ... | 12 55 49.6 | +04 18 14 | SA(s)cd | 2.75 | 12.35 | 127 | 68 | 738 | 10.2 | N |
Notes. The data have been taken from The Third Reference Catalogue of Bright Galaxies (RC3; Phys. Rev. C3, de Vaucouleurs et al. 1991) unless noted. (1) First names as they appear in RC3. *Five bonus galaxies from the same field as the selected sample; (2) Virgo Cluster Catalog (VCC) number (Binggeli et al. 1985); (3) right ascension in J2000; (4) declination in J2000; (5) morphological type; (6) optical size of the major axis measured at 25 mag □''−1 in the B band; (7) total magnitude in the B band; (8) position angle; (9) inclination derived from the ratio of major to minor axis, using the Hubble formula for oblate spheroids and an intrinsic axis ratio of 0.2,  (Aaronson et al. 1980); (10) optical velocity; (11) projected distance from M87; (12) star formation property classified based on Hα surface profiles (Koopmann & Kenney 2004b): N, normal; T, truncated; C, compact; E, enhanced, and A, anemic. *Galaxies not included in the sample of Koopmann & Kenney (2004b) but selected for the VIVA survey due to the morphological pecularities in the UV wavelength; a It will be referred with its VCC number (VCC 1581) hereafter; b The data were taken from Binggeli et al. (1985) since it is not available from RC3. c P.A.s determined by us using the H i kinematics.
Download table as: ASCIITypeset image
3. OBSERVATIONS AND DATA REDUCTION
3.1. Observations
Since the previous VLA Virgo survey by Cayatte et al. (1990), several improvements have been made to the VLA. In 1998, the C array was replaced by the CS array by putting one antenna in the center of the array. This means that CS and D arrays now have the same shortest spacing. Compared to the C array, the CS array has much better short spacing baseline coverage while the longer spacings are unchanged with spacings ranging from 0.035 to 3.4 km. Hence, the CS array has better surface brightness sensitivity than the former C array, and the same angular resolution. In addition, new L-band receivers have been installed, which have a much lower system temperature.
All of the new observations were done with the VLA in CS array, in a few cases supplemented by the D array. Most galaxies were observed with a 3.125 MHz bandwidth. The correlator was configured to produce 127 channels and two polarizations. Online Hanning smoothing was applied, after which every other channel was discarded. This resulted in 63 independent channels with a velocity resolution of roughly 10 km s−1. Two galaxies, NGC 4606 and NGC 4607, were observed in one pointing. Since their velocities differ by 600 km s−1, a total bandwidth of 6.25 MHz was used, two polarizations, and no online Hanning smoothing, resulting in 63 channels with 21 km s−1 width. In addition to these new observations, we reprocessed archival data on Virgo galaxies taken in C or CS array that were of comparable quality, including nine galaxies that we observed earlier. We have reached a column density sensitivity of 3–5 × 1019 cm−2 in 3σ per channel with a typical spatial resolution of 15'' −16'' (≲1.1 kpc at the Virgo distance). This is better by a factor of 3 and 4 in spatial and spectral resolution, respectively, than the previous VLA survey data of Cayatte et al. (1990).
For some galaxies, we suspected that we were missing extended diffuse emission based on either the images or on a comparison with single dish measurements. For those galaxies, we either obtained D array data ourselves or we used archival data of comparable quality. For 11 galaxies, we use the combined C/CS and D array data. Observing parameters are summarized in Table 2.
Table 2. VIVA Survey Observational Parameters
| Galaxy | Conf. | α, δ2000 | Obs. Date | Int. | ΔB | vobs | Beam (P.A.) | rms | Ref. |
|---|---|---|---|---|---|---|---|---|---|
| h m s + °''' | (month year) | (hr) | (MHz) | (km s−1) | "×" (deg) | (mJy beam−1) | |||
| (1) | (2) | (3) | (4) | (5) | (6) | (7) | (8) | (9) | (10) |
| N4064 | CS | 12 04 11.2+18 26 36 | Mar 2004 | 8 | 3.125 | 930 | 16.28 × 16.14 (−79) | 0.29 | |
| N4189 | CS | 12 13 47.2+13 25 29 | Apr 2004 | 8 | 3.125 | 2113 | 16.49 × 15.55 (+33) | 0.32 | |
| N4192 | C/D | 12 13 48.1+14 53 46 | Jan 1991/May 1992 | 3/2.5 | 3.125 | −160 | 27.99 × 25.90 (+76) | 1.00 | |
| N4216 | C | 12 15 53.7+13 08 42 | Jan 1991 | 4.5 | 3.125 | 120 | 16.44 × 15.90 (−33) | 0.65 | |
| N4222 | C | 12 16 22.5+13 18 25 | Jan 1991 | 4.5 | 3.125 | 120 | 16.44 × 15.90 (−33) | 0.54 | |
| N4254 | C/D | 12 18 49.3+14 25 07 | Mar 1992/Apr 1991 | 8 | 3.125 | 2408 | 26.78 × 24.46 (+48) | 0.41 | Phookun et al. (1993) |
| N4293 | CS | 12 21 12.9+18 22 57 | Jul 2005 | 8 | 3.125 | 893 | 16.58 × 15.40 (−69) | 0.33 | |
| N4294 | CS/D | 12 21 17.8+11 30 40 | Apr 2004/Nov 2005, Jan 2006 | 8/3.5 | 3.125 | 293 | 28.93 × 26.74 (−34) | 0.29 | |
| N4298 | CS | 12 21 32.8+14 36 22 | Jul 2005 | 8 | 3.125 | 1142 | 16.85 × 15.72 (−59) | 0.35 | |
| N4299 | CS/D | 12 21 40.5+11 30 11 | Apr 2004/Nov 2005, Jan 2006 | 8/3.5 | 3.125 | 293 | 28.93 × 26.74 (−34) | 0.29 | |
| N4302 | CS | 12 21 42.5+14 35 52 | Jul 2005 | 8 | 3.125 | 1142 | 16.85 × 15.72 (−59) | 0.35 | |
| N4321 | CS/D | 12 22 54.8+15 49 21 | Mar 2004/Mar 2003 | 8/2.3 | 2.629 | 1571 | 31.10 × 28.11 (−26) | 0.37 | |
| N4330 | CS/D | 12 23 17.2+11 22 05 | Aug 2005/Dec 2005 | 8 | 3.125 | 1565 | 26.36 × 23.98 (−56) | 0.38 | |
| N4351 | CS | 12 24 01.6+12 12 18 | Feb 2004 | 8 | 3.125 | 2315 | 16.77 × 16.31 (−38) | 0.30 | |
| N4380 | CS | 12 25 22.1+10 01 01 | Aug 2005 | 8 | 3.125 | 967 | 16.53 × 15.51 (−47) | 0.37 | |
| N4383 | CS/D | 12 25 25.5+16 28 12 | Mar 2004/Dec 2005 | 8 | 3.125 | 1710 | 44.58 × 37.81 (−38) | 0.26 | |
| N4388 | CS | 12 25 46.6+12 39 44 | Nov 2002 | 8 | 3.125 | 2524 | 17.14 × 15.12 (+01) | 0.36 | |
| N4394 | CS | 12 25 55.6+18 12 50 | Jul 2005 | 8 | 3.125 | 922 | 16.71 × 15.17 (−59) | 0.32 | |
| N4396 | CS/D | 12 25 58.8+15 40 17 | Mar 2004 | 8 | 3.125 | −128 | 27.39 × 26.84 (−03) | 0.28 | |
| N4405 | CS | 12 26 07.0+16 10 51 | Jul 2005 | 8 | 3.125 | 1747 | 16.59 × 15.36 (−61) | 0.36 | |
| N4402 | CS | 12 26 07.8+13 06 43 | Jan 2003 | 8 | 3.125 | 200 | 17.07 × 15.27 (+07) | 0.33 | Crowl et al. (2005) |
| I3355 | CS | 12 26 51.1+13 10 33 | Jan 2003 | 8 | 3.125 | 200 | 17.07 × 15.27 (+07) | 0.36 | |
| N4419 | CS | 12 26 56.4+15 02 50 | Oct 2002 | 8 | 3.125 | −261 | 16.35 × 15.26 (−09) | 0.32 | |
| N4424 | CS | 12 27 11.5+09 25 14 | Apr 2004 | 8 | 3.125 | 439 | 17.59 × 15.53 (+36) | 0.39 | |
| N4450 | CS | 12 28 29.5+17 05 06 | Jul 2005 | 8 | 3.125 | 1954 | 16.45 × 15.61 (−79) | 0.36 | |
| I3392 | CS | 12 28 43.3+14 59 58 | Oct 2002 | 8 | 3.125 | 1687 | 17.06 × 15.06 (+15) | 0.28 | |
| N4457 | CS | 12 28 58.9+03 34 14 | Jul 2005 | 8 | 3.125 | 882 | 17.43 × 16.28 (−36) | 0.47 | |
| I3418 | CS | 12 29 43.8+11 24 09 | Aug 2005 | 8 | 3.125 | 38* | 16.67 × 15.77 (−64) | 0.43 | |
| N4501 | C | 12 31 59.0+14 25 10 | Jan 1991 | 5 | 3.125 | 2280 | 16.99 × 16.56 (+51) | 0.57 | |
| N4522 | CS | 12 33 39.7+09 10 31 | Mar 2000 | 8 | 3.125 | 2330 | 18.88 × 15.20 (−43) | 0.40 | Kenney et al. (2004) |
| N4532 | C | 12 34 19.3+06 28 04 | Dec 1994 | 5.5 | 3.125 | 2000 | 17.36 × 16.19 (+22) | 0.33 | Hoffman et al. (1999) |
| N4535 | C/D | 12 34 20.3+08 12 01 | Jan 1991/Jan 1994 | 5 | 3.125 | 1950 | 24.98 × 24.07 (+22) | 0.60 | |
| N4533 | CS | 12 34 22.0+02 19 31 | Mar 2004 | 8 | 3.125 | 1790 | 18.04 × 16.18 (−12) | 0.33 | |
| N4536 | CS | 12 34 27.0+02 11 17 | Mar 2004 | 8 | 3.125 | 1790 | 18.04 × 16.18 (−12) | 0.33 | |
| V1581 | C | 12 34 45.3+06 18 02 | Dec 1994 | 5.5 | 3.125 | 2000 | 17.36 × 16.19 (+22) | 0.33 | Hoffman et al. (1999) |
| N4548 | CS | 12 35 26.4+14 29 47 | Mar 2004 | 5 | 3.125 | 451 | 16.59 × 15.81 (−37) | 0.30 | |
| N4561 | C | 12 36 08.5+19 19 25 | Sep 1989 | 3 | 3.125 | 1400 | 15.44 × 14.00 (−39) | 1.40 | |
| N4567 | CS | 12 36 32.7+11 15 28 | Jul 2005 | 8 | 3.125 | 2265 | 17.12 × 15.98 (−53) | 0.36 | |
| N4568 | CS | 12 36 34.3+11 14 19 | Jul 2005 | 8 | 3.125 | 2265 | 17.12 × 15.98 (−53) | 0.36 | |
| N4569 | CS | 12 36 49.8+13 09 46 | Apr 2004 | 8 | 3.125 | −235 | 16.38 × 16.27 (+10) | 0.33 | |
| N4579 | CS/D | 12 37 43.3+11 49 05 | Feb 2004/Mar 2003 | 8/2.3 | 2.629 | 1519 | 42.42 × 34.49 (+37) | 0.45 | |
| N4580 | CS | 12 37 48.4+05 22 10 | May 2004 | 8 | 3.125 | 1036 | 17.37 × 16.34 (−03) | 0.31 | |
| N4606 | CS | 12 40 57.6+11 54 40 | Aug 2005 | 8 | 6.25 | 1961 | 16.68 × 15.49 (−54) | 0.29 | |
| N4607 | CS | 12 41 12.4+11 53 09 | Aug 2005 | 8 | 6.25 | 1961 | 16.68 × 15.49 (−54) | 0.29 | |
| N4651 | CS | 12 43 42.6+16 23 36 | Mar 2004 | 8 | 3.125 | 804 | 16.67 × 16.25 (−69) | 0.40 | |
| N4654 | C | 12 43 56.5+13 07 33 | Mar 1992 | 8 | 3.125 | 1088 | 16.14 × 15.52 (+35) | 0.45 | Phookun & Mundy (1995) |
| N4689 | CS | 12 47 45.5+13 45 46 | Mar 2004 | 8 | 3.125 | 1611 | 16.71 × 15.85 (−37) | 0.27 | |
| V2062 | CS | 12 47 59.9+10 58 33 | May 2004 | 8 | 3.125 | 1117 | 16.35 × 16.12 (+12) | 0.38 | |
| N4694 | CS | 12 48 15.1+10 58 58 | May 2004 | 8 | 3.125 | 1117 | 16.35 × 16.12 (+12) | 0.38 | |
| N4698 | CS | 12 48 22.9+08 29 14 | Apr 2004 | 8 | 3.125 | 1000 | 16.96 × 16.20 (−29) | 0.35 | |
| N4713 | C | 12 49 58.0+05 18 38 | Sep 1989 | 2 | 3.125 | 655 | 25.95 × 22.13 (+67) | 1.96 | |
| N4772 | CS | 12 53 29.1+02 10 06 | Jul 2005 | 8 | 3.125 | 1040 | 17.80 × 15.41 (−36) | 0.36 | |
| N4808 | C/D | 12 55 49.5+04 18 14 | Sep 1989/Nov 2005 | 2 | 3.125 | 760 | 40.01 × 35.53 (+08) | 0.59 |
Notes. (1) NGC, IC, or VCC names; (2) VLA configuration(s); (3) field center; (4) observation dates in month and year; (5) observation duration; (6) total bandwidth. Note that NGC 4321 and NGC 4579 were observed in the way that two 3.125-IFs were offset with each other with 14 channels overlapping around the velocity where the observations were centered at, resulting in the total bandwidth of 2.629 MHz; (7) heliocentric velocity of the central channel using optical definition; (8) synthesized beam FWHM (P.A. of the beam); (9) the rms per channel of the final cube imaged with robust=1; (10) the literature where the same data have been presented.
Download table as: ASCIITypeset image
3.2. Data Reduction
Both the new and the archival data were reduced in the same way using the Astronomical Imaging Processing System (AIPS). After flux, phase, and bandpass calibration, the continuum was subtracted by making a linear fit to the raw u-v data for a range of line-free channels at both sides of the band. High u-v points caused by interference were flagged after continuum subtraction. Two galaxies (NGC 4321 and NGC 4579) were observed with overlapping intermediate frequencies (IFs), which were offset by ∼120 km s−1. For those two galaxies, we converted the two IFs into one long spectrum by averaging the overlapping channels using UJOIN. Several channels at both edges of the IFs, where the spectral frequency response drops rather steeply, were not included.
First, we made low resolution cubes covering a large field of view (1.4 × 1.4 deg2) to search for H i emission of sources far away from the field center. We found five galaxies that were fully covered in velocity and we added those to the VIVA survey (see Section 2.2 and Table 1).
The final image cubes were made using ROBUST=1 (Briggs 1995) to maximize sensitivity while keeping good spatial resolution. The cubes were cleaned to remove the sidelobes. The final cubes were about 40 arcmin in size, slightly larger than the FWHP (30 arcmin) of the primary beam of the VLA.
All but IC 3418 previously were detected with single-dish observations. In our survey, IC 3418 is also the only target that was not detected in H i, down to ∼8 × 10⁶ M☉ per beam in 3σ, assuming a profile width of 100 km s−1. However, the sensitivity would be less in a huge/diffuse H i disk, which would be smooth over 10 arcmin in a single velocity channel.
The total H i image, the intensity weighted velocity field, and the velocity dispersion image were also produced using AIPS by taking moments along the frequency axis (0th, 1st, and 2nd moments). The AIPS task MOMNT allows you to create a mask to blank the images at a given cutoff level. In creating a mask, we applied Gaussian and Hanning smoothing in spatial and in velocity, respectively, to maximize the signal-to-noise ratio (S/N). We normally used 1 ∼ 2× rms of the cube as the cutoff. We applied those masks to the full resolution cubes and calculated moments on the full resolution blanked cubes. Once image cubes and moment maps were obtained, we performed further analysis using GIPSY.
We also made 1.4 GHz continuum images by averaging the line-free channels. In order to reduce the effects of interfering sources, which may cause substantial sidelobes especially at low frequencies, we have used the AIPS task PEELR. It iteratively attempts to calibrate on multiple fields around bright continuum sources (self-calibration), to subtract the sources in those fields from the self-calibrated data, and to undo the field-specific calibration from the residual data, and it finally restores all fields to the residual data. We used the same weighting scheme (ROBUST=1) as for the H i images. The quality of our continuum data varies depending on the number of line-free channels of individual target galaxies.
4. H i ATLAS: DESCRIPTIONS
In this section, we describe the atlas, which is appended at the end of this paper. Individual galaxies are presented in separate pages, except for IC 3418, which we did not detect in H i and thus is not included in the atlas. In Figure 4, we show the figure arrangement diagram of each page. The contour levels of the H i emission in the channel maps, the H i surface density in the total H i image, the velocities of the velocity field and velocity dispersion images, and the 1.4 GHz continuum emission are shown at the left-bottom of each page.

Figure 4. Illustration of figure arrangement in the atlas (Figure 21).
Download figure:
Standard image High-resolution image4.1. Channel Maps
We present the cubes of Δv ≈ 10.4 km s−1 for all galaxies, except NGC 4606 and NGC 4607, which have channels that are Δv ≈ 21 km s−1. The lowest contours represent ±2σ, where σ is the rms per beam per channel. The synthesized beam is shown at the left-bottom corner of the first panel on the top left, i.e., in the channel with the largest velocity. In the same channel, we indicate the optical size, D25, the optical position angle (P.A.), and the inclination with an ellipse. In every channel, the optical center is shown with a cross, and the velocity (in km s−1) is shown in the top right corner.
4.2. H i Distribution and Velocities
On the top of the right half, the H i surface density distribution (left), the intensity-weighted velocity field (middle), and the velocity dispersion (right) are presented with contours overlaid on their own gray scale. The synthesized beam is shown in the bottom left of the H i surface density image. In the velocity field, the thick white line represents the H i systemic velocity, VH i, measured using the linewidths (Section 5). In the total H i image and the velocity field, the optical major and minor axes (D25) are shown as dotted lines. For 11 systems, the optically derived P.A. is uncertain because they are either close to face-on with i ≲ 45° or highly warped. For those galaxies, we determined the P.A. kinematically using a tilted-ring model fit on the inner regions of the H i velocity field, where the kinematics is fairly regular. Those galaxies are NGC 4189, NGC 4254, NGC 4299, NGC 4321, NGC 4351, NGC 4394, NGC 4457, VCC 1581, NGC 4689, and VCC 2062. The kinematically derived P.A.s are used throughout the atlas for these galaxies.
4.3. Global and Radial Profiles
The H i flux density profile and the azimuthally averaged radial H i surface density distribution are shown below the H i surface density distribution. To make the global profiles, we measured in each channel the flux density (FH i) in a tight box around the H i area where emission is seen. Throughout the cube, we used the areas outside of the H i emission to measure the rms as shown with the error bars. The H i systemic velocity, measured from the H i linewidth (Section 5), is indicated with an upward-pointing arrow.
The azimuthally averaged H i profiles have been derived by fitting tilted ring models, adopting the optically defined center, P.A., and inclination. For galaxies where we derived the P.A. based on the H i velocity field, the kinematic P.A.s were used. The surface density profiles are corrected to face-on and are given in M☉ pc−2. The galactocentric radius is given in kpc. The dashed line is the fit using the entire disk, while open circles and solid triangles are fits to the east and the west sides, respectively. For comparison, the optical size of the disk, R25, is indicated with an upper arrow. Of course, azimuthally averaged profiles can be misleading, and especially for some of the highly inclined galaxies with known extraplanar gas, such as NGC 4522, NGC 4569, NGC 4330, and NGC 4402, the profiles are of limited use.
4.4. PVDs
On the right side of the global and radial profiles, the position-velocity diagrams (PVDs) along the major axis (upper) and the minor axis (lower) are presented. Again, we adopted the optical center and the P.A. for most of the sample to make slices as shown in the upper-right corner of the figures, but we used the kinematically derived P.A.s for the 11 galaxies mentioned above. The optical center of the cut and the H i systemic velocity as derived from the linewidths (Section 5) are indicated with dashed lines.
4.5. Miscellaneous
On the bottom of the right side of each page, we present the POSS II−J (optical B) image (left) and overlays of the H i (middle), and 1.4 GHz continuum contours (right) on the optical image. The optical image itself is shown in high contrast to bring out better the structure of the inner stellar disk, while lower contrast images are used for the overlays to bring out the extent of the stellar disk in comparison to the extent of the H i and the radio continuum emission.
Fully reduced H i data (cubes, moments, XV slices) from the VIVA survey are available online at URL: http://www.astro.yale.edu/viva.
5. H i PROPERTIES
5.1. H i Quantities
In this section, we describe how the H i properties have been determined. The result is presented in Table 3.
Table 3. VIVA Sample and H i Properties
| Galaxy | SH i | MH i | W20%H i | W50%H i | VH i | DisoH iΔEΔW | DeffH iΔEΔW | defH i |  |
 |
 |
 |
F1.4GHz |
|---|---|---|---|---|---|---|---|---|---|---|---|---|---|
| (Jy km s−1) | (108 M☉) | –(km s−1)– | –(arcmin)– | (mJy) | |||||||||
| (1) | (2) | (3) | (4) | (5) | (6) | (7) | (8) | (9) | (10) | (11) | (12) | (13) | (14) |
| NGC 4064 | 0.66 ± 0.39 | 0.40 ± 0.24 | 175 | 110 | 934 | 0.91+0.02−0.03 | 0.86−0.06+0.01 | 1.79 ± 0.20 | −2.15 | −2.61 | 0.21 | 0.38 | 10.1 ± 1.2 |
| NGC 4189 | 9.40 ± 1.23 | 5.67 ± 0.74 | 245 | 232 | 2131 | 2.86+0.04−0.07 | 1.51+0.04−0.03 | 0.25 ± 0.04 | −0.90 | −1.26 | 1.19 | 1.47 | 17.1 ± 0.8 |
| NGC 4192 | 70.50 ± 6.08 | 42.52 ± 3.67 | 476 | 448 | −156 | 9.92+0.45−0.82 | 9.47−0.44−0.27 | 0.51 ± 0.20 | −0.65 | −1.29 | 1.01 | 1.72 | 78.5 ± 4.2 |
| NGC 4216 | 29.34 ± 6.17 | 17.70 ± 3.72 | 538 | 518 | 137 | 6.17+0.28−5.97 | 4.45+0.24−0.23 | 0.76 ± 0.20 | −1.01 | −1.84 | 0.76 | 0.85 | 14.1 ± 1.1 |
| NGC 4222 | 10.59 ± 2.45 | 6.39 ± 1.48 | 246 | 229 | 228 | 3.71−0.04+0.04 | 2.36+0.04+0.00 | 0.32 ± 0.04 | −0.31 | −0.79 | 1.12 | 1.84 | <0.3 |
| NGC 4254 | 73.42 ± 7.00 | 44.28 ± 4.22 | 250 | 218 | 2395 | 0.15+0.05−1.89 | 4.49−0.04−0.41 | −0.10 ± 0.02 | −0.85 | −1.23 | 1.88 | 2.98 | 449.5 ± 8.8 |
| NGC 4293 | 0.44 ± 0.50 | 0.27 ± 0.30 | 252 | 242 | 929 | ... | 1.02−0.24+0.07 | 2.25 ± 0.20 | −2.75 | −3.24 | ... | ... | 17.7 ± 2.7 |
| NGC 4294 | 27.08 ± 2.03 | 16.33 ± 1.22 | 221 | 192 | 363 | 4.38−0.05+0.21 | 15.59−0.04−8.17 | −0.11 ± 0.02 | −0.44 | −0.48 | 1.37 | 2.44 | 26.7 ± 1.1 |
| NGC 4298 | 8.21 ± 1.46 | 4.95 ± 0.88 | 240 | 225 | 1136 | 3.03−0.01+0.08 | 1.72+0.04−0.03 | 0.41 ± 0.02 | −1.15 | −1.64 | 0.95 | 1.21 | 16.8 ± 0.8 |
| NGC 4299 | 18.20 ± 0.84 | 10.98 ± 0.51 | 137 | 93 | 227 | 3.45−0.31+0.49 | 5.19−3.24−0.48 | −0.43 ± 0.02 | −0.47 | −4.68 | 2.03 | 0.10 | 18.7 ± 0.9 |
| NGC 4302 | 24.60 ± 3.95 | 14.84 ± 2.38 | 383 | 362 | 1146 | 5.21+0.16−0.09 | 3.55+0.14−0.14 | 0.39 ± 0.02 | −0.49 | −1.39 | 0.95 | 1.11 | 31.6 ± 1.7 |
| NGC 4321 | 47.71 ± 2.67 | 28.78 ± 1.61 | 268 | 244 | 1571 | 7.66+0.19−0.31 | 4.88+0.14−0.20 | 0.35 ± 0.12 | −1.17 | −1.54 | 1.03 | 1.52 | 284.7 ± 8.0 |
| NGC 4330 | 7.37 ± 1.73 | 4.45 ± 1.04 | 275 | 247 | 1566 | 2.72−0.05+0.07 | 5.54−1.54+0.36 | 0.80 ± 0.04 | −0.76 | −1.17 | 0.60 | 0.89 | 18.7 ± 1.0 |
| NGC 4351 | 4.96 ± 0.67 | 2.99 ± 0.40 | 124 | 99 | 2319 | 2.44−0.31+0.08 | 1.46−0.44+0.06 | 0.23 ± 0.20 | −0.96 | −0.95 | 1.22 | 1.90 | 2.0 ± 0.2 |
| NGC 4380 | 2.10 ± 0.92 | 1.27 ± 0.55 | 291 | 274 | 969 | 2.21+0.01−0.01 | 1.63+0.04−0.11 | 1.13 ± 0.20 | −1.48 | −2.15 | 0.63 | 0.93 | <0.6 |
| NGC 4383 | 48.38 ± 5.15 | 29.18 ± 3.10 | 233 | 213 | 1708 | 8.39−0.06+0.24 | 7.80−1.53+0.73 | −0.81 ± 0.20 | −0.11 | −0.42 | 4.19 | 7.19 | 44.3 ± 4.1 |
| NGC 4388 | 6.10 ± 3.66 | 3.68 ± 2.21 | 396 | 368 | 2519 | 3.10+0.02+0.00 | 2.05−0.14+0.21 | 1.16 ± 0.12 | −1.39 | −1.89 | 0.55 | 1.00 | 169.0 ± 17.1 |
| NGC 4394 | 7.27 ± 0.51 | 4.38 ± 0.31 | 173 | 162 | 914 | 3.74+0.01−0.02 | 2.57−0.04+0.06 | 0.62 ± 0.20 | −1.32 | −1.76 | 1.04 | 1.15 | <0.2 |
| NGC 4396 | 14.31 ± 2.81 | 8.63 ± 1.69 | 213 | 199 | −121 | 3.94−0.09+0.09 | 3.16−0.74+0.19 | 0.30 ± 0.04 | −0.49 | −0.44 | 1.20 | 3.27 | 21.0 ± 0.8 |
| NGC 4405 | 0.75 ± 0.44 | 0.45 ± 0.27 | 169 | 155 | 1740 | 0.92+0.02−0.02 | 0.38+0.04−0.01 | 0.95 ± 0.20 | −1.78 | −2.27 | 0.51 | 0.70 | 5.6 ± 0.4 |
| NGC 4402 | 6.13 ± 2.60 | 3.70 ± 1.57 | 288 | 249 | 236 | 2.92−0.29+0.07 | 2.11−0.14−0.03 | 0.74 ± 0.12 | −1.06 | −1.76 | 0.75 | 0.80 | 68.3 ± 3.4 |
| IC 3355 | 3.20 ± 0.19 | 1.93 ± 0.11 | 61 | 38 | −10 | 1.82−0.07+0.05 | 9.42−0.24+0.17 | 0.09 ± 0.06 | −0.29 | −5.44 | 1.65 | 0.05 | <0.4 |
| NGC 4419 | 0.96 ± 1.37 | 0.58 ± 0.83 | 382 | 367 | −200 | 1.17+0.03−0.04 | 1.11−0.14+0.12 | 1.37 ± 0.20 | −2.07 | −2.85 | 0.35 | 0.41 | 50.7 ± 7.4 |
| NGC 4424 | 3.19 ± 0.52 | 1.92 ± 0.31 | 108 | 56 | 434 | 1.42−0.11+0.11 | 7.61−0.04−0.78 | 0.97 ± 0.20 | −1.42 | −1.73 | 0.39 | 0.65 | 6.5 ± 0.7 |
| NGC 4450 | 4.72 ± 0.88 | 2.85 ± 0.53 | 322 | 304 | 1955 | 2.98−0.65+0.14 | 2.23+0.14−0.08 | 1.17 ± 0.20 | −1.84 | −2.39 | 0.57 | 0.80 | 7.1 ± 1.1 |
| IC 3392 | 0.72 ± 0.57 | 0.43 ± 0.34 | 197 | 163 | 1683 | 1.03+0.08−0.08 | 0.73−0.04−0.04 | 1.15 ± 0.12 | −1.83 | −2.33 | 0.45 | 0.56 | 3.3 ± 0.2 |
| NGC 4457 | 3.21 ± 0.81 | 1.94 ± 0.49 | 161 | 143 | 889 | 1.76+0.08−0.08 | 0.90+0.04−0.06 | 0.92 ± 0.20 | −1.65 | −2.29 | 0.65 | 0.85 | 33.6 ± 2.6 |
| IC 3418 | <0.13 | <0.08 | ... | ... | ... | ... | ... | ... | <-2.16 | ... | ... | ... | <0.8 |
| NGC 4501 | 27.46 ± 4.10 | 16.56 ± 2.47 | 532 | 508 | 2278 | 6.32+0.72−1.27 | 3.60+0.34−0.28 | 0.58 ± 0.12 | −1.30 | −1.97 | 0.92 | 1.22 | 306.0 ± 7.3 |
| NGC 4522 | 5.63 ± 1.67 | 3.40 ± 1.01 | 240 | 214 | 2331 | 2.90−0.01+0.06 | 5.01−1.14+0.47 | 0.86 ± 0.02 | −0.91 | −1.22 | 0.78 | 1.48 | 22.6 ± 1.3 |
| NGC 4532 | 32.45 ± 2.33 | 19.57 ± 1.41 | 208 | 160 | 2016 | 5.31−0.11+1.45 | 13.00−1.64−4.52 | −0.06 ± 0.06 | −0.43 | −0.59 | 1.90 | 2.54 | 86.7 ± 5.4 |
| NGC 4535 | 54.34 ± 2.23 | 32.77 ± 1.34 | 292 | 272 | 1971 | 8.86+0.02−0.02 | 5.85−0.04−0.11 | 0.41 ± 0.12 | −0.88 | −1.17 | 1.25 | 2.42 | 67.4 ± 2.9 |
| NGC 4533 | 4.44 ± 1.15 | 2.68 ± 0.69 | 192 | 182 | 1742 | 2.17+0.00−0.01 | 3.53+0.24−0.86 | 0.51 ± 0.04 | −0.53 | −5.29 | 1.03 | 0.07 | <0.5 |
| NGC 4536 | 78.45 ± 3.85 | 47.32 ± 2.32 | 348 | 325 | 1802 | 8.74+0.07−0.10 | 5.33+0.04−0.08 | 0.16 ± 0.12 | −0.49 | −0.97 | 1.15 | 2.31 | 191.2 ± 25.4 |
| VCC 1581 | 5.20 ± 0.52 | 3.14 ± 0.31 | 117 | 107 | 2045 | 2.18+0.06−0.14 | 12.19+2.34−0.40 | −0.06 ± 0.06 | −0.29 | −5.23 | 1.67 | 0.07 | <0.2 |
| NGC 4548 | 10.65 ± 0.72 | 6.42 ± 0.43 | 249 | 233 | 480 | 4.71+0.02−0.04 | 3.49+0.04−0.04 | 0.82 ± 0.12 | −1.48 | −1.97 | 0.87 | 1.34 | 3.3 ± 0.2 |
| NGC 4561 | 23.21 ± 1.86 | 14.00 ± 1.12 | 171 | 132 | 1404 | 5.50−0.14+0.05 | 2.82+0.31−0.44 | −0.71 ± 0.02 | −0.34 | −0.16 | 3.66 | 5.77 | 1.6 ± 0.3 |
| NGC 4567 | 15.64 ± 1.16 | 9.43 ± 0.70 | 204 | 197 | 2275 | 9.57−0.91+0.17 | 5.94−0.64+0.21 | 0.13 ± 0.12 | −0.86 | −1.36 | 3.19 | 3.69 | 14.7 ± 0.7 |
| NGC 4568 | 25.11 ± 2.83 | 15.14 ± 1.71 | 337 | 314 | 2249 | 4.66+3.90−0.60 | 4.45+0.04−2.06 | 0.38 ± 0.12 | −0.81 | −1.49 | 1.01 | 1.33 | 143.1 ± 7.4 |
| NGC 4569 | 10.29 ± 2.38 | 6.21 ± 1.44 | 406 | 387 | −212 | 4.11+0.40−1.07 | 2.29+0.14−0.17 | 1.47 ± 0.20 | −1.79 | −2.23 | 0.43 | 0.75 | 105.6 ± 5.0 |
| NGC 4579 | 9.34 ± 2.49 | 5.63 ± 1.50 | 371 | 358 | 1516 | 4.11+0.19−0.16 | 2.78+0.14−0.14 | 0.95 ± 0.20 | −1.73 | −2.33 | 0.70 | 1.03 | 163.2 ± 12.2 |
| NGC 4580 | 0.46 ± 0.37 | 0.28 ± 0.22 | 179 | 168 | 1035 | 0.87+0.06−0.10 | 0.52+0.04+0.00 | 1.53 ± 0.20 | −2.47 | −2.71 | 0.42 | 0.47 | 3.5 ± 0.1 |
| NGC 4606 | 0.41 ± 0.22 | 0.25 ± 0.13 | 158 | 142 | 1647 | 0.65+0.07−0.13 | 0.54−0.04+0.10 | 1.64 ± 0.20 | −2.19 | −2.58 | 0.20 | 0.35 | 1.1 ± 0.1 |
| NGC 4607 | 3.63 ± 1.34 | 2.19 ± 0.81 | 247 | 221 | 2253 | 2.04+0.06−0.07 | 1.93−0.14+0.09 | 0.82 ± 0.12 | −0.82 | −1.55 | 0.70 | 0.75 | 19.6 ± 1.5 |
| NGC 4651 | 67.08 ± 4.00 | 40.46 ± 2.41 | 386 | 363 | 801 | 9.28−1.82+0.01 | 4.78−0.74−0.44 | −0.30 ± 0.02 | −0.48 | −0.88 | 2.32 | 4.03 | 50.1 ± 2.0 |
| NGC 4654 | 49.19 ± 3.17 | 29.67 ± 1.91 | 310 | 288 | 1031 | 7.47+0.00−2.38 | 4.42+0.14−1.74 | 0.12 ± 0.02 | −0.73 | −1.08 | 1.53 | 2.33 | 115.7 ± 3.7 |
| NGC 4689 | 7.81 ± 0.84 | 4.71 ± 0.51 | 197 | 180 | 1615 | 2.99+0.06−0.06 | 1.76+0.04−0.07 | 0.68 ± 0.12 | −1.33 | −1.65 | 0.70 | 1.17 | 1.6 ± 0.0 |
| VCC 2062 | 5.32 ± 0.22 | 3.21 ± 0.13 | 73 | 45 | 1139 | 4.87−3.07+0.00 | 3.89−2.74−0.17 | ... | 1.44 | −5.22 | 6.95 | 0.15 | <0.4 |
| NGC 4694 | 4.19 ± 0.25 | 2.53 ± 0.15 | 116 | 84 | 1176 | 1.47−0.88+0.44 | 9.82−3.14+0.26 | 0.83 ± 0.20 | −1.44 | −1.68 | 0.46 | 0.83 | 3.1 ± 0.4 |
| NGC 4698 | 27.15 ± 2.00 | 16.38 ± 1.21 | 432 | 413 | 1009 | 8.84−1.16+0.58 | 6.18−0.04−0.55 | 0.02 ± 0.20 | −0.85 | −1.44 | 2.21 | 3.10 | <1.0 |
| NGC 4713 | 48.01 ± 3.30 | 28.90 ± 1.98 | 185 | 167 | 654 | 8.49−1.65+0.21 | 3.69−0.54+0.56 | −0.31 ± 0.04 | −0.31 | −0.27 | 3.15 | 7.77 | 10.2 ± 0.4 |
| NGC 4772 | 13.86 ± 1.94 | 8.36 ± 1.17 | 463 | 437 | 1044 | 2.83−0.02+0.02 | 2.51−0.24+0.44 | 0.15 ± 0.20 | −0.94 | −1.42 | 0.83 | 1.36 | 2.5 ± 0.3 |
| NGC 4808 | 59.15 ± 4.20 | 35.68 ± 2.53 | 280 | 260 | 760 | 7.95−0.61+0.76 | 6.05+0.13−0.34 | −0.58 ± 0.04 | −0.17 | −0.51 | 2.84 | 4.37 | 45.0 ± 3.9 |
Notes. (1) NGC, IC or VCC names; (2) integrated H i flux ±σ; (3) total H i mass ±σ; (4) linewidth measured at 20% of the peak flux; (5) linewidth measured at 50% of the peak flux; (6) H i velocity determined using W20 and W50; (7) isophotal diameter determined at 1 M☉ pc−2 (ΔeastΔwest); (8) effective diameter measured at 4π∫rΣH i(r) · r2dr = 0.5SH i(ΔeastΔwest); (9) type-independent H i deficiency±uncertainty from the morphological classification; (10) log of H i mass-to-light ratio in B (M☉/L☉); (11) log of H i mass-to-light ratio in K (M☉/L☉); (12) the ratio of H i isophotal diameter-to-optical B diameter at 25 mag □''−1; (13) the ratio of H i isophotal diameter-to-optical K diameter at 20 mag □''−1; (14) the 1.4 GHz continuum flux ±σ.
Download table as: ASCIITypeset image
5.2. Flux (SH i) and Mass (MH i)
Columns 2 and 3. We have measured the total flux by integrating the global profile along the velocity axis:

in Jy km s−1, where FH i and σH i are the H i flux and the rms in Jy at each channel, and Δv is the channel width (≈10.4 km s−1). The H i mass in M☉ can then be determined by

in M☉, where SH i is the total flux in Jy km s−1 and D is the distance to the galaxy in Mpc (assumed to be 16 Mpc for all galaxies).
5.3. Linewidths (W20, W50) and H i Velocity (VH i)
Columns 4, 5, and 6. The linewidths have been measured at 20% and 50% levels of the peak fluxes on both the receding and the approaching sides of the profile,

where VR20, VR50 and VA20, VA50 are the velocities with 20% and 50% of the peak flux on the receding and the approaching sides, respectively. The H i velocity has been determined with VR20, VR50 and VA20, VA50 using the following definition:

The uncertainties in W20, W50, and VH i are approximately 10.4 km s−1.
5.4. Diameters (DisoH i and DeffH i)
Columns 7 and 8. To determine the isophotal diameter, we use the radius where the azimuthally averaged H i surface density (ΣH i) drops to 1 M☉ pc−2. If there is more than one radius with ΣH i = 1 M☉ pc−2 (e.g., in case an H i hole is present in the central area on the disk), we take the outermost position to derive the isophotal diameter. NGC 4293 is the only galaxy where DisoH i is not defined in this way since ΣH i is always below 1 M☉ pc−2. For this galaxy, we use the region that contains 50% of the total flux as the effective diameter. We also determined the isophotal and the effective diameters for the east and the west sides of the disk separately. The difference between these and the diameters measured over the entire disk, i.e.,  and
and  , is a useful measure of the morphological asymmetry.
5.5. Deficiency (defH i)
Column 9. The H i deficiency is an indicator of how H i deficient individual galaxies are compared to field galaxies of the same size and morphological type. Haynes & Giovanelli (1984) have defined defH i as follows:

where  and is the mean H i surface density within the optical disk. This mean surface density varies only slightly with the Hubble type, T, for types Sab–Sm, but varies more for types Sa and earlier. For isolated galaxies, Haynes & Giovanelli (1984) empirically determined
  = 0.24, 0.38, 0.40, 0.34, and 0.42 for Sa/Sab, Sb, Sbc, Sc, and types later than Sc, respectively. However, Koopmann & Kenney (1998) have shown that the Hubble classification does not work for many cluster spiral galaxies in Virgo due to environmental processes that remove gas and greatly reduce star formation rates. We therefore prefer to use the type-independent H i deficiency parameter, which compares all morphological types to a mean H i surface density (
 ; Haynes & Giovanelli 1984). We use as the uncertainty in the deficiency the difference between the type-independent deficiency and the type-dependent deficiency using the morphological types from the RC3 catalog (Table 1),
  .
.
5.6. H i Mass-to-Light Ratio (MH \mathsci/L) in B and K
Columns 10 and 11. The H i mass-to-light ratio in B- and K bands in solar unit (M☉/L☉) has been measured using the following equations:

where SH i is in Jy km s−1, and AB and AK are the Galactic extinction in B- and K bands, taken from LEDA (Paturel et al. 1997) and the NASA/IPAC Extragalactic Database. In Table 3, the values are given in logarithmic scale. The K-band magnitude (Kron magnitude measured at 20 mag arcsec−2) has been obtained from the Two Micron All Sky Survey (2MASS; Skrutskie et al. 2006) database.
5.7. H i-to-Optical Size (DisoH i/Dopt) in B and K
Columns 12 and 13. The ratio of the H i isophotal diameter to the B- and K-band optical diameters are presented. The B-band diameters (listed in Table 1) are D25 from RC3. The K-band diameters have been obtained from the 2MASS database (Kron isophotal diameters at 20 mag arcsec−2). No photometric measurements are available for several systems that are faint in K.
5.8. Comparison of Total H i Flux with Values in the Literature
In this subsection, we compare the VIVA fluxes (VLA C or CS array) either with the fluxes measured in the Arecibo Legacy Fast ALFA (ALFALFA) survey of the Virgo region (Kent et al. 2008) or, for the few galaxies that have not yet been observed with ALFALFA, with the most reliable fluxes listed in ARECIBO-05. We also compare our flux values with the earlier imaging surveys by Cayatte et al. (1990; VLA D array) and Warmels (1988a, 1988b; WSRT imaging and one-dimensional strip scans, respectively). The latter surveys have much lower S/N than the VIVA data, but have different UV coverage. Arecibo has a filled aperture and is less likely to miss the flux. However, its beam is quite large (∼3 5 at 21 cm) and the total flux within one beam can be confused with other systems. It can also miss some flux in case a galaxy with an H i extent larger than the beam is observed with a single pointing. However, the new seven-element ALFA receiver system makes a complete image of the area, and we consider the ALFALFA fluxes the best measure of the total amount of H i. Meanwhile, interferometers cannot measure structures on angular scales larger than the fringe spacing formed by the shortest spacing (Taylor et al. 2004). As a result, they can miss some flux in extended features. The VLA CS array has the same shortest spacing as the VLA D array, and it should in principle be able to measure extended features equally well (the maximum extended structure that can be imaged is 15 arcmin at 20 cm). However, since it has fewer short spacings than D array, it is still somewhat less sensitive to faint extended structures. With the VLA C array, the maximum extent visible is 6 arcmin, and we could possibly have missed some flux from very extended structures in the galaxies observed with the C configuration. Our conclusion is that in general, there is very good agreement with the ALFALFA fluxes.
In the upper plot in Figure 5, we show a comparison of the ALFALFA fluxes with the VIVA fluxes (filled symbols). Open symbols are single dish measurements taken from ARECIBO-05. There is good agreement between the interferometer and the single dish values. Since there is a distinct possibility that the interferometer resolves out some of the most extended flux, we show in the lower plot the difference between the single dish values and the VIVA flux as a function of H i extent. As expected, the scatter in the total flux goes up in absolute value for large sources, but the fractional error goes down. There is no evidence that VIVA fluxes are less than ALFALFA fluxes for the large diameter sources. Rather, there is a marginally significant suggestion that VIVA fluxes are on average greater than ALFALFA fluxes for the largest sources. To estimate how significant the uncertainties in the flux values are, we show in Figure 6 (upper plot) the same differences, but normalized by the VIVA fluxes. Clearly, there is good agreement for the large size sources. Interestingly, there appears to be a very small systematic bias for the smaller size sources. The VIVA fluxes are all below the single dish value although this is a small effect compared to the size of the error bars. We believe this to be the result of the way we make the total H i images by using a cutoff in the smoothed images.

Figure 5. Top: Comparison of the single dish fluxes and the VIVA fluxes. The ALFALFA and the ARECIBO-05 fluxes are shown in filled and open circles, respectively. Bottom: difference between the VIVA and the single dish flux as function of H i extent.
Download figure:
Standard image High-resolution image
Figure 6. Top: Difference between the VIVA and the single dish flux normalized by the VIVA flux as a function of H i extent. The same symbols are used as in Figure 5. Bottom: same as above, but a comparison with the previous VLA imaging study (Cayatte et al. 1990; filled circle), WSRT (Warmels 1988a; open circle) imaging study, or one-dimensional observations (Warmels 1988b; open triangle).
Download figure:
Standard image High-resolution imageFinally, mostly for historical interest, we show in the bottom plot of Figure 6 the difference between the VIVA flux and the values measured by Cayatte et al. (1990) and/or Warmels (1988a, 1988b), normalized by the VIVA flux as a function of H i diameter. There is excellent agreement for all galaxies, except for NGC 4535. Interestingly, both Cayatte et al. (1990) and Warmels (1988b) find a 20% larger flux for this galaxy. On the other hand, there is excellent agreement between the ALFALFA and VIVA fluxes. We have no explanation for this discrepancy.
In conclusion, we find that there is excellent agreement between the VIVA and ALFALFA fluxes, and there is no indication that the interferometer has missed any very extended flux.
6. H i MORPHOLOGY IN DIFFERENT ENVIRONMENTS
In this section, we describe the range of H i morphologies found in the different locations in Virgo. We present results for individual galaxies in the Appendix. In Figure 7, we show a composite image of the total H i images of the individual galaxies (in blue) overlaid on the ROSAT X-ray image (orange) by Böhringer et al. (1994). The galaxies are located at the proper position in the cluster, but each H i image is magnified by a factor of 10 to show the details of the H i distribution. The picture shows how non-uniform the mass distribution in Virgo is, with enhanced X-ray emission from the cluster and subclusters centered at the giant ellipticals, M87, M86, and M49, respectively. There is a huge range in the H i sizes of the galaxies. In general, the galaxies at larger projected distances have larger H i sizes, while galaxies in the core have smaller H i sizes, but there are exceptions. In Figure 8, we show typical examples for the range of morphologies that we see.

Figure 7. Composite image of the total H i images of the individual galaxies (in blue) overlaid on the ROSAT X-ray image (orange) by Böhringer et al. (1994). The galaxies are located at the proper position in the cluster but each H i image is magnified by a factor 10 to show the details of the H i distribution. The picture clearly shows how non-uniform the mass distribution in Virgo is, with enhanced X-ray emission from the three subclusters centered at the ellipticals, M87, M86, and M49.
Download figure:
Standard image High-resolution image
Figure 8. Examples of the different H i morphologies found in the survey. Total H i images are shown in white contours overlaid on the SDSS images. The thick white bar in the bottom-left corner indicates 1 arcmin in each panel. The top row shows examples of gas-rich galaxies in gas rich environments in the outskirts, the middle row shows galaxies at intermediate distances, while the bottom row shows examples of severely truncated H i disks at a range of projected distances from M87.
Download figure:
Standard image High-resolution imageH i-rich galaxies in the outskirts of the cluster. H i-rich galaxies are exclusively found in the lower density regions of the cluster outskirts at the projected distance from M87 (d87 ≳ 1 Mpc). These galaxies usually have H i extending well beyond the stellar disk in all directions. Small, kinematically distinct H i features with or without optical counterparts are quite common around these systems. A typical example is NGC 4808 shown in Figure 8. Many of the galaxies in the outskirts look morphologically peculiar, showing tails or rings in H i, in the stellar distribution, or in both. Some show a kinematical decoupling between inner and outer gaseous disks. These galaxies seem to be experiencing gravitational interactions and possibly continuing infall of gas from the halo. For example, NGC 4651 (Figure 8) shows in H i an extension to the west, while deep optical images show a stellar tail to the opposite side of the H i, which ends with a low surface brightness arc. Kinematically, the H i disk shows a discontinuity in the P.A. between the inner and the outer disks.
Long one-sided H i tails pointing away from M87. At intermediate distances from M87 (0.6 ≲ dM87 ≲ 1 Mpc), we find seven galaxies with long one-sided H i tails pointing away from M87. An example is NGC 4302 (Figure 8). The H i is mildly truncated to within the stellar disk in the south, and the gas tail is extended to the north, with no optical counterpart. Although there is a nearby companion, NGC 4298, NGC 4302 looks optically undisturbed. In Chung et al. (2007), we argue that these galaxies have only recently arrived in the cluster and are falling into the center, likely on highly radial orbits as hinted by the direction of the tails. A simple estimate suggests that all but two of the tails could have been formed by ram pressure stripping of the gas in the very outer parts of the disk. Some of these galaxies have close neighbors, suggesting that tidal interactions may have moved gas outward, making it more susceptible to ram pressure stripping. Apparently, galaxies already begin to lose their gas at intermediate distances from the cluster center through ram-pressure stripping and tidal interactions or a combination of both.
Symmetric H i disks with DH i/Dopt ≈ 1 at intermediate distances. At similar distances from M87 as the H i tails, we find galaxies with fairly symmetric H i disks that are comparable in size to their stellar disks, e.g., NGC 4216, shown in Figure 8. Some are quite H i deficient, despite the fact that the H i extent is comparable to the optical extent. Their H i surface density is down by up to a factor of 2. These systems might be under the influence of a process that slowly affects the entire face of the galaxy, such as turbulent viscous stripping or thermal evaporation (Nulsen 1982; Cayatte et al. 1994).
Small H i disks near the cluster center. Near the cluster core (dM87 < 0.5 Mpc), galaxies always have gas disks that are truncated to within the optical disk. These galaxies often show highly asymmetric H i distributions as they currently undergo strong ram pressure stripping. An example is NGC 4402 (Figure 8), which has been studied in detail by Crowl et al. (2005). Galaxies appear to lose most of their H i gas (>70%) in these regions through a strong interaction with the ICM.
Severely stripped H i disks beyond the cluster core. Interestingly, we also find a number of galaxies that are stripped to well within the stellar disk at large projected distances from the cluster center (≳1 Mpc). Examples are NGC 4522, NGC 4405, and NGC 4064 (Figure 8). Some of these may have been stripped while crossing the cluster center. As the galaxies move out from the high ICM density region, stripped and disturbed gas that is still bound to the galaxy may resettle onto the disk and form a small symmetric gas disk in the center (NGC 4405). However, a detailed study of the mean stellar age at the truncation radius by Crowl & Kenney (2008) shows that some of these galaxies have been forming stars until recently (<0.5Gyr). This does not leave enough time for these galaxies to have been stripped in the center and then to have traveled to their current location. NGC 4064 is a good example of this. It must have lost its gas at large distances from the cluster center.
A particularly interesting case is NGC 4522 (Kenney et al. 2004), which shows abundant evidence for current ongoing strong ram pressure stripping despite its large projected distance from M87 (≈1 Mpc). An estimate of the mean stellar age at the stripping radius (Crowl & Kenney 2006) also suggests that stripping is ongoing, yet an estimate of the ram pressure at that location based on a smooth distribution of the ICM would indicate that the pressure is too low by a factor 10. Kenney et al. (2004) argue that the merging of the subcluster M49 with Virgo could locally enhance the ram pressure due to bulk motions, clumpy density distributions, and variations in the temperature of the ICM gas. A temperature map of the X-ray emission (Shibata et al. 2001) does show that NGC 4522 is located near strong variations in the X-ray temperature. The results on galaxies such as NGC 4064 and NGC 4522 fit in nicely with recent work by Tonnesen et al. (2007) and Tonnesen & Bryan (2008), who find that ram pressure can vary by more than a factor of 10 at a given distance from the cluster center due to the structure in the ICM. This makes it possible for some galaxies to get stripped in the outskirts without ever making it to the center of the cluster, something that we may be witnessing in Virgo.
7. SUMMARY
We present the results of a new H i imaging survey of 53 galaxies in the Virgo cluster. The goal is to study the impact of different environmental effects on the H i disks of the galaxies. Virgo is ideal for this type of study as it is dynamically young and potentially contains galaxies that are affected by a wide range of environmental effects. Its nearness allows us to study the individual galaxies in great detail.
We have selected 48 galaxies and obtained data on five additional galaxies that were in the same field and velocity range as the target galaxies. The galaxies were selected to cover a wide range of star formation properties, from anemic to starburst, and to be located in a wide range of local galaxy densities, from the dense core to the outskirts of the cluster. The target galaxies are at projected distances of 0.3 to 3.3 Mpc from the cluster center, and as such, the survey covers a region that is 2 to 3 times larger than the area explored in the previous VLA survey by Cayatte et al. (1990). Many of our galaxies had never been imaged in H i. This new survey was done with the VLA CS configuration. Its spatial and spectral resolution are a factor 3 and 4 better than that of the previous survey. The VIVA survey has not only confirmed results from previous H i imaging studies, but also found many features that were never seen before in Virgo, or any other cluster. We summarize our main results below.
- 1.We confirm that galaxies near the cluster center have H i disks that are much smaller than the optical disk. We see, however, extraplanar gas near some of the galaxies, providing the first direct evidence for ongoing ram pressure stripping and fall back of stripped gas.
- 2.At intermediate distances from the center (0.6–1 Mpc), we find galaxies with long one-sided H i tails pointing away from M87. Chung et al. (2007) argue that these are most likely galaxies falling into the cluster on highly radial orbits. The tails are due to ram pressure stripping and, in a few cases, to the combined effect of gravitational interactions and ram pressure stripping. Thus, the impact of ram pressure begins to affect galaxies already at intermediate distances from the center.
- 3.We found several galaxies in the outskirts of Virgo (d87 > 1.5 Mpc) that also have H i disks that are much smaller than the stellar disks. Some of these were already known to be strongly H i deficient (Sanchis et al. 2002). Although these galaxies are as H i deficient as the galaxies in the core, none of them shows signs of ongoing/recent stripping. Some of these galaxies may have been stripped earlier when passing through the center of Virgo, but at least some of them have been forming stars in the stripped part of the disks until quite recently (Crowl & Kenney 2008). The latter galaxies almost certainly have been stripped of their gas in the outskirts of the cluster.
- 4.In the outskirts we find several extended H i bridges and optical disturbances, which indicate that the systems are gravitationally interacting.
In Paper II, we will do a statistical analysis of our H i imaging results and discuss the importance of various environmental effects on the evolution of cluster galaxies.
The VIVA collaboration has been growing over time. We are grateful for many useful discussions with our colleagues who have joined more recently: David Schiminovich, Eric Murphy, Tomer Tal, Anne Abramson, Ivy Wong, and Tom Oosterloo. We thank the ALFALFA consortium for making their data so promptly available to the scientific community. We thank the anonymous referee for comparing the VIVA data to single-dish data from GOLDMINE and providing us with plots of the excellent agreement. This work has been supported by NASA grant 1321094. This research has made use of the NASA/IPAC Extragalactic Database (NED), which is operated by the Jet Propulsion Laboratory, California Institute of Technology, under contract with the National Aeronautics and Space Administration. The Digitized Sky Survey was produced at the Space Telescope Science Institute under US government grant NAG W-2166. This publication makes use of data products from the Two Micron All Sky Survey, which is a joint project of the University of Massachusetts and the Infrared Processing and Analysis Center, California Institute of Technology, funded by the National Aeronautics and Space Administration and the National Science Foundation. Funding for the Sloan Digital Sky Survey (SDSS) and the SDSS-II has been provided by the Alfred P. Sloan Foundation, the Participating Institutions, the National Science Foundation, the U.S. Department of Energy, the National Aeronautics and Space Administration, the Japanese Monbukagakusho, the Max Planck Society, and the Higher Education Funding Council for England. The SDSS Web site is http://www.sdss.org/.
APPENDIX: COMMENTS ON INDIVIDUAL GALAXIES
In this section, we describe the H i morphology and kinematics of individual galaxies in detail and compare them with data at other wavelengths. Unless otherwise mentioned, the optical R-band and Hα morphology and surface brightness profiles are from Koopmann et al. (2001) and Koopmann & Kenney (2004a, 2004b). For the radio continuum emission, we refer to our own 1.4 GHz continuum data. Otherwise, references are given.
NGC 4064. The H i extends to only about one fifth of the stellar disk (<4 kpc) and might be slightly extended to the NE. Optically, NGC 4064 has a relatively undisturbed outer stellar disk, with a strong central bar that smoothly connects with open spiral arms in the outer disk. It has strong star formation in the central 1 kpc, but virtually no Hα emission beyond. Strong radio continuum emission from the central kpc is roughly coincident with the circumnuclear string of luminous H ii regions. A detailed morphological and kinematical study of the central regions of NGC 4064 is presented by Cortés et al. (2006). Along the bar, the stellar, molecular (CO), and ionized (Hα) gas velocity fields show strong non-circular motions indicative of radial streaming out to a radius of at least 1.5 kpc. The H i velocity field shows no evidence of non-circular motions, but this may be because the bar is not resolved at the resolution of the H i data. It is somewhat of a puzzle why this galaxy has such a severely stripped H i disk. The galaxy is located in the outskirts of the cluster (d87 = 2.5 Mpc), which makes ongoing ram pressure stripping due to the ICM seem unlikely. Crowl & Kenney (2008) estimate that star formation in the stripped part of the disk got quenched only 425 Myr ago, while it would take about 2 Gyr for the galaxy to travel from the core to its current location. Thus, the gas has not all been stripped in the cluster core. Although some galaxies appear to be stripped by ICM–ISM ram pressure at surprisingly large cluster distances, perhaps due to a dynamic lumpy ICM (Kenney et al. 2004; Crowl & Kenney 2008), NGC 4064 does not seem fully consistent with this scenario. While the outer stellar disk looks undisturbed, the large radial gas motions and circumnuclear starburst suggest a recent gravitational interaction. NGC 4064 may have experienced the combined effects of gravitational interaction and gas stripping in the cluster outskirts (Tonnesen et al. 2007), although the details remain uncertain.
NGC 4189. The H i disk is slightly more extended than the optical disk. The velocity field and position velocity slices show that the disk has a symmetric warp. Enhanced H i emission is found in the southeast, where a clumpy Hα ridge is present. The radio continuum shows enhanced emission along that same ridge in the southeast. Its Tully–Fisher distance estimate puts it significantly further than the Virgo mean distance. Gavazzi et al. (1999); Solanes et al. (2002); and Binggeli et al. (1985) argue that it belongs to the M cloud. H i emission has also been detected from two dwarf galaxies at similar velocities within <50 kpc distances (Figure 9). This makes it even more likely that NGC 4189 is in the background. If close to the cluster, the dwarfs would have been stripped of their H i.

Figure 9. H i distributions of NGC 4189 and two dwarf neighbors shown in white contours overlaid on the Digital Sky Survey (DSS) image.
Download figure:
Standard image High-resolution imageNGC 4192. The H i is more extended to the southeast, which is clearly seen in the PVD and the flux density profile. The velocity field shows distortion in the center which might be due to the presence of a bar (Warmels 1988a; Bosma 1981). The outer H i disk shows a warp. Warmels (1988a) reported an extended disk emission in continuum at 1.4 GHz, which we also have detected in spite of a small number of line-free channels. It has been classified as normal in Hα. See also Cayatte et al. (1990).
NGC 4216. The H i distribution is fairly regular but has a depression in the center, as shown by the radial surface profile. Its H i extent is slightly less than the optical extent. The overall H i surface density, however, is low for a spiral galaxy of this size. It is its H i surface density that makes this galaxy H i deficient. The velocity field looks regular but shows non-circular motions in the outer parts (see the velocity field). No radio continuum at 1.4 GHz has been detected. A prominent dust lane is present. Perhaps this galaxy has been affected by a process that affects the entire surface of the disk, such as viscous turbulent stripping or thermal evaporation.
NGC 4222. The H i extent is larger than the optical extent. The gaseous disk appears to be warped in the southwest as is apparent from the H i velocity field and the PVD. This galaxy was found in the same field as NGC 4216 (d ≈ 56 kpc in projection, Δv = 280 km s−1; see Figure 10). We do not find any clear signatures of interactions between the two, although it is interesting to see mild distortions at the edge of the disk in both systems. Unlike NGC 4216, NGC 4222 is not H i deficient and does not have an unusually low H i surface density, yet there is one more similarity: it is also not detected in radio continuum.

Figure 10. H i distributions of NGC 4216 and NGC 4222 overlaid on the DSS image. Both galaxies appear to be warped in the outer H i disk.
Download figure:
Standard image High-resolution imageNGC 4254. As a prototypical one armed spiral galaxy, NGC 4254 has been the subject of many studies. The H i morphology is highly asymmetric with a low surface brightness extension to the north. Optically, the one outstanding spiral arm winds around from the south to the southwest. The H i follows this stellar arm. However, just south of this arm, faint H i emission can be seen in the total H i image. These are the peaks of a giant H i tail imaged with Arecibo by Haynes et al. (2007). The tail wraps around NGC 4254 in the west and then extends north for a total length of 250 kpc. Most of its velocity is around 2000 km s−1, just outside the velocity range probed by the VLA. In that sense it is reminiscent of the long tail found near NGC 4388 (Oosterloo & van Gorkom 2005). The fact that both tails cover a velocity range well outside that of the associated galaxy is perhaps good evidence that these galaxies really are inside the cluster. The tail feels the additional cluster potential. There are, however, important differences between the tails. NGC 4388 is closer to the center of Virgo, and its tail is almost certainly due to ram pressure stripping (Oosterloo & van Gorkom 2005), while NGC 4254 is further away from the center of Virgo. Haynes et al. (2007) argue that the tail of NGC 4254 is probably the result of galaxy harassment, but simulations of Duc & Bournaud (2008) show that the morphology can be reproduced by one rapid close flyby.
NGC 4293. It is one of the two most H i deficient galaxies (defH i > 2) in the sample. The azimuthally averaged H i surface density is everywhere below 1 M☉ pc−2 and the H i isophotal diameter (DisoH i) is not defined. There is no H i emission in the center, but its central radio continuum is pretty strong, and the emission may be hidden by absorption. This means that in reality, we have a lower limit to the total H i mass and an upper limit to the H i deficiency. In fact, weak redshifted H i absorption is seen in the center, which indicates the presence of non-circular motion. It is truncated/anemic in Hα morphology. The misalignment between the outer stellar envelope and the inner stellar disk suggests a gravitational disturbance (Cortés 2005). This may be responsible for both the truncation in H i and the non-circular motion in the center.
NGC 4294 (Tango I ). Within the stellar disk, the H i morphology and kinematics are quite regular. The H i is slightly more extended to the southeast but the asymmetry is not significant along the major axis. Along the minor axis however, a long H i tail is found on one side of the southwest, which had been completely missed by Warmels (1988a). The length of the tail is about 23 kpc. The full data set, including both C- and D-array data, shows that the length of the tail is about 27 kpc. The H i tail does not have a stellar counterpart down to a limiting magnitude of r = 26 mag arcsec−2 in the SDSS. The stellar disk looks more diffuse in the southeast, while a strong spiral arm can be seen in the northwest side of the disk. The star formation property has been classified as normal (Koopmann & Kenney 2004b). However, the Hα morphology is quite asymmetric in the same way as the radio continuum, with more emission to the northwest (Koopmann et al. 2001). The lack of a stellar counterpart makes it less likely that a tidal interaction is the only cause of the tail. However, NGC 4299 is only 27 kpc away, and the two galaxies have almost the same velocity, with Δv ≈ 120 km s−1. A gravitational interaction between the two galaxies cannot be ruled out (Figure 11). See also the comments on NGC 4299 and Chung et al. (2007).

Figure 11. H i distributions (C+D) of NGC 4294 and NGC 4299 overlaid on the DSS image. Note that both tails point to the same direction to the southwest. The C+D image has revealed a longer tail for NGC 4294 and the second tail of NGC 4299 to the southeast more clearly. This pair of galaxies is located at ∼0.7 deg distance in projection to the southwest of M87.
Download figure:
Standard image High-resolution imageNGC 4298. The H i is more extended and diffuse to the northwest while the other side of the disk shows a sharp cutoff (see Figure 12). The H i rotation curve is also slightly asymmetric, rising more steeply in the northwest. The radio continuum emission shows a central point source and extended emission to the southeast, coinciding with the compressed H i. The stellar disk is more extended to the northwest at the opposite side of the H i compression. NGC 4302 is only 11 kpc away in projection with Δv ≈ 30 km s−1. The two galaxies are likely to be a physical pair, and an interaction might well have caused the lopsidedness of NGC 4298. A tidal interaction is less likely to be solely responsible for the H i morphology of NGC 4302. See also Chung et al. (2007).

Figure 12. H i distributions of NGC 4298 and NGC 4302 overlaid on the DSS image. They are only 11 kpc and ≈30 km s−1 away from each other. This pair of galaxies is located at 0.9 deg distance to the northwest of M87, with velocities close to the cluster mean motion.
Download figure:
Standard image High-resolution imageNGC 4299 (Tango II ). H i compression is seen in the southwest, and a long H i tail is found in the southwest. This tail points to the same direction as NGC 4294's H i tail without a stellar counterpart down to the SDSS limit. The fact that the tails are parallel makes it less likely that it is only a tidal interaction which has caused the tail. However, NGC 4299 shows some hints for tidal interactions as well. Optically, it has a very small/weak bulge and weak spiral arms, which are highly asymmetric. Also, as shown in Figure 11, a much broader H i tail is found in the southeast, which looks similar to tidal debris (Mihos 2003). As we argue in Chung et al. (2007), the pair, NGC 4294 and 99, is likely to be under the influences of both ICM pressure and tidal interaction. The Hα emission is enhanced to the south.
NGC 4302. The H i is mildly truncated to within the optical disk to the south, while a long tail is present in the opposite side (Figure 12; see also Chung et al. 2007). Its H i PVD presented here and in Chung et al. (2007) shows a "figure eight" feature. NGC 4302 appears to be box-shaped in the optical. These features suggest an edge-on view of a thickened bar (Bureau & Freeman 1999). The radio continuum is found along the prominent dust lane. The mild truncation of the H i to within the optical disk to the south suggests that this galaxy is undergoing ram pressure stripping, possibly also the cause of the H i tail seen in the north (Chung et al. 2007).
NGC 4321. This galaxy has an H i disk that is slightly larger than the optical disk. It has a low surface brightness extension to the southwest, coinciding with a very faint optical arm. The velocity field shows that the disk is slightly warped in the southwest. An H i depression is present in the center. NGC 4321 has a nuclear stellar bar and a prominent ring of circumnuclear star-forming regions (Wyder et al. 1998). The radio continuum emission peaks in the center, possibly contribute to the central depression in H i. A faint optical bridge is present in the northeast, which is connected to a dwarf companion, NGC 4323, at only 24 kpc distance away in projection, with a velocity difference of Δv ≈ 300 km s−1.
NGC 4330. The H i is much more extended to the southern side of the disk than the northern side. The northeast side of the H i disk ends with a sharp cutoff. On the other side, an extended H i tail is seen, starting well within the optical disk, but curving south–southwest. Along the western edge of the tail, radio continuum emission is seen. There is no optical counterpart down to the SDSS surface brightness limit (Chung et al. 2007), but the western side of the H i tail is also detected by GALEX (Figure 2), indicative of recent star formation. Chung et al. (2007) have argued that the galaxy is undergoing ram pressure stripping as it enters the cluster for the first time. More extensive discussion based on multi-wavelength data on this particular galaxy will appear in A. Abramson et al. (2009, in preparation).
NGC 4351 (Stubby tail ). The H i shows a short and broad extension in the southwest and a sharp cutoff in the northeast. It has a modest H i deficiency, and the H i and optical extents are similar. Its PVD is also asymmetric, showing a flat velocity gradient in the northeast, but a decreasing velocity gradient in the southwest. The radio continuum is quite strong in the northeast, the same side where the H i compression is found. Its location (d87 ≲ 0.5 Mpc) and extreme velocity with respect to Virgo (Δv > 1000 km s−1) suggest that the galaxy may be radially falling into the cluster and possibly experiencing strong ICM ram pressure. However, the nucleus and the optically brightest parts of the inner galaxy are significantly offset from the centroid of the outer galaxy isophotes, and the outer stellar disk shows suggestions of shell-like structure. Thus, some of the galaxy's peculiarities are likely caused by a gravitational disturbance.
NGC 4380. The H i distribution shows a mild asymmetry in a sense that the northwest disk is overall more dense compared to the southeast disk, which shows a slightly low H i surface density but extended. In the middle, little H i is found, and the radio continuum is very weak. Optically, the galaxy has a very weak bulge with a low surface brightness stellar disk without clear spiral features. Its Hα morphology has been classified as truncated/anemic. There is a hint of a stellar ring to the northwest where the highest H i column density is found. The galaxy is somewhat H i deficient without any obvious signatures of ongoing or recent ICM–ISM interaction.
NGC 4383 (Crazy). This is one of the most H i-rich galaxies in the sample, with defH i ≲ −0.8. The H i extent is enormous compared to the optical disk (DisoH i/D25 > 4). Within the stellar disk, its H i kinematics and morphology seem fairly regular, although even within the central 2', the major axis PVD shows some low-velocity gas, and the minor axis PVD shows some non-circular motions. Beyond this radius, the H i distribution and kinematics are irregular. There is a clear kinematical distinction between the inner (within the optical disk) and the outer H i, with different kinematic major axes suggestive of an irregular warp. Along the entire eastern side, there is a sharp kinematical discontinuity ∼2'–3' from the nucleus, whereas in the west, the transition is more gradual. The outer H i shows weak m = 2 spiral structure, with a weak arm to the south–southeast, and a somewhat stronger one to the north–northwest. The outer H i in the east–northeast forms a single irregular arm unrelated to the m = 2 pattern. Along the same eastern side as this irregular arm, but beyond the main body of H i, there are two distinct gas clouds: one to the east just beyond the main body of H i, but with a velocity which is ∼20 km s−1 offset, and the other 7' to the southeast. It is not impossible that both clouds are high surface brightness peaks in a more extended very low surface brightness structure. Hα and UV emissions are observed from roughly the same area as the stellar disk, with very little from the region of extended H i, except for a UV counterpart to the inner H i spiral arm in the north. NGC 4383 is a starburst galaxy, with strong Hα and UV emission from the central ∼1', and a biconical Hα nebulosity along the minor axis suggestive of an outflow. The galaxy is likely influenced by a combination of gas accretion and tidal interaction. The small galaxy 2.5 arcmin to the southwest of NGC 4383 is UGC 07504 (VCC 0794), a Virgo cluster galaxy with a velocity of 918 km s−1. This velocity is offset by 800 km s−1 from NGC 4383; thus they are not gravitationally bound and probably not physically associated. The velocity range of UGC 07504 is entirely outside the range of our VLA H i observations. However, the galaxy is undetected in radio continuum, Hα, and single dish H i observations (ARECIBO-05).
NGC 4388. Our VLA data show that the H i is very deficient, truncated, and asymmetric within the stellar disk, with a much greater extent to the east. There is an H i "upturn" extending vertically upward (north) from the outer edge of the H i disk in the west, suggestive of ongoing ram pressure from the southwest. WSRT observations show a ∼100 kpc long plume of H i extending toward the northwest of NGC 4388 (Oosterloo & van Gorkom 2005). The H i mass in this plume is similar to the H i mass remaining in NGC 4388. The plume is smoothly connected with NGC 4388 both spatially and in velocity and has no optical counterpart, suggesting that the H i plume is gas that was ram pressure stripped from NGC 4388 within the last few hundred Myrs. This plume was missed in the VIVA survey due to the limited bandwidth and reduced sensitivity at large distances from the field center. The highest H i surface densities of the plume gas occur beyond the half-width of the primary beam of the VLA, and at that point, the velocities of the gas are outside the velocity window of our observations. We note that the VIVA integrated profile is very asymmetric with an excess of H i at the high velocity side, where the plume connects with the disk. Yoshida et al. (2002) and Kenney et al. (2008) find very extended extraplanar Hα emission which might have originated from stripped cool ISM shocked by the hot ICM and/or the central AGN. This ionized gas is almost certainly part of the H i tail. Both the major and minor axis PVDs show redshifted absorption, indicative of non-circular motions. NGC 4388 was the first Seyfert galaxy discovered in Virgo (Phillips & Malin 1982), and its nuclear activity has been detected at many wavelengths (e.g., Veilleux et al. 1999; Yoshida et al. 2002; Iwasawa et al. 2003). It was also one of the first spiral galaxies in which anomalous radio continuum was detected with an elongated component crossing the nucleus and perpendicular to the optical disk (Hummel et al. 1983). Here, we detect strong radio continuum emission from the active galactic nucleus (AGN), as well as emission from the star-forming disk with almost the same extent and asymmetry as the H i disk.
NGC 4394 (Fruit Loop or Life Saver). The H i is quite deficient and is mildly truncated to within the stellar disk. The H i morphology and kinematics are remarkably regular and symmetric. An H i hole is found in the middle, which is quite common for strongly barred galaxies like NGC 4394. Optically, the galaxy is slightly asymmetric in the sense that the northeast spiral arm is more prominent than the one in the southwest. Its Hα classification is anemic, and its radio continuum emission is correspondingly very weak. It has a large apparent neighbor, the S0 galaxy NGC 4382 (M85) at ≈35 kpc projected distance with a velocity difference of Δv ≈ 200 km s−1. Although NGC 4382 has stellar shells suggesting that it might be a merger remnant (Schweizer & Seitzer 1992), we find neither in H i nor at other wavelengths any signatures of a tidal interaction between the two galaxies.
NGC 4396 (Crocodile). This galaxy has a prominent H i tail to the northwest (Chung et al. 2007), but unlike other Virgo galaxies with H i tails clearly caused by ram pressure, the origin of NGC 4396's tail is unclear. H i contours are compressed to the south but not at the southeast end of the major axis as would be expected if this were the leading edge of a strong ICM–ISM interaction (as is seen in NGC 4330, NGC 4388, NGC 4402). Hα and broadband images show that the distribution of star formation is asymmetric with only one prominent spiral arm found in the southeast. Radio continuum emission is strong in the center, and within the disk, it is stronger in the southeast where the one prominent Hα spiral arm is located. There is no radio continuum or UV emission associated with the H i tail, unlike what is seen in NGC 4330, NGC 4402, and NGC 4522. Deep optical imaging reveals that the outer northwest stellar disk is gas-free, and the H i tail leaves the stellar disk, consistent with a ram pressure stripping origin. However, there is no "radio deficit" observed at the southeast outer edge (Murphy et al. 2009), as expected for strong active ram pressure. Thus, the origin of the features in NGC 4396 is not completely clear.
NGC 4405. The H i is highly deficient and strongly truncated, and the stellar disk appears normal. The Hα image shows relatively normal star formation in the central 30% of the stellar disk and is sharply truncated beyond that. There are no compressed H i contours or significantly disturbed kinematics, so there is no evidence for ongoing ICM pressure. Its radio continuum is quite strong and slightly asymmetric with a possible extension to the southwest. Its properties are consistent with a strong ram pressure stripping event at least a few hundred Myr ago (Crowl & Kenney 2008).
NGC 4402. The H i is moderately deficient, moderately truncated to within the undisturbed stellar disk, and asymmetric. Within the disk, the H i extends further west than east. The H i contours are compressed in the southeast, and a modest H i tail exists in the northwest, suggesting active ram pressure from the southeast. The radio continuum has an extended tail to the northwest, extending further from the disk than the H i. The P.A. of this tail matches those of elongated dust filaments which Crowl et al. (2005) have interpreted as dense clouds being ablated by ram pressure. Further evidence of strong ram pressure acting from the southeast comes from the enhanced radio continuum polarization (Vollmer et al. 2007) and the radio continuum deficit region in this area (Murphy et al. 2009). As shown in Figure 13, several neighbors have been detected in the same field: IC 3355, which is in the VIVA sample, and NGC 4438, which is known for its optical peculiarities with a small H i disk. We also found a small H i cloud somewhere between IC 3355 and NGC 4438, with a velocity of ≈160 km s−1. It seems very possible that VCC 996 (v = −28 km s−1), whose optical center is only only 55'' from the H i peak of the cloud, is its optical counterpart.

Figure 13. H i distributions of NGC 4402 and its neighbors overlaid on the DSS image. The projected distance between NGC 4402 and NGC 4438 is ≈122 kpc at the Virgo distance. Mihos et al. (2005) have presented a deeper optical image of this region.
Download figure:
Standard image High-resolution imageIC 3355 (Casper). This is a peculiar low-mass, H i-rich object whose origin is unclear. Optical images show an elongated stellar body with no clear nucleus, a high surface brightness ridge with a sharp cutoff in the east, and lower surface brightness emission extending to the west. H i emission covers the entire stellar body, with two peaks that straddle the galaxy center. There are no compressed contours and no clear evidence of active ram pressure. The H i velocity field shows a very modest gradient across the main body, and the overall pattern is not one dominated by rotation. A small H i cloud with no known optical counterpart is present 2' to the west, connected by an H i bridge which extends from the southern part of the stellar body. The small H i cloud exhibits a larger velocity gradient (∼50 km s−1) than the main body of the galaxy, but there is no clear rotation pattern. The line-of-sight velocity of IC 3355 is near zero, and its membership to Virgo is controversial (Hoffman et al. 1988; Cayatte et al. 1990). However, it is unlikely to be in the Local Group, since the stellar light distribution is too smooth for such a nearby system. If it is in the Virgo cluster, its velocity and proximity in the sky to M86 make it very likely that this galaxy is associated with the M86 group. This galaxy is located 115 (∼55 kpc projected) from the spiral NGC 4402, ∼169 (∼79 kpc projected) from M86, and ∼168 (∼78 kpc projected) from the disturbed spiral NGC 4438. However, its Virgo membership might be questioned because (1) more massive galaxies in this neighborhood are severely stripped in H i (e.g., NGC 4438; Cayatte et al. 1990 and NGC 4402; Crowl et al. 2005), while this galaxy is H i rich and (2) in a recent deep optical image of this region (Mihos et al. 2005), this galaxy appears to be located outside of a huge common envelope of intracluster light (ICL) around the M86 group. Nonetheless, it is possible that IC 3355 is a member of the M86 group and has not yet been gas stripped. Its H i properties suggest it may have been disturbed by a gravitational interaction.
NGC 4419. The H i is highly deficient and severely stripped within the stellar disk (DisoH i/D25 < 0.5). It has very strong radio continuum emission from a nuclear source, likely an AGN (Decarli et al. 2007), plus weaker extended emission co-spatial with the Hα emission that traces the anemic star formation in the disk. Some H i is observed in absorption against the bright nuclear source, as shown in the PVDs. This absorbing gas is redshifted by ∼100 km s−1 with respect to the nucleus, providing evidence for non-circular motions in the central region. The presence of absorption has reduced the amount of H i seen in emission and accounts for the relative paucity of H i emission observed near the nucleus. Thus, the plots of the integrated H i emission and the radial distribution underestimate the amount of H i present near the nucleus. This is the only galaxy for which the otherwise excellent agreement with linewidths measured by ALFALFA breaks down, as the width measured with VIVA is almost 200 km s−1 larger. However, the profile shapes are in very good agreement, and we suspect that ALFALFA must have been misled by the absorption and not included the component at −100 km s−1. Optical images show an undisturbed stellar disk. There is neither extraplanar H i emission nor compressed H i contours detected in this highly inclined spiral, so there is no direct evidence of ongoing ram pressure. There may however be some hints of rather recent stripping. The outer H i extent is somewhat asymmetric with more emission in the southeast part of the disk, and optical images show disturbed dust lanes. CO emission is also strongly asymmetric in the disk of NGC 4419, but in the opposite sense from the H i, since there is more CO to the northwest than to the southeast (Kenney et al. 1990). The stellar population study of Crowl & Kenney (2008) shows that star formation in the gas-free outer disk stopped ∼500 Myr ago, and the galaxy could be experiencing fall-back after peak ram pressure.
NGC 4424 (Jellyfish). This is a very peculiar H i-deficient galaxy. It is one of the galaxies with long one-sided H i tails pointing away from M87 (Chung et al. 2007). The stellar disk is strongly disturbed, with shells and banana-shaped isophotes. There is strong star formation in a bar-like string of H ii complexes in the central 1 kpc, and no star formation beyond (Kenney et al. 1996). The radio continuum is quite strong in the circumnuclear region and shows two distinct off-nuclear peaks coincident with the brightest star-forming complexes. The central region also contains disturbed dust lanes and disturbed ionized gas kinematics (Cortés et al. 2006). This all clearly indicates a strong gravitational interaction, either a merger or close collision. Chung et al. (2007) find that the H i extent is much smaller than the optical disk along the major axis, while it has a remarkably long H i tail to the south (≈18 kpc at least). One end of the tail is curved to the southeast, pointing almost directly to M49, the giant elliptical at the center of the M49 subcluster, which is ≈0.44 Mpc away. In a recent follow-up study with the WSRT (T. Oosterloo et al. 2010, in preparation), the H i tail appears to extend over >40 kpc. Interestingly, the H i cloud that Sancisi et al. (1987) found near M49 is at the same velocity as NGC 4424's H i tail. This suggests a collision between NGC 4424 and M49 as a possible explanation for the peculiarities of NGC 4424. Further study is required to distinguish between this and other scenarios.
NGC 4450. The H i is overall moderately truncated with low surface density. Less H i is detected along the minor axis, but this could be because the low surface density gas is just below our detection threshold on the minor axis, where gas is spread out more in velocity. An H i depression is present in the center where there is a weak stellar bar. Strong radio continuum is detected from the nucleus, probably from an AGN. Optically, the galaxy shows tightly wound but weak spiral structure and anemic star formation. No obvious evidence for tidal or ongoing ICM–ISM interactions are found.
IC 3392. The H i is severely truncated to within the undisturbed stellar disk with DisoH i/D25< 0.5. In the channel maps, there is a hint of an H i extension along the minor axis, to the northwest. The H i distribution is fairly symmetric; there are no compressed H i contours, and the H i velocity field is regular. Thus, we do not find any signatures of ongoing pressure. The stellar population study of Crowl & Kenney (2008) shows that star formation in the gas-free outer disk stopped ∼500 Myr ago, and thus the galaxy seems to have been gas stripped a while ago and is no longer in an active phase of stripping. It is located only ≈125 kpc away in projection from NGC 4419, but the systemic velocities differ by (Δv ∼ 1900 km s−1), and the galaxies are unlikely to be physically related.
NGC 4457. The H i extent is smaller than the optical disk and quite asymmetric with the H i peak offset from the optical center toward the southwest. This H i peak coincides with the galaxy's one strong and peculiar spiral arm, which is very prominent in Hα. Quite strong radio continuum is present with almost the same extent as the H i. There are no compressed H i contours, and therefore, there is no evidence for active ICM pressure. The velocity field suggests that the H i disk is slightly warped, but there is no obvious signature of a tidal interaction in the H i kinematics or optically.
IC 3418 (Ghost). This is a peculiar low surface brightness system (IBm) found ∼1° to the southwest of M87, with a tail of UV emission to the southeast. We have not detected H i in this galaxy over the velocity range we searched (−250 to 250 km s−1). Until very recently, the galaxy's velocity and even its Virgo membership was not well known, and H i could exist outside our search window. Within our velocity window, the H i upper limit is ∼8 × 10⁶ M☉ assuming a linewidth of 100 km s−1. The first velocity measured using optical spectroscopy was 25,662 ± 74 km s−1 but with low reliability (Drinkwater et al. 1996). The observed very extended UV morphology (Figure 2) makes it extremely unlikely that the galaxy is that distant. More recently, Gavazzi et al. (2004) published an optical spectroscopic velocity of 38 km s−1, which we adopted for the H i observations. This redshift was recently confirmed (H. Crowl 2009, private communication) in a spectrum taken with LRIS at Keck. The velocity measured is ≈0 km s−1 ± 50 km s−1. Despite our non-detection, it is still possible that the galaxy has a very faint and extended H i disk. If it were smoothly distributed over an area of 3 × 1 arcmin2 as it is in UV, the noise goes up roughly by  (≈6.5) with the CS array (i.e., proportional to square root of the number of independent beams), which could have been missed in the VIVA study. We note that it has also neither been detected in ARECIBO-05 nor with ALFALFA, which covers the entire velocity range of the Virgo cluster. It is quite possible that its H i has been completely stripped if the galaxy is a true member of Virgo and close to M87 (its projected distance to M87 is only 0.28 Mpc). In that case, the UV stream may have originated from recent star formation due to the compression of the stripped H i gas.
NGC 4501. This large Sc galaxy is mildly H i-deficient. To the southwest, the H i disk is mildly truncated to within the stellar disk and has compressed contours, whereas to the northeast the H i is more extended and diffuse. These features have long been known from previous data (Warmels 1988a; Cayatte et al. 1990) and are suggestive of an ongoing ICM–ISM interaction (Cayatte et al. 1990). Our new data with better resolution and sensitivity show additional key details, such as the H i arm in the outer NE region with disturbed kinematics. Detailed comparisons with simulations suggest that NGC 4501 is in an early stage of ram pressure stripping (Vollmer et al. 2008). The compressed H i contours in the southeast are coincident with a ridge of strongly enhanced radio polarization (Vollmer et al. 2007) indicating the southeast as the leading edge of the ICM–ISM interaction. This is the side closest to M87, which suggests that NGC 4501 is currently entering the high-density region of the cluster for the first time.
NGC 4522 (Cashew). The highly inclined Sc galaxy NGC 4522 is one of the clearest cases of ongoing ram pressure stripping. This galaxy was observed by Kenney et al. (2004) as a pilot study of the VIVA survey. Its H i has been stripped to well within the optical disk (to 0.35R25 along the major axis), but there is significant extraplanar H i on one side of the disk. The peaks in the extraplanar H i are located just above the gas truncation radius in the disk, a gas morphology indicative of ram pressure stripping. The old stellar disk (R-band image) is relatively undisturbed, implying that ram pressure and non-tidal interactions are responsible for the disturbed gas distribution. The extraplanar H i in the west is kinematically distinct from the adjoining disk gas, with velocities offset toward the Virgo cluster mean velocity. Enhanced radio polarization along the eastern edge, on the side opposite the extraplanar H i (Vollmer et al. 2004b), and a deficit of radio continuum emission relative to far-infrared emission beyond the polarized ridge (Murphy et al. 2009) both indicate strong active ram pressure. In a comparison of simulations and data, Vollmer et al. (2006) find that the galaxy is in an active phase of ram pressure stripping, and the best match to the H i morphology and kinematics is 50 Myr after peak pressure. Studies of the stellar population by Crowl & Kenney (2006, 2008) show that star formation in the gas-free outer disk stopped ∼100 Myr ago, consistent with the stripping timescale from simulations. This galaxy is located 3.3 deg (∼0.8 Mpc) from M87, where the estimated ICM pressure, assuming a smooth and static ICM, is too low to remove the H i from the disk. Kenney et al. (2004) have argued that motion or substructure in the ICM, perhaps due to the merging of the M49 group with the main cluster, could have increased the ram pressure on this galaxy. In fact, NGC 4522 is near a local peak in X-ray emission, a ridge where X-ray spectroscopy shows high temperatures, possibly indicating a shock front in the ICM (Shibata et al. 2001).
NGC 4532. NGC 4532 is an H i-rich, optically peculiar Sm galaxy with strong Hα emission indicating a high star formation rate. In Figure 14 as well as in the atlas, we present the same data as the C-array data of Hoffman et al. (1999). The H i distribution around this galaxy is patchy with several clumps and a remarkably sharp east–west extension. Kinematically, NGC 4532 appears to be in regular rotation with a warp in the outer parts; the east–west feature is kinematically decoupled from the galaxy and may be the tip of a huge tail seen by ALFALFA (Koopmann et al. 2008). The total flux measured in this region (55.9 ± 1.2 Jy km s−1) is consistent with what Hoffman et al. (1999) found in their C+D data (50.9 Jy km s−1). The ALFALFA showed recently that NGC 4532 and VCC 1581 (Holmberg VII) are embedded within a large common envelope, which continues to the south as a 500 kpc long H i tail (Koopmann et al. 2008). The extended tail is far outside the primary beam of the VLA and could not have been detected in the VIVA survey. A comparison of the total flux seen by ALFALFA and VIVA shows that there is about as much H i in the diffuse envelope around the pair as there is in the galaxies and small clouds seen by the VLA. It is particularly interesting to compare the velocity fields seen by the VLA and by ALFALFA. The giant tail connects to the galaxy pair in what is called the W cloud (Koopmann et al. 2008) at a velocity of about 1875 km s−1. This is the same velocity seen by the VLA west of NGC 4532 in the east–west feature. We conclude then that the huge tail ends in the east–west feature seen by the VLA and crosses NGC 4532. NGC 4532 is possibly influenced both by tidal effects and gas accretion.

Figure 14. H i distributions of NGC 4532 region overlaid on the DSS image. Only the C array data of Hoffman et al. (1999) are shown, while the total flux is well consistent with theirs combined with the D array data. More sensitive H i data taken with the Arecibo data (ALFALFA survey; Koopmann et al. 2008) have revealed that NGC 4532 and VCC 1581 (Holmberg VII) are embedded in a common H i envelope, which continues to the south as a 500 kpc long H i tail.
Download figure:
Standard image High-resolution imageVCC 1581, Holmberg VII. This is an optically faint low-mass galaxy that lies within the huge H i envelope (see Figure 14) that also covers NGC 4532 (Koopmann et al. 2008). Optically the galaxy has no clear nucleus or symmetry. The H i distribution and kinematics are fairly regular and symmetric, except for a cloud with distinct kinematics 1' northeast of the center.
NGC 4535 (Snail). The H i content is relatively normal and extends somewhat beyond the stellar disk. Sharp H i cutoffs to the north and northwest, toward M87 with further extension to the opposite side of the disk, are suggestive of weak ongoing ram pressure. Vollmer et al. (2007) and Wezgowiec et al. (2007) detected polarized radio continuum in the center and the southwest of the outer galactic disk. They argue that this asymmetry is mostly due to an interaction with the ICM. The outermost H i spiral arm to the west and southwest is kinematically distinct, with a sharp velocity gradient rather than the more gradual and continuous curvature characteristic of spiral arm streaming motions. There is also no other spiral arm in the galaxy that shows such kinematic distinctness, supporting the picture that the west–southwest arm might be due to ram pressure rather than spiral density waves. It appears similar to the kinematically distinct gas-stripped outer arm of NGC 4569. An H i depression is found in the central 5 kpc where a stellar bar is present. The radio continuum from the nuclear region is quite strong, probably due to an AGN.
NGC 4533. This galaxy has been detected at ∼8' (39 kpc) distance to the north of NGC 4536 (Figure 15). The H i is symmetric in the inner parts and has a diffuse asymmetric outer envelope and a short H i tail extends to the southeast. Optically, it is a small Sd galaxy (BT = 14.2 and D25 = 21) and its stellar disk also looks asymmetric, in the sense that the northwest side is slightly warped and the southeast disk is broader than the northwest disk. There are two stellar tails to the southeast, where the H i tail is present. Since this galaxy is close spatially and in velocity to NGC 4536 it is plausible that the two galaxies are gravitationally interacting.

Figure 15. H i distribution of NGC 4536 and NGC 4533 overlaid on the DSS image. This pair of galaxies, about 39 kpc apart from each other in projection with similar vH i, shows some morphological and kinematical peculiarities.
Download figure:
Standard image High-resolution imageNGC 4536. The H i disk is about the same size as the stellar disk and the high column density H i ridges coincide nicely with the optical spiral arms. The galaxy is located in the southern outskirts of the cluster (>2.8 Mpc from M87) and shows no clear signature of any kind of large disturbance. It is only 39 kpc away in projection from NGC 4533 with Δvopt < 10 km s−1 (or ΔvH i ≈ 50 km s−1). It is possible that this galaxy is responsible for NGC 4533's peculiarities. During the close encounter with NGC 4533, this galaxy may have been less affected because it is more massive (by a factor of ≳4), while NGC 4533 has been quite disturbed. It does, however, have a small bar in the central ∼1', apparent in both the optical morphology and the H i PVDs, and the bar might have originated from a tidal interaction.
NGC 4548. The H i is mildly truncated to within the optical disk and has a low surface density (DisoH i/D25 = 0.86 and defH i = 0.81 ± 0.01), resulting in a rather large H i deficiency. An H i hole is found in the central 5 kpc where a strong stellar bar is present. This galaxy was also observed by Vollmer et al. (1999) with a data quality very similar to ours. Vollmer et al. (1999) point out that the faint outer H i arm in the north appears kinematically slightly distinct from the adjacent disk and suggest that this could have been caused by a past episode of ram pressure. We find no evidence for ongoing ICM pressure or tidal stripping. Kinematically distinct H i is often found in the outer parts of spiral galaxies in the field, and it need not be related to the cluster environment. However, its Hα morphology does suggest that NGC 4548 is anemic. The radio continuum emission is extremely weak, even for an anemic spiral (Wezgowiec et al. 2007).
NGC 4561. The H i in this small Sm or Sc galaxy shows very high surface density in the center while it is very extended, with two open symmetric gas spiral arms reaching far beyond the stellar disk, to 2–3 R25. The gas spiral arms appear to be superposed on a very low surface brightness outer H i disk. There is no evidence of either young or old stars in these H i arms. The H i velocity field shows strong non-circular motions with m = 2 symmetry, even within the optical disk. There is a small stellar bar in the central 30'', but this small feature cannot account for the widespread non-circular motions. The H i morphology could either be the result of a merger between two small systems in which the outer H i is now falling back and forming a new disk (e.g., Barnes 2002), or, alternatively, it could have been pulled out during an encounter with nearby galaxy IC 3605, which is ≈150 kpc away with Δv = 300 km s−1. The m = 2 symmetry places strong constraints on any interaction scenario. Lastly, the outer H i could be the remains of a giant low surface brightness disk that is now being disturbed by the non-axisymmetric stellar body in the center.
NGC 4567 and NGC 4568. This pair of Sc galaxies overlap in the sky (Figure 16), and their line-of-sight velocities match where the galaxies overlap. Optically, neither shows significant disturbances in their inner disks, while both look mildly disturbed in their outer parts. Likewise, the H i morphology and kinematics look fairly undisturbed within the brighter parts of the stellar disks. In the outer parts of NGC 4568, H i contours are more compressed in the east, toward NGC 4567, and more extended in the west, where the kinematics suggests a warp or other disturbance. A prominent dust lane at the apparent intersection region between the two galaxies suggests that they are physically connected. A little H i tail extends northwest of the pair, and appears to be an extension of the dust lane. The H i morphology suggests that the galaxies are gravitationally interacting, but are in a phase before closest approach and so are not yet strongly disturbed. The total H i flux of the pair is consistent with single dish measurements. Since the galaxies overlap both spatially and in velocity, it is difficult (and perhaps not too meaningful) to ascribe an accurate H i flux for each galaxy. The fluxes presented in Table 3 are based on assigning all the fluxes in the overlap region to NGC 4568 since the H i contours suggest that this may be appropriate.

Figure 16. H i distributions of NGC 4567 and NGC 4568 shown in contours overlaid on the DSS image. The two galaxies do not just overlap due to projection, but are actually interacting with each other as the channel maps or the PVDs show clear connections.
Download figure:
Standard image High-resolution imageNGC 4569. The H i disk is only extended about one third of the stellar disk. Anomalous arms of H i and Hα emission to the west lie behind the stellar disk (D. P. Kenney et al. in preparation). This extraplanar H i, which is kinematically distinct from the disk gas, is very likely gas stripped from the disk by ram pressure. A stellar population study of the gas-free outer stellar disk (Crowl & Kenney 2008) and a comparison of the H i morphology and kinematics with simulations Vollmer et al. (2004a) both indicate that the gas was stripped from the outer disk ∼300 Myr ago. Radio continuum emission associated with star formation is detected throughout the remaining gas disk (see also Boselli et al. 2006). At fainter levels, there is radio continuum emission near the minor axis on both sides extending 24 kpc from the center, likely arising from a nuclear outflow (Chyzy et al. 2006). Due to its negative velocity and large appearance (≈10'), its cluster membership has been controversial for a long time (e.g., Rodgers & Freeman 1970; Stauffer et al. 1986). Recent Tully–Fisher based distance estimates place NGC 4569 somewhat closer than the mean Virgo distance (Solanes et al. 2002; Cortés et al. 2008). The H i evidence for ICM–ISM stripping strongly suggests that NGC 4569 is part of the cluster.
NGC 4579. This galaxy is moderately H i-deficient, and its H i is mildly truncated to within the optical disk. But the H i distribution and kinematics appear symmetric and regular, with no indications of any ongoing interaction. There is a deep depression in the central 4 kpc coincident with a stellar bar. The star formation rate is relatively normal in the disk. It has a well-known Seyfert 2 nucleus, with radio jets (Contini 2004). It shows a strong radio continuum emission, both from the nuclear source and the extended star-forming disk.
NGC 4580. The H i is very deficient and severely truncated to within the optical disk (DisoH i/D25 < 0.5 and defH i > 1). The Hα is also truncated with a sharp edge. The H i peak is slightly offset from the optical center and more emission is present in the southeast. The radio continuum appears more extended than the H i disk in the south. The outer stellar disk appears undisturbed, although it still contains spiral arms. The H i truncation and undisturbed stellar disk strongly suggest an ICM–ISM interaction. The stellar population study of Crowl & Kenney (2008) indicates that star formation stopped in the gas-free outer stellar disk 500 Myr ago. This galaxy is so far from the cluster core that it could not have reached its current location by traveling from the core only 500 Myr ago, so it must have been stripped outside the core.
NGC 4606. The H i extends only one tenth of the stellar disk. The H i peak is offset from the optical center, with slightly more emission to the west. A faint low surface brightness H i feature extends to the east near the minor axis. The Hα is strong in the central kpc but severely truncated within the optical disk and asymmetric in the same way as the H i. The radio continuum is quite strong in the center with almost the same extent as the H i disk. The stellar disk is disturbed (Cortés 2005), with non-elliptical isophotes and a greater extension to the northeast. Disturbed dust lanes are also apparent. This galaxy may have experienced some type of gravitational interaction, although it is not clear what the relative roles of ram pressure and tidal interactions may have been in shaping the H i properties.
NGC 4607. The H i in this edge-on galaxy is truncated to within the stellar disk and the galaxy is strongly deficient in H i (DisoH i/D25 ≈ 0.7 and defH i = 0.82). As shown in Figure 17, NGC 4607 is located near NGC 4606 with a projected distance of only about 20 kpc. However, the two galaxies have very different velocities with Δv ≈ 600 km s−1, making it unlikely that they are gravitationally bound. Although NGC 4606 looks somewhat optically disturbed, we find no evidence for a tidal disturbance in the optical or H i appearance of NGC 4607.

Figure 17. H i distributions of NGC 4606 and NGC 4607 shown in contours overlaid on the DSS image. The projected distance between the two galaxies is ≲20 kpc while Δv ≈ 600 km s−1.
Download figure:
Standard image High-resolution imageNGC 4651. While the bright central part of this Sc galaxy (inside R25) appears relatively symmetric and undisturbed both in the optical and in H i, the H i beyond the stellar disk looks more disturbed, possibly warped, and on the western side, the H i appears to become more narrow and form a tail-like feature. The H i kinematics of the outer galaxy has a different P.A. from the inner galaxy, confirming that the outer H i may be warped. While the inner optical disk is quite symmetric, a high contrast optical image reveals a remarkably straight optical tail to the east, which ends at a low surface brightness arc (Figure 18). Although no H i is at the position of the optical tail and arc, Figure 18 shows that 50 kpc away from the stellar shell (and at about 80 kpc distance from the center of NGC 4651) in the direction of the stellar tail, there is a small H i cloud of SH i = 0.36 Jy km s−1 (MH i = 2.2 × 10⁷ M☉). The H i cloud has an optical counterpart (MAPS-NGP7 O_437_0366458; Canabela 1999). This dwarf galaxy may well have a tidal origin. The H i surface density drops steeply in the central 2 kpc. Although there is quite strong radio emission found in the center of the galaxy (50 mJy), the low surface brightness makes it unlikely that the depression in H i is due to absorption.

Figure 18. H i contours of NGC 4651 shown overlaid on a high contrast DSS image. The H i distribution is asymmetric in a sense that it is more extended to the west. In the opposite side of the H i tail, a stellar tail is found, which ends with a shell. On the same side of the disk, we also have detected a small H i cloud of ≈2.2 × 10⁷ M☉ at ≈80 kpc distance from the center of NGC 4651. The cloud has an optical counterpart, MAPS-NGP O_437_0366458 (Canabela 1999).
Download figure:
Standard image High-resolution imageNGC 4654. We present the same data published in Phookun & Mundy (1995). The H i map shows an extended tail to the southeast and compressed contours to the northwest. Phookun & Mundy (1995) have attributed its H i peculiarities to the ram pressure due to the ICM. The stellar disk extends beyond the H i in the northwest, suggesting an ICM–ISM interaction. However, the inferred ICM pressure alone may be too low to strip the H i at this location ∼1 Mpc from M87 (Chung et al. 2007). Alternatively, Vollmer (2003) has shown that the H i morphology and kinematics are best reproduced by a combination of both ram pressure and a gravitational interaction (e.g., with its neighbor NGC 4639). In fact, the stellar disk also appears to be somewhat disturbed, with more diffuse emission to the southeast, which makes it more plausible that a gravitational disturbance took place as well. See also Chung et al. (2007).
NGC 4689. The H i in this galaxy is mildly truncated to within the stellar disk, with a moderate H i deficiency. The H i morphology and kinematics are fairly regular and symmetric, showing no signatures of ongoing ram pressure or tidal interactions. Weak radio continuum emission is detected over about half the H i disk. The galaxy is also mildly truncated in Hα.
NGC 4694. The H i in this galaxy is highly disturbed and irregular, and bears little relation to the stellar disk, as shown in Figure 19. The H i extent along the major axis is much smaller than the stellar disk, but along the minor axis is relatively more extended. The southwest extension is connected to its optically faint neighbor, VCC 2062, and continues well beyond that galaxy. The H i peak within the stellar disk almost coincides with the optical center; however, the morphology and kinematics are quite asymmetric along both the major and the minor axes. Overall, the H i properties are consistent with an accretion event, and inconsistent with ram pressure stripping. Strong radio continuum emission is present at the center. Optically, it has a large bulge with an extended but low surface brightness disk. The lack of H i and star formation in the outer stellar disk, and the disturbed appearance of the central bulge-dominated region, in part due to irregular dust lanes, contribute to its peculiar SB0 or Amorphous classification.

Figure 19. H i distribution of NGC 4694 region shown overlaid on the DSS image. The H i is stripped on both sides of the stellar disk, while short and long extensions are found to the northeast and southwest along the minor axis. The H i feature in the southwest also covers a low surface brightness galaxy, VCC 2062, and extends more than 30 kpc from the center of NGC 4694.
Download figure:
Standard image High-resolution imageVCC 2062. A huge H i cloud is found to cover both this low surface brightness dwarf galaxy and part of the nearby disturbed spiral NGC 4694 (Figure 19). The H i peak almost coincides with the position of the highest surface brightness in the optical. Neither the H i nor the optical morphology is well structured, while a relatively smooth H i velocity gradient is present across the stellar disk. No radio continuum is found. It is obvious that VCC 2062 is tidally interacting with NGC 4694, although the origin of the stellar component of VCC 2062 is rather unclear, i.e., whether it has tidally formed or it has been destroyed due to the tidal interaction. Recently, Duc et al. (2007) have reported their CO detection from this system.
NGC 4698 (Fish tail). The H i disk is almost a factor 2 larger than the stellar disk. Its H i morphology and kinematics are fairly undisturbed but two short tails are found in the southeast, while to the northwest, which is toward the cluster center, the H i appears to be fairly compressed. Thus, the galaxy may be experiencing weak ram pressure as it approaches the cluster core. Optically, it has a low surface brightness ring at the location where ΣH i ≈ 1 M☉ pc2 as well as an inner stellar ring at smaller radii. This galaxy is known for its orthogonally rotating bulge which was optically discovered (Bertola et al. 1999). Hα ionized gas kinematics show a clear decoupling of the gas and stellar kinematics in the central few kpc (Cortés 2005), and the H i kinematics show hints of this. The galaxy likely experienced a merger over 1 Gyr ago, and is now experiencing an unrelated episode of early stage ISM–ICM ram pressure stripping.
NGC 4713 (Crab). This galaxy has one of the most extended H i disks in the cluster as compared to the optical disk and shares many properties with NGC 4808, one of its nearest large neighbors in the southern outskirts of the cluster. The H i velocity field suggests a disturbed warp for the gas beyond the stellar disk. There are different H i velocity gradients and P.A.s on the two sides of the disk. It is classified as an Sc or Sd galaxy, with very strong star formation distributed somewhat irregularly throughout the stellar disk. The H i surface density distribution has a depression in the center coincident with a stellar bar. A prominent optical spiral arm in the northwest lies just inside an outer H i arm. Our H i data for this galaxy are much older and noisier than most of the VIVA data. Yet, our measured total H i flux is only 10% less than the flux measured by a single dish telescope in the ALFALFA survey, and despite our noisy data, we recovered almost all of the H i. The radio continuum distribution is also irregular, with an extended off-nuclear peak in the east, and a secondary peak in the west just inside the prominent spiral arm.
NGC 4772. This galaxy was imaged previously by Haynes et al. (2000) in C array. Although our data were taken with CS array and better software was available, including the option to use robust weighting, our results are similar to those of Haynes et al. (2000). A prominent outer H i ring is present. Compared to the inner H i disk, the outer H i ring is at a different P.A. and has a lower peak line of sight velocity, and may therefore lie in a different plane. The inner H i appears slightly warped at the end of the stellar disk, and the warp feature may connect the inner disk and the outer H i ring. Its optical morphology resembles that of NGC 4698 with a strong bulge and a low surface brightness disk. As in NGC 4698, the H i extends well beyond the optical disk. A comparison of stellar and Hα gas velocities by Haynes et al. (2000) shows central gas components with anomolous velocities. Both the H i properties and the central gas kinematics are suggestive of a minor merger (Haynes et al. 2000), and the relatively symmetric H i and stellar morphologies suggest an older event.
NGC 4808. This galaxy is very H i rich. The H i is much more extended than the stellar disk, and both the H i morphology and kinematics suggest a strong and asymmetric warp. Optically, the galaxy has been classified as Scd with a very weak bulge. There is strong star formation throughout the stellar disk, with an asymmetric and patchy distribution. H i has been detected from two nearby dwarf galaxies in the VLA D array data (Figure 20). Although no evidence for tidal interactions is found, the three galaxies are located within ≲60 kpc distances from each other with similar velocities (Δv < 100 km s−1), and it is very likely that these galaxies are under the influence of one another. Apart from the nearby dwarf galaxies, NGC 4808 shares many properties with NGC 4713, one of its nearest large neighbors in the southern outskirts of the cluster.

Figure 20. H i distributions of NGC 4808 and nearby dwarfs overlaid on the DSS image. The combined data of the C and the D configurations are presented. The dwarfs have been discovered in our recent D array follow-up observations.
Download figure:
Standard image High-resolution image
Download figure:
Standard image High-resolution image
Download figure:
Standard image High-resolution image
Download figure:
Standard image High-resolution image
Download figure:
Standard image High-resolution image
Download figure:
Standard image High-resolution image
Download figure:
Standard image High-resolution image
Download figure:
Standard image High-resolution image
Download figure:
Standard image High-resolution image
Download figure:
Standard image High-resolution image
Download figure:
Standard image High-resolution image
Download figure:
Standard image High-resolution image
Download figure:
Standard image High-resolution image
Download figure:
Standard image High-resolution image
Download figure:
Standard image High-resolution image
Download figure:
Standard image High-resolution image
Download figure:
Standard image High-resolution image
Download figure:
Standard image High-resolution image
Download figure:
Standard image High-resolution image
Download figure:
Standard image High-resolution image
Download figure:
Standard image High-resolution image
Download figure:
Standard image High-resolution image
Download figure:
Standard image High-resolution image
Download figure:
Standard image High-resolution image
Download figure:
Standard image High-resolution image
Download figure:
Standard image High-resolution image
Download figure:
Standard image High-resolution image
Download figure:
Standard image High-resolution image
Download figure:
Standard image High-resolution image
Download figure:
Standard image High-resolution image
Download figure:
Standard image High-resolution image
Download figure:
Standard image High-resolution image
Download figure:
Standard image High-resolution image
Download figure:
Standard image High-resolution image
Download figure:
Standard image High-resolution image
Download figure:
Standard image High-resolution image
Download figure:
Standard image High-resolution image
Download figure:
Standard image High-resolution image
Download figure:
Standard image High-resolution image
Download figure:
Standard image High-resolution image
Download figure:
Standard image High-resolution image
Download figure:
Standard image High-resolution image
Download figure:
Standard image High-resolution image
Download figure:
Standard image High-resolution image
Download figure:
Standard image High-resolution image
Download figure:
Standard image High-resolution image
Download figure:
Standard image High-resolution image
Download figure:
Standard image High-resolution image
Download figure:
Standard image High-resolution image
Download figure:
Standard image High-resolution image
Download figure:
Standard image High-resolution image
Download figure:
Standard image High-resolution image
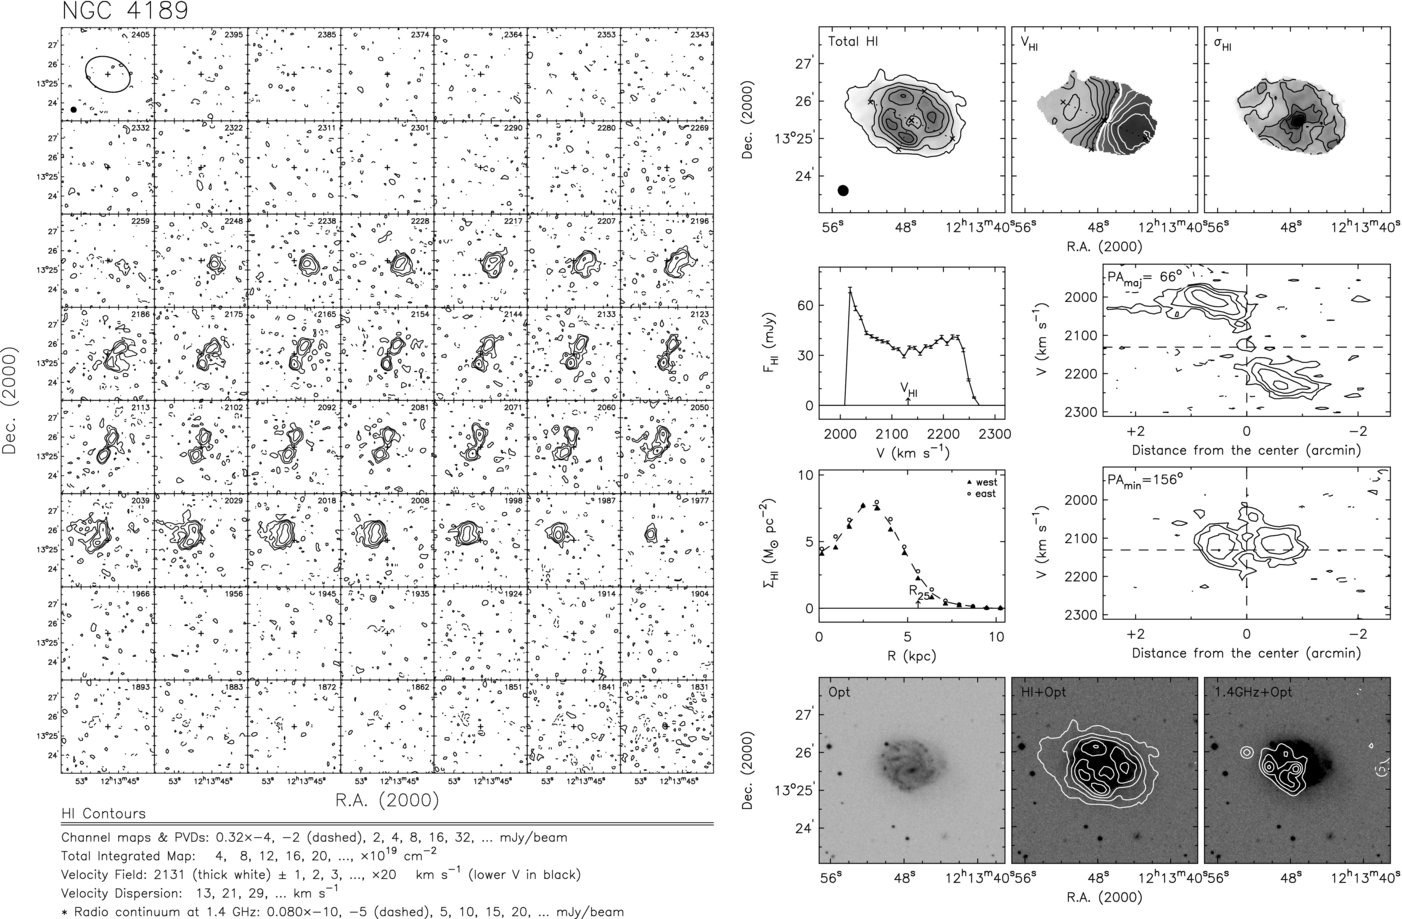
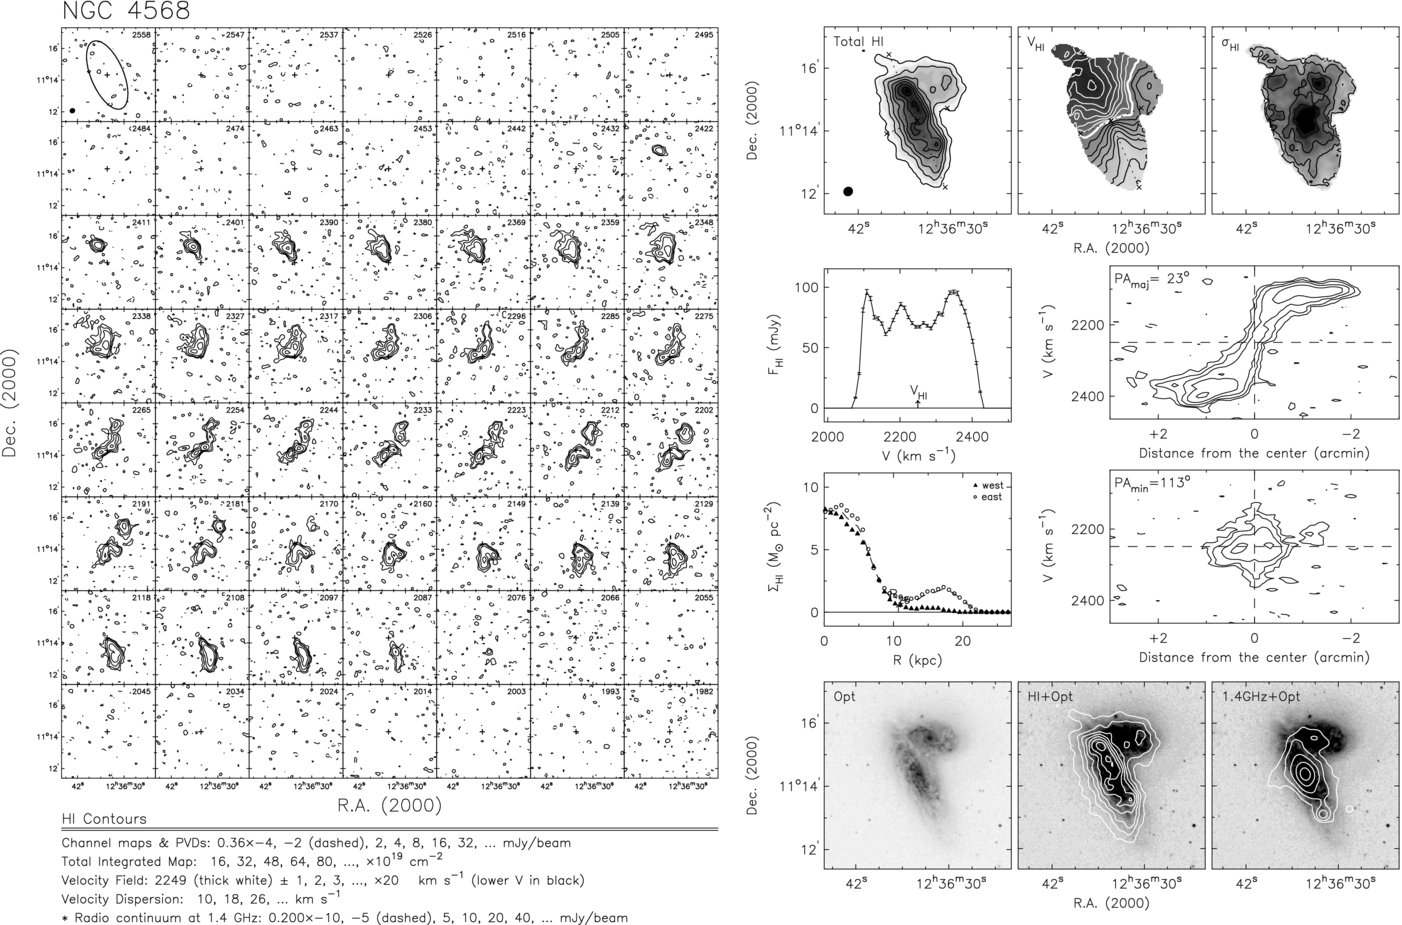
Download figure:
Standard image High-resolution image
Footnotes
- 6
The VLA is operated by the National Radio Astronomy Observatory, which is a facility of the National Science Foundation (NSF), operated under cooperative agreement by Associated Universities, Inc.
- 7
Minnesota Automated Plate Scanner - North Galactic Pole.