

Abstract
Under the background of the energy transition, the ecosystems are threatened by the rapid expansion of renewable power plants, especially wind turbines with enormous sizes. While the potential ecological influence near wind farms has not been extensively studied. In the process of wind farm site selection, there is no uniform methodology to assess the ecological impact on the local ecosystem. This paper proposed a research framework to quantify the impacts on ecological corridors under the influence of wind farms. Taking five wind farms in Ningbo Peninsula as cases, the geographical data from Landsat 8, NDVI, DEM, and wind turbine data from Vortex were selected from 2010 to 2020. The ecological sources and resistance surfaces were analyzed with and without wind farms under least-cost distance and least-cost path models. The results revealed that wind farms could increase the migration resistance that prevents the species' ecological corridors, and change the number and routes of main ecological corridors. Additionally, the cumulative resistance value positively correlated with the distance between ecological sources. Through GIS spatial quantification assessment, this paper helps balance wind energy development and regional ecological security and provides scientific and orderly planning suggestions for the healthy development of the regional ecological network.
Export citation and abstract BibTeX RIS

Original content from this work may be used under the terms of the Creative Commons Attribution 4.0 licence. Any further distribution of this work must maintain attribution to the author(s) and the title of the work, journal citation and DOI.
1. Introduction
In the context of global climate change, China is confronting significant obstacles to both economic expansion and low-carbon transformation. Among all the carbon-neutrality strategies, renewable energy is becoming a key instrument in replacing fossil fuels. This development has significantly accelerated the low-carbon transition in the construction, transportation, and manufacturing sectors. By reducing coal use and carbon emissions, the widespread use of renewable energy is expected to reverse climate change [1]. The demand for renewable energy will significantly rise under China's 2060 carbon neutrality target orientation [2]. The installed capacity of wind energy in China raised from 30 GW in 2010 to over 300 GW in 2021, ranking first worldwide (figure 1). Among all the renewable energies, wind energy receives great popularity due to its established technologies, affordable price, and abundant resource reserves. With a total installed wind capacity of 338 GW at the end of 2021 [3], China leads the world in the wind sector and has made significant advancements in the production and generation of wind energy.
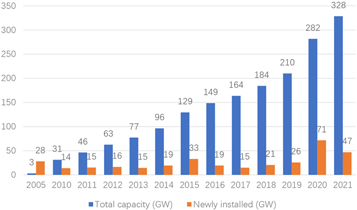
Figure 1. The total capacity and newly installed wind energy in China (Source: Chinese National Energy Administration).
Download figure:
Standard image High-resolution imageThe extensive construction of wind farms may pose impacts on the environment [4, 5]. The unpredictability of wind facilities' effects on the environment and landscape (such as noise [6], shadow flicker[7], microclimate change [5, 8], visual impact [9, 10], threats to wild animals [11], and annoyance to humans [12–14]) has led to the need for more rigorous standards for wind farm site selection and planning approval [15]. In addition to the normal environmental effects mentioned above, wind farms may have long-lasting effects on ecosystems that are difficult to detect and measure. According to Fagúndez [16], the operation of wind farms had an impact on the biomass and species of the local flora, decimating wildlife habitat and migratory paths. As noted by Barré et al [17], Marques et al [18], and Katzner et al [19], wind turbines may result in regional ecological fragmentation, ecological degradation, habitat loss, and biodiversity decline, further lowering the value of the ecological services provided in the area. Guo et al [20] indicated that wind farms could also affect the original landscape pattern, specifically in terms of spatial heterogeneity, landscape connectivity, and landscape diversity. Environmental justice and public acceptance have become hotly debated due to the growing ecological degradation [21, 22]. Although ecological degradation is considered an inevitable side-effect of wind energy development, there is a lack of a scientifically effective method to evaluate the magnitude and scale of impact on local ecosystems. The expansion of wind energy has created an urgent need for research on the interactions between wind energy and ecological corridor patterns, ecosystem function maintenance, and regional ecological security.
GIS has been utilized extensively in wind farm planning, such as site selection, environmental impact assessment, and compensation measures [23, 24]. With a deeper integration of wind power planning with society, economy, and environment, the research focus has upgraded from buffer distance [25], visual impact [26], impact on wildlife [27], and land use conflict compromise [28] to multi-criteria decision making approaches [29]. Zonation, a spatial prioritization tool, was used by Virtanen et al [30] to analyze high-dimensional geographical data for wind energy planning. Pınarbaşı et al [31] created a spatial planning model based on Bayesian Belief Networks to find feasible spatially explicit offshore wind farm sites. Göke et al [32] used the decision-support tool Marxan to accomplish the offshore wind planning goals and prevent conflicts with important ecological aspects. The planning tools for wind farms have been improved by a variety of software and integrated approaches, which have also accurately covered potential elements and produced a more accurate and sensitive analysis to assist decision-making. However, the influence of wind farms on ecosystems has not been thoroughly studied in the existing literature. There is an absence of competent methodology, research frameworks, and quantitative data to support inferences.
Establishing effective and stable ecological networks is critical insurance for sustainable regional development and ecological security [33]. The ecological network provides close connectivity and exchange of species, energy, and information in specific spaces by identifying the patches as ecological sources and connecting them with corridors [34]. Recent research on ecological networks primarily concentrates on biodiversity conservation [35], landscape connectivity [36, 37], and ecological service [38, 39]. Ecological corridors are land connections that help species move between patches and improve mobility and connectivity between ecological elements. These corridors make the spatial pattern of ecosystems holistic and internal [40]. The creation and restoration of ecological corridors can further enhance ecological functions in terms of biodiversity protection, environmental protection of ecological resources, development of ecological security, and effective responses to global climate change [41]. The construction of wind farms can shatter the ecological networks and reduce the ecological functions due to their vast scale on the original landscape pattern [42]. Several studies have confirmed that wind farms can disturb species' habitats and migration paths, thereby reducing their populations [43–45]. Therefore, conducting a large-scale quantitative ecological impact assessment of wind farms is crucial in order to weigh the trade-off between wind energy development and ecological preservation.
Among all the research methods, the least-cost distance (LCD) and least-cost path (LCP) models are frequently used to conduct quantitative studies on ecological corridor construction and restoration, the creation of ecological networks, and other topics [46, 47]. The 'least-cost' modeling is a distance measure incorporating the costs of migrating between habitat patches [48]. It is based on exact geographic data and behavioral characteristics of the species related to the research target. The source patches and resistance surface are the two key criteria used in the LCP model to identify the least cost path. Sources are basic units with positive net reproduction [49]. The resistance surface, generated by analyzing, weighting, and overlaying cost variations, reveals how cost variations facilitate or hinder movement when species migrate from one source patch to another. Constituting a resistance surface requires finding a group of variations oriented to the research objectives.
This paper aims to explore the impact of wind farms on ecosystems by detecting the ecological corridors with LCP modeling in the context of the Ningbo Peninsula. The main targets of the study are to (1) construct a research framework to evaluate the impact of wind farms on ecological corridors, and (2) quantify corridor connectivity and propose conservation planning strategies. The paper is organized as follows: (1) source patches selection; (2) resistance surface generation; (3) LCD and LCP modeling analysis; 4) outcomes and recommendations. Based on the changes in ecological corridors in the study area before and after the construction of wind farms, the spatial structure and sensitive nodes of the ecological network can be analyzed to put forward practical recommendations for restoring the corridors. This paper helps to balance wind energy development and regional ecological security with the GIS spatial quantification research.
2. Material and methods
2.1. Research area
Ningbo Peninsula is located on the southeast coast of China, with a subtropical monsoon climate. China's wind power resources are concentrated in this 'coastal and island-rich zone' and follow a trend of increasing from inland, coastal, to offshore. The Ningbo Peninsula experiences average annual temperatures of 16.4 °C and precipitation totals of 1480 mm. Mountains, hills, and plains make up the landscape, and the soil is weakly acidic. The study area has abundant wind resources with an effective annual wind of 5000–6000 h and a wind power density of 100–200 W m−2. Ningbo City has a significant demand for electricity because of its developed economy. There is, however, a limited amount of land that can be used for wind farm construction due to the dense population density and limited land resources.
Since 2008, several wind farms, including Zhongying, Chuanshan, Baiyanshan, Tuci, and Yangtze wind farms, have been constructed in the Ningbo Peninsula's coastal region. The layout of the five wind farms around the Ningbo peninsula has a certain impact on the ecological corridor and landscape pattern of the locality. The total installed capacity of the five wind farms ranges from 45 MW to 67.5 MW, with hub heights of 60 to 80 meters. The specific parameters of each project are detailed in table 1.
Table 1. Wind farms located in Nibong City.
| No | Name | Construction year | Number of WTs | Capacity of each WT | Hub height | Total capacity |
|---|---|---|---|---|---|---|
| 1 | Zhongying Wind Farm | 2012 | 18 | 2.5 MW | 80 m | 45 MW |
| 2 | Chuanshan Wind Farm | 2012 | 30 | 1.5 MW | 80 m | 45 MW |
| 3 | Baiyanshan Wind Farm | 2014 | 30 | 2 MW/2.5 MW | 80 m | 67.5 MW |
| 4 | Tuci Wind Farm | 2012 | 20 | 1.5 MW | 80 m | 45 MW |
| 5 | Yangtze Wind Farm | 2008 | 33 | 1.5 MW | 61.5 m | 49.5 MW |
The Qiantang River, Jiufeng Mountain, Hengxi Scenic Tourism Area, and Dongqian Lake Tourism Resort are just a few examples of the nearby ecologically sensitive places and high-quality landscape resource areas where these five projects are located. In addition, the Lishan Island Marine Ecology National Nature Reserve is close to the study area, less than 15 km from the nearest Tuci wind farm (figure 2). The wind projects pose significant threats to the migration and habitats of wild birds. Given the critical geographical location and ecological sensitivity, Ningbo Peninsula was selected as the study area for the impact of wind farms on ecological corridors.
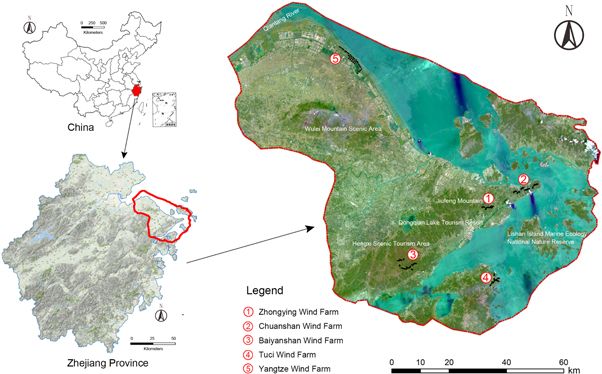
Figure 2. The location of research area in Ningbo, Zhejiang Province, China.
Download figure:
Standard image High-resolution image2.2. Methods
The research framework of this paper is illustrated in figure 3. First, the source and destination patches of ecological corridors are selected through variation trend analysis of NDVI between 2010 and 2020 (before and after the construction of wind farms). Second, the resistance surface of the ecological corridor analysis is synthesized by the following variations: land cover, vegetation cover, slope, relief, and distance from wind farms through raster calculator and reclassification in ArcGIS. Third, the ecological corridors are generated based on the least-cost path (LCP) method derived from the source and destination patches, and the landscape resistance surface. Finally, by comparing the corridors between 2010 and 2020, the length and cumulative cost of the corridors are calculated to assess the impact of wind facilities on the ecological network.

Figure 3. Research framework.
Download figure:
Standard image High-resolution image2.3. Data source
Based on the research target of comparing the ecological corridor before and after wind farm construction, the data of the Ningbo peninsula are selected, spanning the research period of 2010 to 2020. The Landsat 8 data with 30 m spatial resolutions were obtained from the Geospatial Data Cloud (http://gscloud.cn/search) in 2010 and 2020 respectively, which are preprocessed through ENVI (The Environment for Visualizing Images) for radiometric calibration and atmospheric correction. The location and detailed data of wind farms are obtained from the wind energy open data platform Vortex (https://interface.vortexfdc.com/). These images are processed through ArcGIS 10.6. The slope and relief of the research area were analyzed by DEM (Digital Elevation Model) from the Geospatial Data Cloud, with a spatial resolution of 30 m.
2.4. Data processing
In this research, Normalized Difference Vegetation Index (NDVI) is introduced to characterize the health status of vegetation. By comparing the difference between red light that is absorbed and near-infrared that is strongly reflected by vegetation, it indicates the amount of green vegetation present in the pixel. The NDVI is calculated through the bands in Landsat 8 as equation (1):

where Red and NIR stand for the spectral reflectance measurements acquired in the red (visible) and near-infrared regions, respectively. The land cover in 2010 and 2020 are respectively transferred from the NDVI with a value from −1 to 1, as listed in table 2.
Table 2. Transformation from NDVI range to landcover.
| Landcover | NDVI Range |
|---|---|
| Water | −0.28 to 0.015 |
| Built up area | 0.015 to .14 |
| Barren land | 0.14 to 0.18 |
| Shrub and Farmland | 0.18 to 0.27 |
| Sparse Vegetation | 0.27 to 0.36 |
| Dense Vegetation | 0.36 to 0.74 |
The vegetation cover is also processed through NDVI by equation (2):

where NDVIsoil is the NDVI value of barren land or area without vegetation cover, NDVIveg represents the NDVI value of the pixel completely covered by vegetation.
2.4.1. Selection of source patches
Source patches are essential units in the improvements of the ecological process. The source patches with high vegetation cover rates are usually more suitable for wildlife habitat and migration. Therefore, a comparison is conducted between two NDVI images in 2010 and 2020 to select areas with an increasing trend of NDVI value. Here we use the change rate S to represent the trend of NDVI in each grid with equation (3):

where S is the change rate of NDVI in each pixel, NDVIa stands for the value of NDVI of 2010, NDVIb stands for that of 2020. S > 0 means the optimization of vegetation cover. The larger the value is, the more apparent the improvement is. S < 0 indicates the degradation of vegetation health. The pixels with an improvement trend are selected as source patches, which are extracted as polygon features in ArcGIS.
2.4.2. Resistance surface
Resistance surfaces are widely used in landscape ecology research by modeling connectivity associated with conservation initiatives [50]. It provides a quantitative assessment of how environmental variables affect animal movement. Environmental variables are usually selected by whether they have an influence on the movement or migration of protected animals [51]. Land cover, vegetation coverage, relief, and slope are recognized as variables related to the resistance surface of the geophysical landscape, which was initially proved by other researchers [40].
In this research, noise pollution and the visual impact of wind farms are critical elements that affect the habitat and migration of species. The environmental impacts of wind turbines on wild animals fade with distance [52]. According to the Chinese Noise Limits and Measurement Method of Wind Power Plant (DL/T1084-2008), the allowable noise emissions are within 55 decibels (daytime) and 45 decibels (nighttime) in the rural area. According to the investigation of wind farms in the locality, the hub heights of wind turbines are about 60–80 m (table 1). Here we set the buffer distance based on the multiplication of the turbine height instead of fixed distance to simulate noise decay in real scenes. Therefore, indicators of land cover, vegetation coverage, relief, slope, distance from wind farms are selected as variables to generate the landscape resistance surface.
Table 3 illustrates the resistance values of each variable. The resistance value is set between 1 to 10. The value close to 1 indicates low resistance for species to move, while the value close to 10 reflects high resistance suffered during movement. In the variable of land cover, the dense vegetation has smallest resistance value, followed by sparse vegetation, shrub and grassland, water, barren land, and construction area. The higher the vegetation rate is, the lower the resistance value is. Conversely, the relief and slope are inversely proportional to resistance values. The noise and landscape visual impact are processed through buffer distance. The closer it is to the wind power facility, the greater the resistance, and vice versa.
Table 3. The resistance values for different variables.
| Variable | Classification | Value | Variable | Classification | Value |
|---|---|---|---|---|---|
| Land cover | Dense vegetation | 1 | Relief | <25 | 1 |
| Sparse vegetation | 2 | 25–50 | 3 | ||
| Shurb and grassland | 3 | 50–75 | 6 | ||
| Water | 5 | >75 | 9 | ||
| Barren land | 7 | Slope | <5 | 1 | |
| Construction area | 9 | 5–15 | 3 | ||
| Vegetation cover | >75% | 2 | 15–25 | 5 | |
| 60%–75% | 4 | 25–50 | 7 | ||
| 45%–60% | 6 | >50 | 9 | ||
| 30%–45% | 8 | Buffer distance | >100H | 1 | |
| <30% | 10 | 50–100H | 3 | ||
| 10–50H | 6 | ||||
| <10H | 10 |
Through the reclassification and raster calculator function running in ArcGIS, the above variables are synthesized into a comprehensive raster layer of resistance surface.
2.4.3. Least-cost path (LCP) analysis
The LCP is identified a singular least cost path connecting every two source patches based on cumulative cost. The LCP model is used to establish ecological corridors based on the resistance surface in this study, which is carried out in ArcGIS. First, the sources and target patches are designated in the filtered source patches. Second, the cost value and weight of each cell are prepared to calculate the resistance surface. The resistance surface is used to determine the minimum cumulative cost path, revealing how the cost factor promotes or hinders animal movement [40]. Third, the optimum path between the source and target patches is generated to simulate the migration route of the target species. This approach provides a quantitative database for ecological corridor studies.
3. Results
3.1. Ecological sources identification
The analysis and identification of ecological sources in this study combined the changing trend of NDVI values and the ecological spatial pattern in Zhejiang Province. Figure 4 and table 4 show the statistical characteristics of the NDVI changing trends during the 2010 to 2020 period. The variation values calculated by equation (3) were classified into five levels: (1) serious degradation (S ≤ −3); (2) degradation (−3 < S < −0.2); (3) unchanged (−0.2 < S < 0.2); (4) increase (0.2 < S < 3); (5) significant increase (s ≥ 3). The variation trend of each grid was listed in table 4, which illustrated that about 19.5% of NDVI grids remained unchanged, 63.62% showed a decreasing trend, and 16.88% increased.
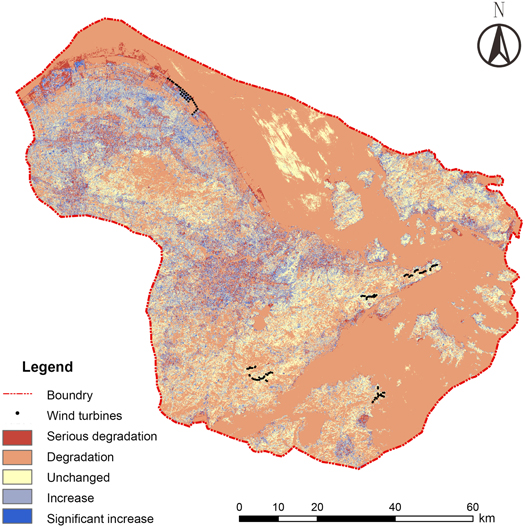
Figure 4. The spatial distribution of the changing trend of NDVI from 2010 to 2020.
Download figure:
Standard image High-resolution imageTable 4. Variation trend analysis of NDVI values from 2010 to 2020.
| Variation trend | Serious degradation | Degradation | Unchanged | Increase | Significant increase |
|---|---|---|---|---|---|
| Area(km2) | 374.4 | 5147.5 | 1691.8 | 1224.4 | 240.8 |
| Percent | 4.31% | 59.31% | 19.50% | 14.11% | 2.77% |
The serious degradation areas concentrated on the northern ports and industrial areas, adjacent to Changjiang Wind Farm. The degradation areas also included waters near Hangzhou Bay. In comparison, the unchanged areas were mainly mountains, forests, and farmland with high ecological quality. It is interesting that the increase areas concentrate in urban with band space.
The NDVI variations were represented by the changing trend of land cover, which was listed in table 5. It reflects the change in land use for various reasons such as population growth, urban sprawl, ecological degradation, and wind farm construction. Among the land cover categories, the water area decreased the most, from 43.42% to 27.19%, followed by the dense vegetation, from 15.05% to 6.06%. The built-up area, shrubs, farmland, and sparse vegetation have all increased moderately.
Table 5. The change of land cover from 2010 to 2020.
| Land cover | 2010 | 2020 | Change between 2010 and 2020 | ||
|---|---|---|---|---|---|
| Area (km2) | Percent (%) | Area (km2) | Percent (%) | ||
| Water | 3825.06 | 43.42 | 2395.73 | 27.19 | −1429.33 |
| Built-up area | 1396.20 | 15.85 | 2388.99 | 27.12 | 992.79 |
| Barren land | 359.17 | 4.08 | 614.24 | 6.97 | 255.06 |
| Shrub and Farmland | 912.74 | 10.36 | 1333.50 | 15.14 | 420.75 |
| Sparse Vegetation | 991.28 | 11.25 | 1543.83 | 17.52 | 552.55 |
| Dense Vegetation | 1325.85 | 15.05 | 534.02 | 6.06 | −791.82 |
It can be observed from figures 5(a) and (b) that the reduction of water area is mainly due to the land expansion along the coast of Hangzhou Bay for agriculture and industry. While the area with high landscape quality and ecological environment, such as Hengxi Scenic Tourism Area, showed varying degrees of dense forest degradation, and the junction between the mountain and the city has become farmland and barren land.

Figure 5. The changing trend of land use between 2010 to 2020 and sources identification.
Download figure:
Standard image High-resolution imageThe selection of ecological sources combined the variation trend of NDVI and land cover. In this study, six ecological patches close to the researched wind farms were identified as sources, as illustrated in figure 5(b), which all showed a degrading trend from dense vegetation to sparse vegetation and farmland. There is an urgent need to build ecological corridors and restore the ecological environment.
3.2. Resistance surface
Figures 6(a) and (b) present the spatial distribution of resistance surfaces without (6a) and with wind farms (6b). The grids of resistance surface without wind turbines showed continuous low scores in figure 5(a). By contrast, the scores remained higher and obviously stratified close to the wind facilities in figure 6(b).

Figure 6. The resistance surfaces with and without wind farms.
Download figure:
Standard image High-resolution image3.3. Least-cost path construction
The least-cost paths between each source were created under the scenes with and without wind farms (figure 7). There was supposed to be at least one ecological corridor between two patches to ensure species migration and material and information flow. The wind facilities have changed the routes and resistance value of the original ecological corridors.
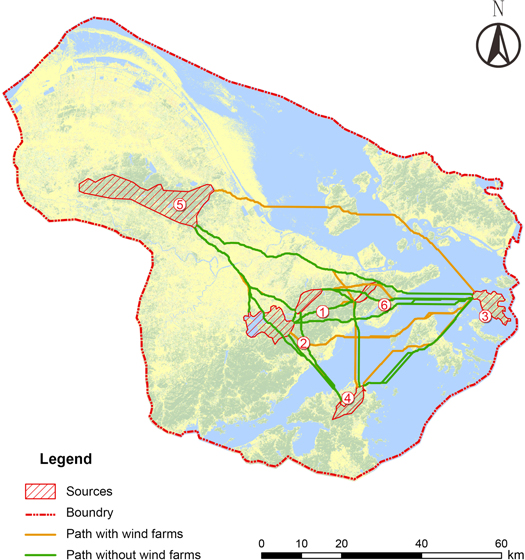
Figure 7. Potential ecological corridors with and without the wind power projects.
Download figure:
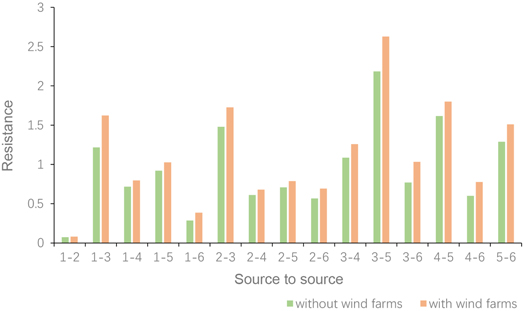
Standard image High-resolution imageThe cumulative resistance value of each path has been counted, as shown in figure 8. It reflected the apparent tendency that the construction of wind farms enlarged the resistance for species migration and information exchange. On average, each path increased the resistance value by 0.18. Additionally, the longer the path, the greater the added resistance value was. For instance, the resistance of the path from source 3 to source 5 increased most from 2.18 to 2.63, with the longest distance of 74.31 km. By contrast, the path from source 1 to source 2 was adjacent with the shortest distance, and the resistance value barely increased. The most influential paths were 3–5 and 1–3, with increases over 0.4.
Figure 8. The resistance of each path with and without wind farms.
Download figure:
Standard image High-resolution image
4. Discussion
4.1. Finding
It could be found in figure 6 that sources close to each other (e.g., sources 1, 2, and 4) received less influence from the wind farm, and their paths remained mainly unchanged. By contrast, the sources farther apart (sources 3 and 5) were significantly disturbed by wind farms. The long-distance paths were changed entirely, and the distance increased.
Among them, paths 2–3 and 3–5 deviated severely from their original trajectories and formed new ecological networks. The original paths went through forests, farmland, and grassland with good ecological conditions. In contrast, the changed paths influenced by wind farms were diverted to the sea, which seriously impacted the migration of some terrestrial animals. The increase in the resistance values (Two reference groups are with and without wind farm influence), as shown in figure 6, has resulted in the original paths no longer adapting to the current migration and transport needs. Changes in ecosystem quality are also reflected in the value of NDVI from 2010 to 2020. In terms of S value (the change rate of NDVI) around the wind farms, the areas around four of the five wind farms show varying degrees of degradation (figure 4). Except for Zhongying wind farm, because it is surrounded by Jiufeng Mountain with a comparatively stable environment.
In addition, we compared the effects of wind farms on ecological corridors at different spatial scales with the research by Guo et al [20]. The comparison revealed that relatively close and ecologically stable patches at larger spatial scales receive less disturbance, while patches far away may be at risk of disruption of connectivity due to wind farms. The difference is related to the relative location of the sources and the wind farms. Guo et al selected the sources around wind farms, leading to very significant variables in the least-cost distance, much larger than the data in this study. In contrast, the sample wind farms in this study are located in the coastal region, while the selected sources are inland mountainous areas, which have solid ecological connectivity and therefore suffer from less disturbance.
Based on the findings of this study, we found that medium-sized wind farms (≤50 MW) can have an impact on the ecological corridors within a radius of 50 km. The magnitude of the impact on corridor length and cumulative resistance value needs to refer to the distance between the sources, the ecological quality, and the areas of the source patches [40]. This study provides a scientific and precise method for wind farm site selection at the regional level that takes ecological safety into account. By adjusting the parameter composition of the landscape resistance surface, the migration corridors for protected species can be generated more precisely, and conservation strategies can be proposed. For instance, the red kites that need ample action space can be free from wind farm interference and obtain more accurate migration path simulation and conservation measures [53].
4.2. Recommendation
4.2.1. Involve ecological conservation in legislation
To ensure the environmental license approval, several environmental impacts (e.g., noise, shadow flicker, landscape impact, destruction of water sources and forests) are under strict restriction with a continuously complete legislation framework [15]. The related laws and regulations:
- (1)The Technical Code for Environmental Impact Assessment of wind farm projects (NB 31087–2016).
- (2)Noise limits and measurement method of wind power plant (DL/T1084-2008).
- (3)Land use indicators for power engineering projects-Wind farm (ZBBZH/DLFD-2012).
- (4)Code for design of wind farm (GB 51096-2015).
- (5)Code on the operation of wind power plant (DL/T 666-1999).
provide guidelines for environmental impact assessment, but little concern about the potential ecological degradation on a larger scale. This study quantifies the change in ecological corridors and is expected to be involved in environmental impact assessment legislation as a standard.
4.2.2. Prevent disorder urban sprawl
By 2020, the urbanization rate of Ningbo City reached 78.4%, which was 13.4% higher than that in 2010. The rapid growth of urban population needs more construction land. By comparing the NDVI values and the magnitude of changes between the ten years (figure 3), it can be observed that the areas of urban fringe show a serious decline in vegetation quality. The natural land (dense vegetation, sparse vegetation, shrub, and grassland) also presents slight decline in ecological quality. It is necessary to restrict the margin between urban and natural land by effective legislation. Effective use of barren land and low coverage grassland can reduce the exploitation of green space and protect the core ecological protection zones.
In an idealized scenario, the Least-cost path model only distinguishes the scenarios with and without wind farms by adding an indicator of buffer distance, except for the possibility of influence from urbanization. This study reduces the interference of factors such as urbanization, infrastructure, and climate change on corridor parameters by selecting the location of the source patch around the wind farm, but it still cannot guarantee that it will completely get rid of the influence of the above factors.
4.2.3. Strengthen the density of ecological network
The three corridors (1–5, 2–5, and 5–6) in figure 6 lack patches of green space to serve as stepping stones through the urban built-up area, resulting in weakened connectivity. If the only patches along the corridor show decline, it will lead to the paralysis of the ecological network function. New patches need to be added in ecologically sensitive areas with lower habitat quality and higher degradation on the urban fringe. Increasing the density of ecological network by adding stepping stones could be focused on the areas that affected by human activities [47]. Through the construction of a 'large patch-small patch-corridor' model, the connectivity of ecological networks and the resilience to human activities can be enhanced.
4.2.4. Restore essential patches and corridors
The patches selected as sources also show varying degrees of vegetation decline, resulting in a shrinking area of ecological network coverage. Critical patches with significant location and connectivity need to be protected and restored to achieve higher benefits and efficiency of ecoservice. The self-healing, information transport and disturbance resistance of the patches can be enhanced by optimizing vegetation, protecting biodiversity, and water and soil conservation measures [40].
4.3. The advantage of the least-cost path method
The purpose of this study is to explore the spatial range and magnitude of environmental impact that wind farms cause. The first task is to detect which components of the wind farm may cause harmful effects on the ecosystem. From the chronological perspective, the environmental impacts are derived from the processes of construction, operation, dismantling, and repowering. In the phase of construction, road construction for site access, haulage routes, foundation construction, Earthwork, and other technical support (such as substations and on-site assembly sites) may cause dust, vegetation degradation, compaction, and other influences on the landscape. The ecological impact in the operational phase is derived from the rotating blades, warning lights, shadow flicker, soil erosion, and noise, which may be superimposed to influence the migration and habitat of wild animals [54], even impairment to human health in the long-turn [55]. In dismantling and repowering, constructive sewage, solid waste, noise, vibrations, and dust can aggravate ecological degradation and even destroy the functions of some essential ecological corridors. The replacement of higher wind turbines poses a critical challenge to planning permits with sensitive ecological structures [56].
This research provides a systemic framework to quantify the changes in ecological patches and corridors with the construction of large-scale infrastructure facilities (not limited to wind farms). Based on the open data flatforms, NDVI values in different years before and after the wind farm construction were synthesized through the remote sensing data of Landsat 8 and the digital elevation model. The visualized outputs can present spatial changes and the least-cost of each ecological corridor, providing reasonable suggestions for regional ecological planning and wind farm site selection. For the established large-scale wind farms, the compensation measures for ecological degradation can be quantified and concretely implemented based on this method.
In addition, by generating landscape resistance surfaces and path resistance values between critical ecological sources, the changes of wind farms on regional ecological networks can be observed in real-time, facilitating the formation of new ecological networks with human guidance, and gradually reducing the ecological and environmental disturbances caused by wind turbines to the local area.
4.4. Research limitation
With the rapid expansion of wind farms on the southeast coast of China, the common awareness of the negative effects on the natural system caused by wind farms is increased. Except for the specific environmental impacts discussed in section 4.2, the potential long-term impacts of wind farms on ecosystems at regional scales remain to be studied. There is an increasing demand for assessing and forecasting the connectivity and ecological stability of ecological corridors within the region [50]. The least-cost path length [57], least-cost corridor [58, 59], resistant kernel distance [60], and other methods of ecological distance assessment have been widely used in the protection of ecosystem, species, and landscape connectivity. There is no currently accepted ecological distance standard.
In this study, the least-cost path is selected to detect the ecological distance. Because it is a measure of effective distance with the cumulative cost calculation based on geographical restrictions, environmental influence, and specific protective targets of the regions studied [48]. It is widely used in researching species' behavioral aspects and habitats. We applied this method to assess the ecological influence of wind farms by detecting the corridors for species' habitats and migration paths.
Since the criteria for the ecological impact of the wind farm have not yet been established, this study is a pilot in the Ningbo Peninsula area. During calculating the least-cost path in ArcGIS, every grid cell (30 * 30 m) was assigned a resistance value, usually synthesized by several variables - according to its hindering effects on species' movement. There are limitations to the horizontal comparison of ecological disturbances in different regions. The composition of resistance surface, the weight of variables, and critical sources identification were summaries by previous studies, which may lead to differences and even conflicts with other ecological corridor determination methods.
In addition, there are quite a few discussions about the accuracy and validity of the LCP method to simulate ecological corridors. Tang et al [40] proposed that the LCP method was closely related to the migration conditions of specific species and needed to develop resistance surfaces for different species; Guo et al [20] advocated that there were inevitable deviations between the simulated least-cost path and existing ecological corridors, which needed to be corrected during fieldwork. Some scholars also suggested that the width of corridors is much more important than the length, which is an indicator missing in the LCP method [48].
5. Conclusions
This study evaluated the impact of onshore wind farms on the ecological corridors in Ningbo, Zhejiang Province, China. The results showed that the wind farms not only significantly increased the resistance to the formation of ecological corridors, but also caused varying degrees of landscape degradation, as reflected in changes in land cover and vegetation cover. These negative effects indirectly lead to an increase in the length of the ecological corridors and a decrease in the corridor patency. Sources with long distance suffer more challenges in changes of route and corridor function degradation. This study can promote the protection of ecological corridors in wind farm site selection, as well as the restoration and enhancement of corridors after construction.
This paper was still limited in in the composition of the resistance surface. The various variable indicators and weights that constitute the resistance surface also influence the layout of ecological corridors for different species. This method could also be improved to protect the marine species under the context of offshore wind farms. However, the impacts on ecological corridors from urbanization and other infrastructure cannot be well separated from wind farms. This interference can be reasonably avoided when the research scope and land use type are limited to a small range. It is worth noting that, as one of the clean energy sources, wind energy is already the optimal solution for population and economic growth, and its harm to the ecological corridor is much less than that of fossil energy. It would be an extensive research topic to make a comprehensive comparison of energy benefits and environmental costs between two energy sources.
This paper demonstrated the negative impacts of wind farms on regional ecological corridors. Therefore, a rigorous ecological impact assessment prior to the construction of wind farms is crucial. This paper uses the LCP method for quantitative evaluation to innovatively balance wind power development and ecological protection.
Data availability statement
The data that support the findings of this study are available upon reasonable request from the authors.
Figure 1 (0.2 MB JPG) The total capacity and newly installed wind energy in China
Figure 2 (2.1 MB JPG) The location of research area in Ningbo, Zhejiang Province, China
Figure 3 (0.9 MB JPG) Research framework
Figure 4 (3.7 MB JPG) The spatial distribution of the changing trend of NDVI from 2010 to 2020
Figure 5 (3.8 MB JPG) The changing trend of land use between 2010 to 2020 and sources identification
Figure 6 (3.4 MB JPG) The resistance surfaces with and without wind farms
Figure 7 (3 MB JPG) Potential ecological corridors with and without the wind power projects
Figure 8 (0.1 MB JPG) The resistance of each path with and without wind farms